

Trade Ideas Fx-Futures-Etf-Crypto
EURGBP, EWA(ARCA), IWF(ARCA), FHEQ(CBOE)

EURGBP-Short Idea
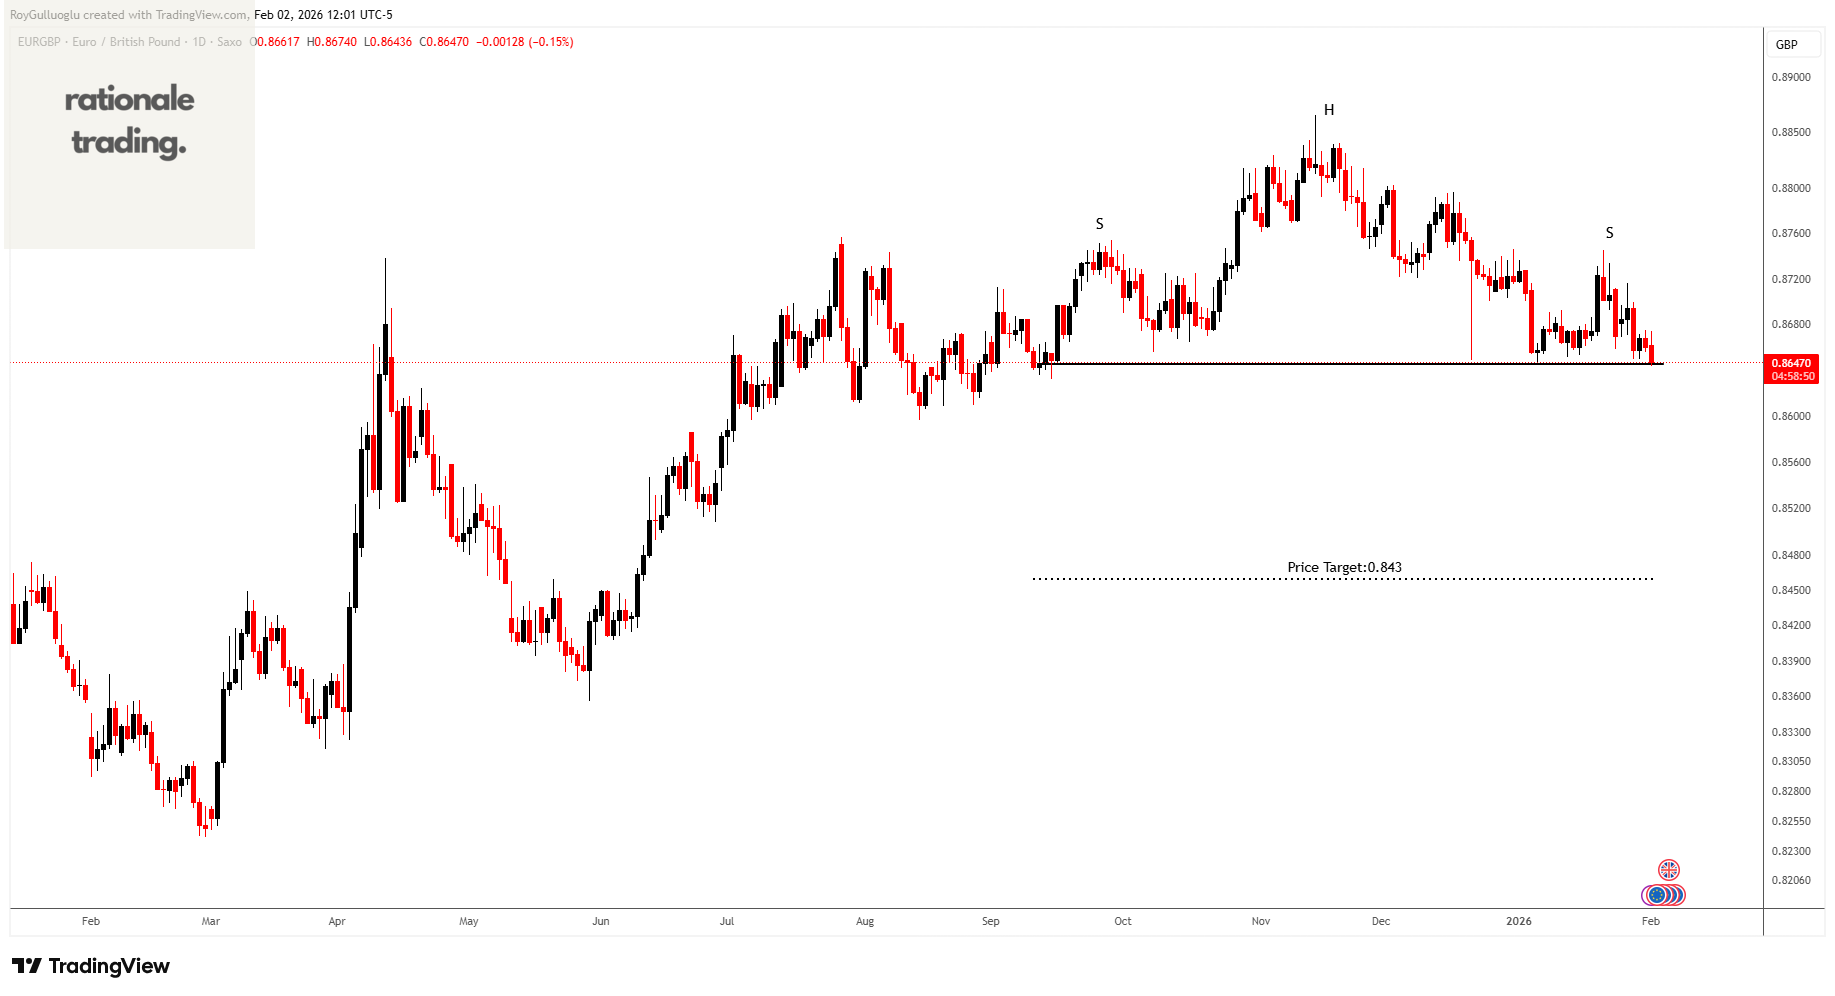
The above daily chart formed an approximately 3-month-long H&S top chart pattern as a bearish reversal after an uptrend.
The horizontal boundary at 0.8645 levels acts as a support within this pattern.
A daily close below 0.863 levels would validate the breakdown from the 3-month-long H&S top chart pattern.
Based on this chart pattern, the potential price target is approximately 0.843 levels.
EWA(iShares MSCI Australia ETF)-Long Idea
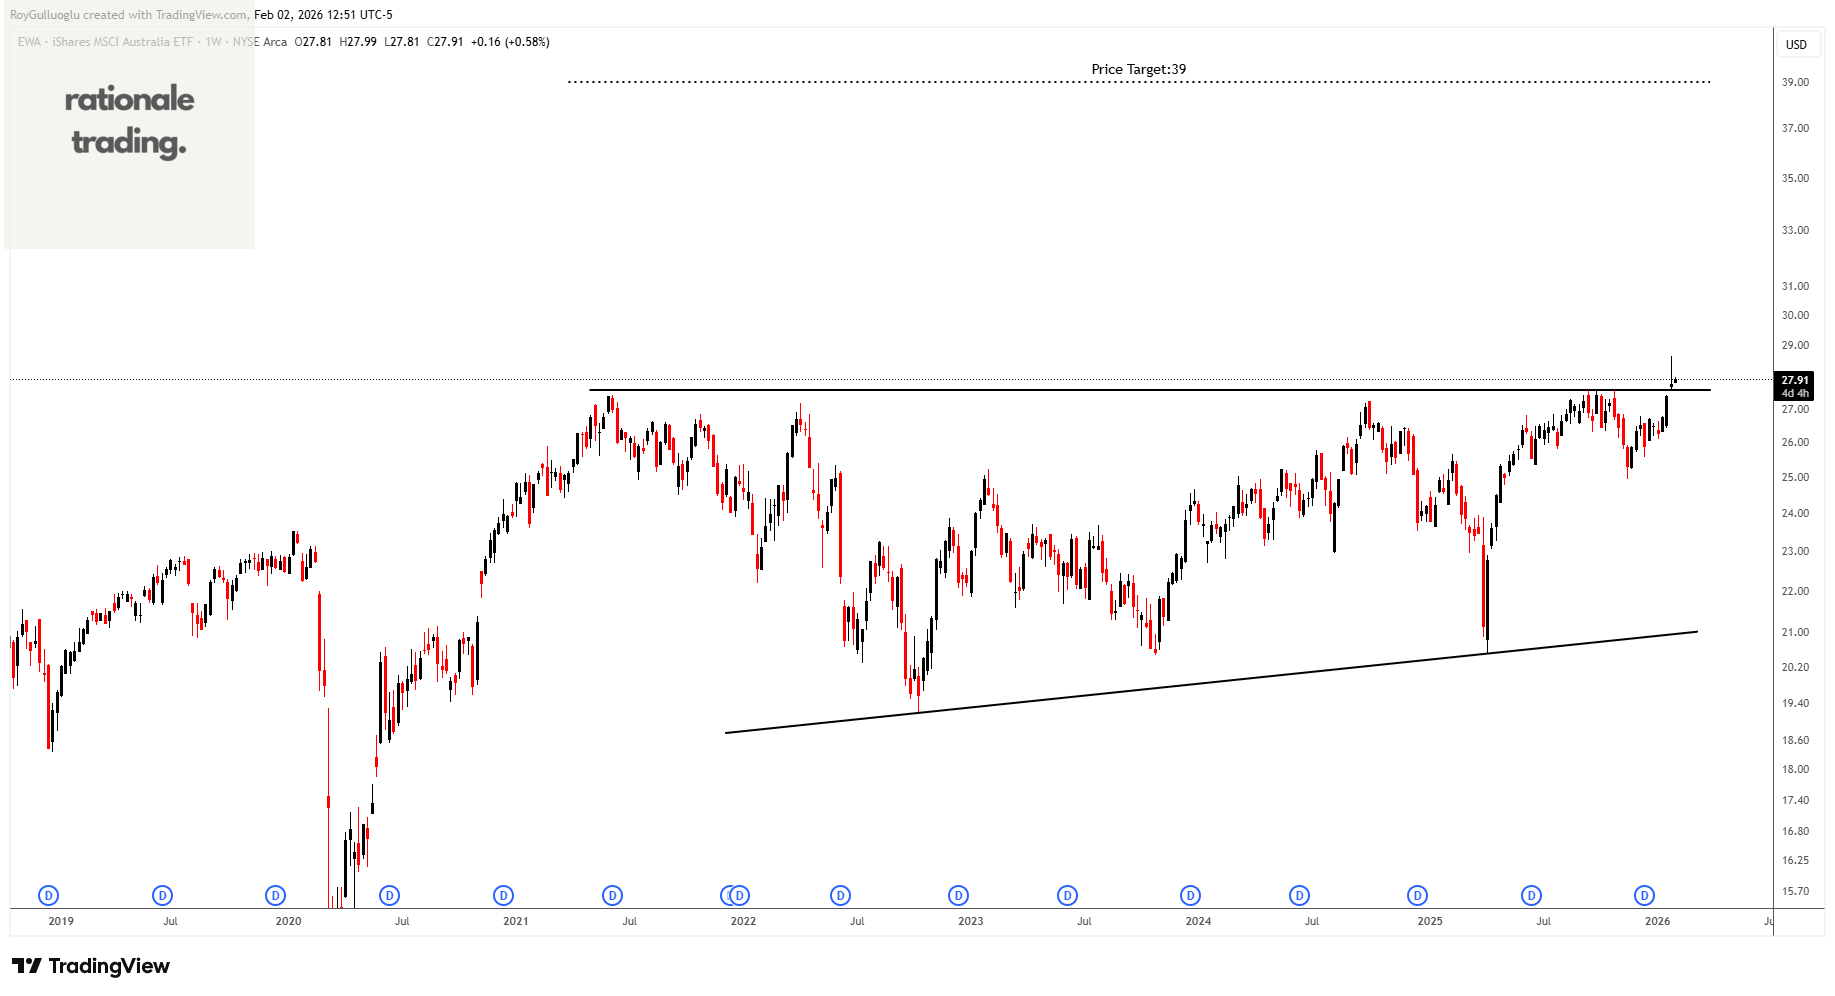
EWA tracks a market-cap-weighted index of Australian stocks.
The above weekly chart formed an approximately 60-month-long ascending triangle chart pattern as a bullish continuation after an uptrend.
The horizontal boundary at 27.57 levels acts as a resistance within this pattern.
A daily close above 28.4 levels would validate the breakout from the 60-month-long ascending triangle chart pattern.
Based on this chart pattern, the potential price target is approximately 39 levels.
IWF(iShares Russell 1000 Growth ETF)-Long Idea
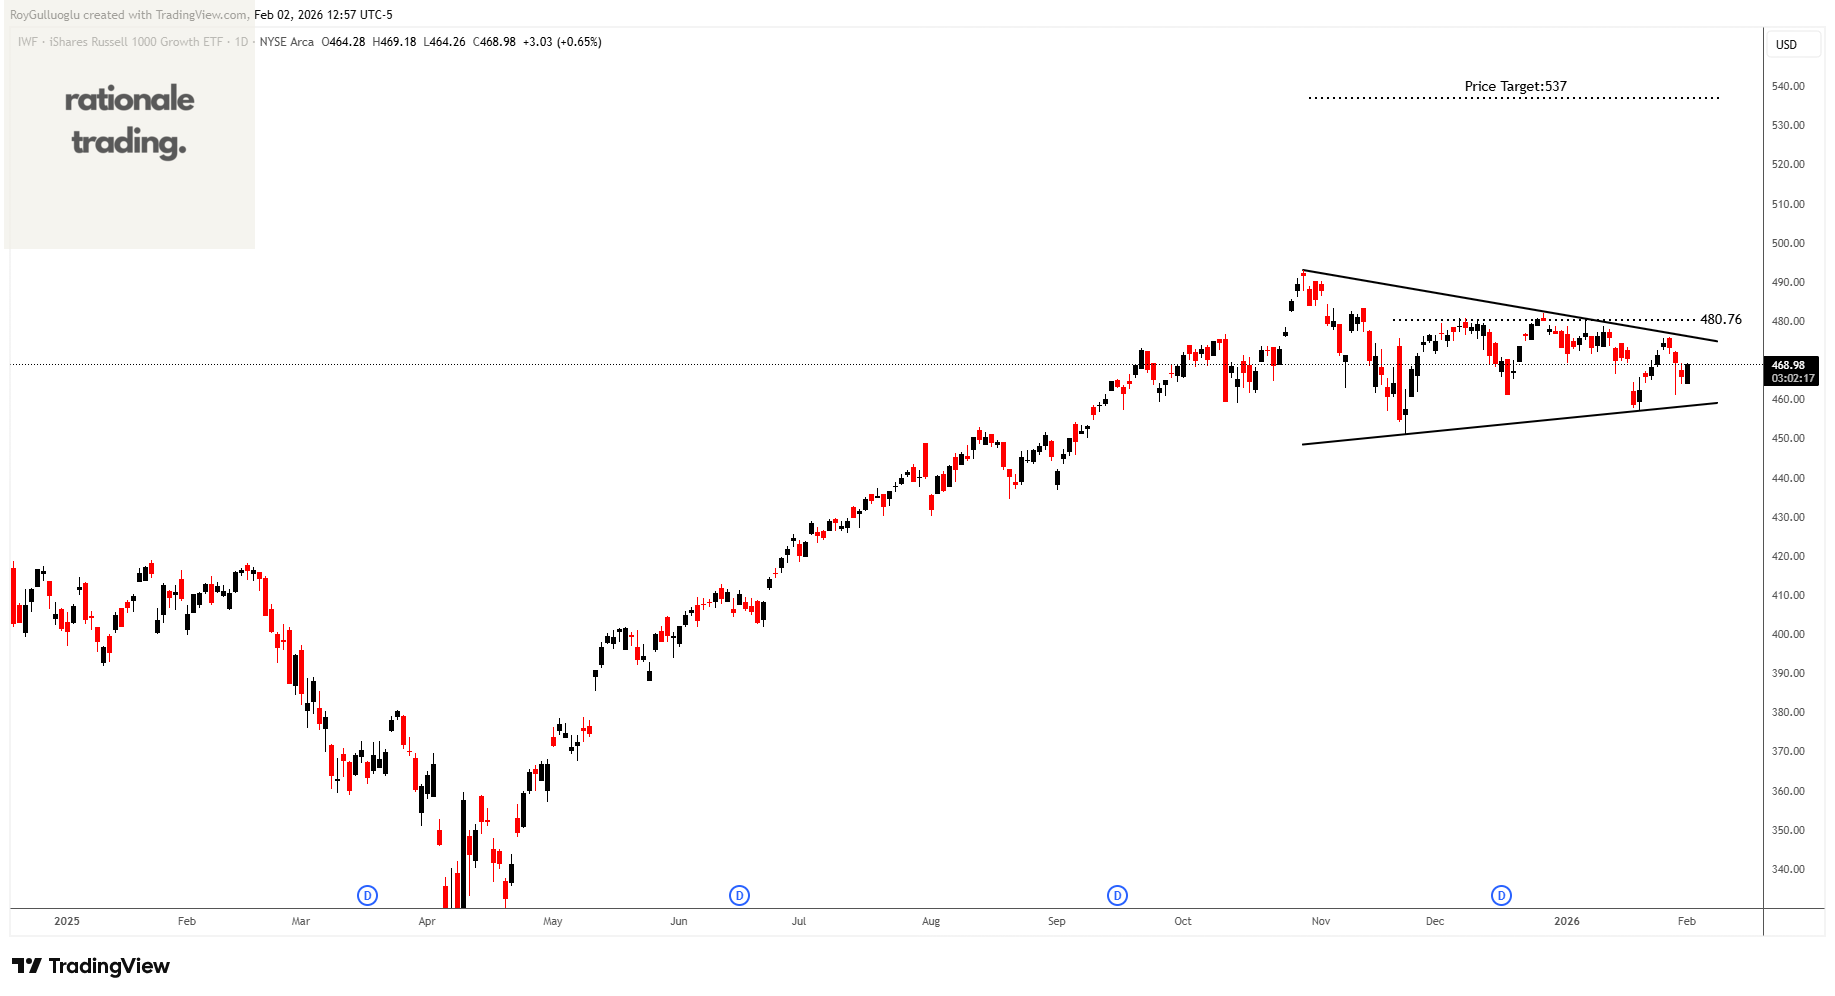
IWF tracks an index of US large- and mid-cap stocks selected from the Russell 1000 Index with the highest growth characteristics, based on Russell’s style methodology.
The above daily chart formed an approximately 2-month-long symmetrical triangle chart pattern as a bullish continuation after an uptrend.
The horizontal boundary at 480.76 levels acts as a resistance within this pattern.
A daily close above 483.76 levels would validate the breakout from the 2-month-long symmetrical triangle chart pattern.
Based on this chart pattern, the potential price target is approximately 537 levels.
FHEQ(Fidelity Hedged Equity ETF)-Long Idea
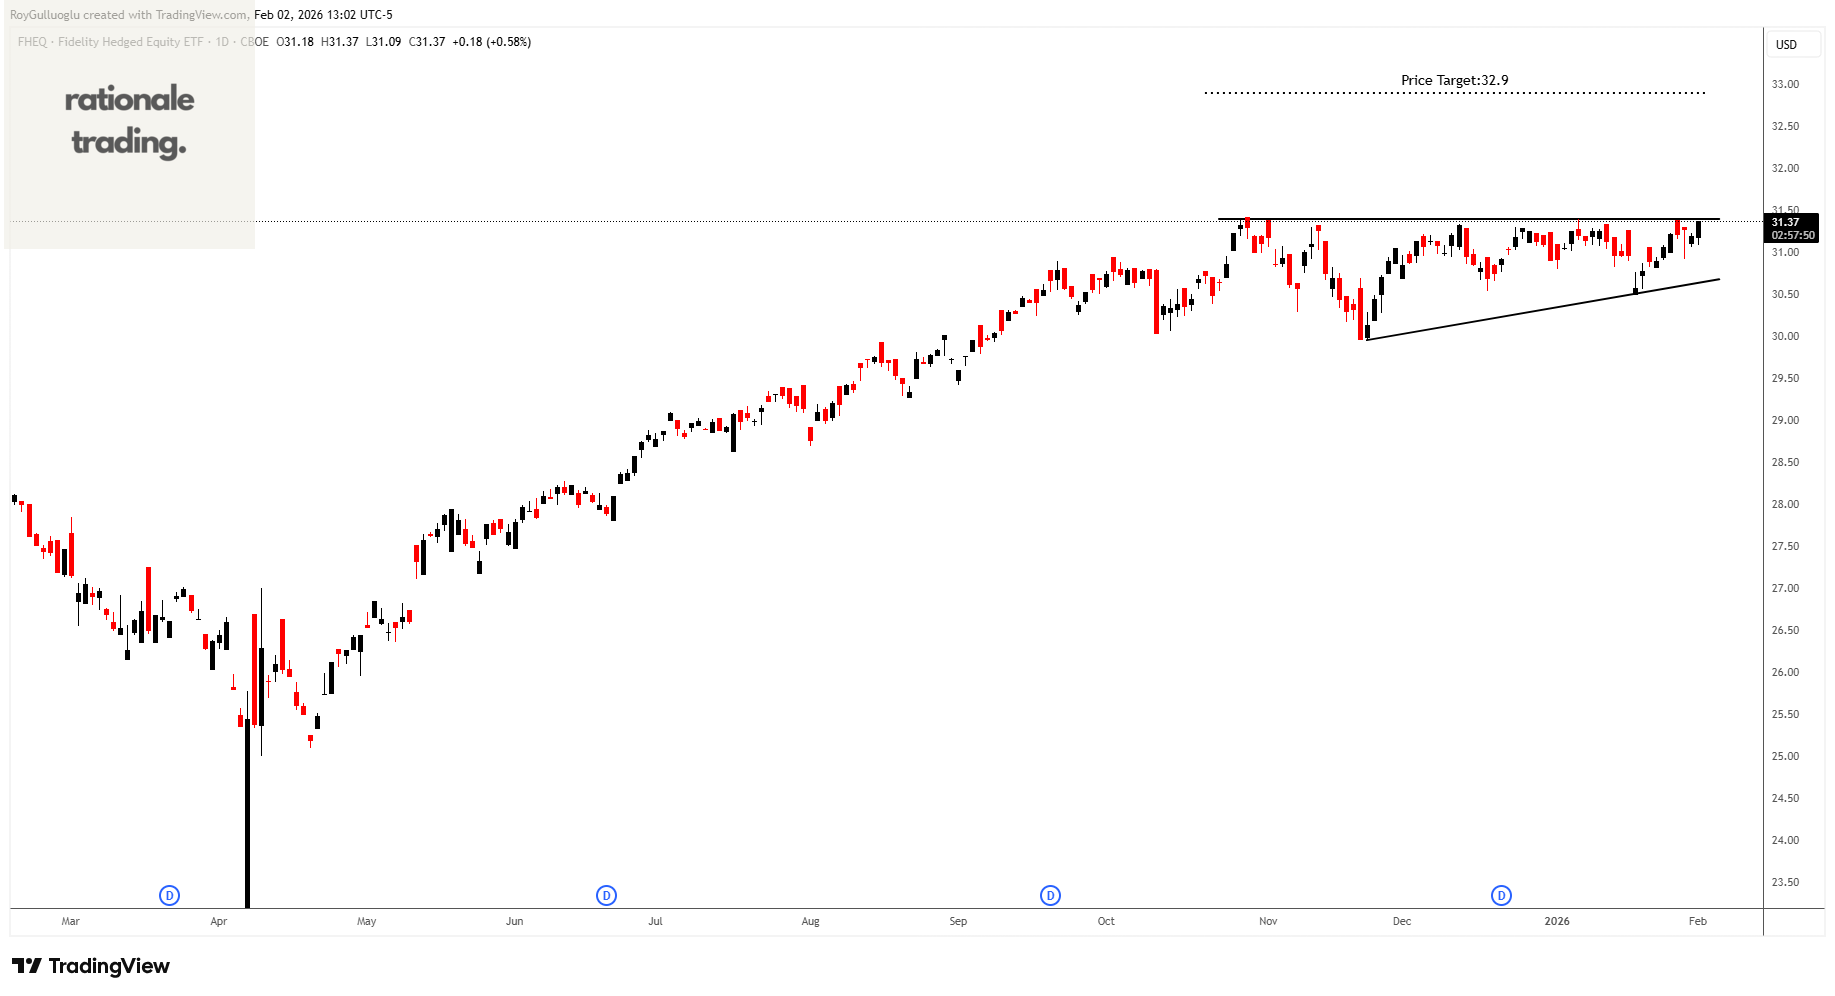
FHEQ is actively managed, investing in equity securities with market caps similar to the S&P 500 and Russell 1000. The fund seeks capital appreciation, utilizing quantitative analysis of several fundamental factors and put options for downside protection.
The above daily chart formed an approximately 2-month-long ascending triangle chart pattern as a bullish continuation after an uptrend.
The horizontal boundary at 31.4 levels acts as a resistance within this pattern.
A daily close above 31.53 levels would validate the breakout from the 2-month-long ascending triangle chart pattern.
Based on this chart pattern, the potential price target is approximately 32.9 levels.