

Trade Ideas Equities
BIP(NYSE), CTRA(NYSE), WOR(NYSE), ECG(NYSE), ESCOM(BIST), KUYAS(BIST)

Brookfield Infrastructure Partners L.P.-(BIP/NYSE)-Long Idea
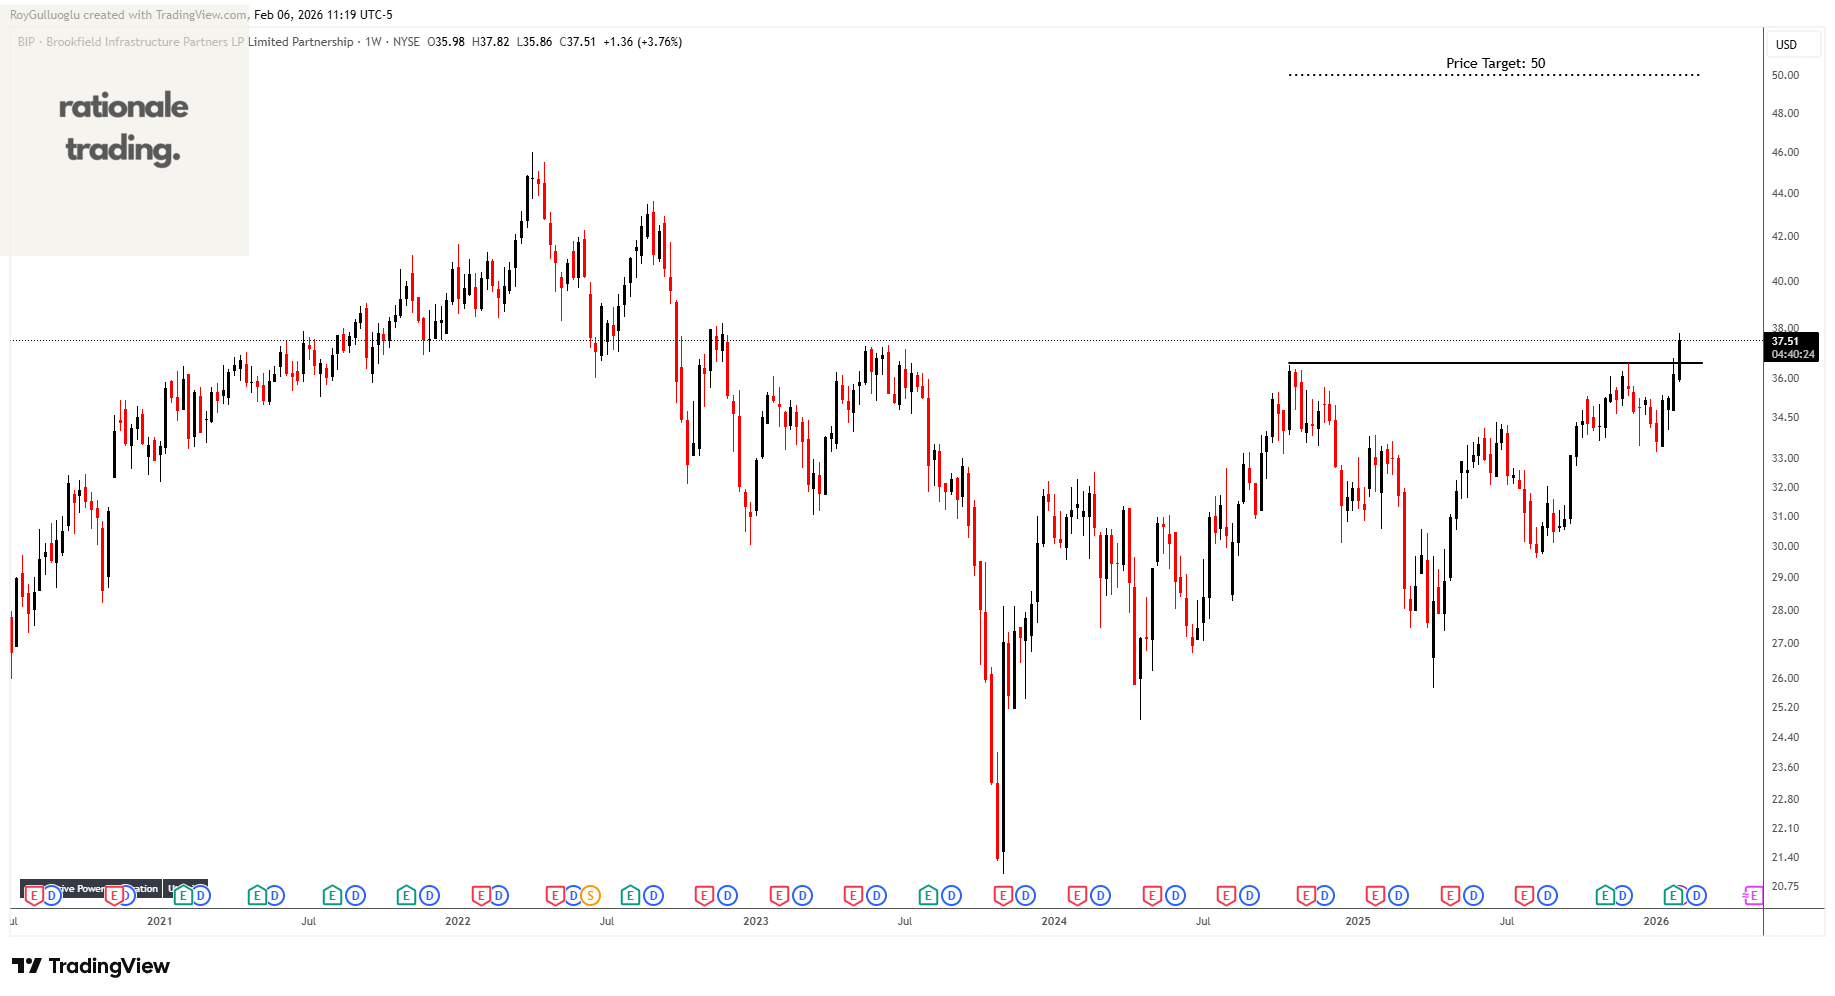
Brookfield Infrastructure Partners L.P. engages in the utilities, transport, midstream, and data businesses.
The above weekly chart formed an approximately 20-month-long Cup & Handle chart pattern as a bullish continuation after an uptrend.
The horizontal boundary at 36.58 levels acts as a resistance within this pattern.
A daily close above 37.67 levels would validate the breakout from the 2-month-long Cup & Handle chart pattern.
Based on this chart pattern, the potential price target is 50 levels.
Coterra Energy Inc.-(CTRA/NYSE)-Long Idea
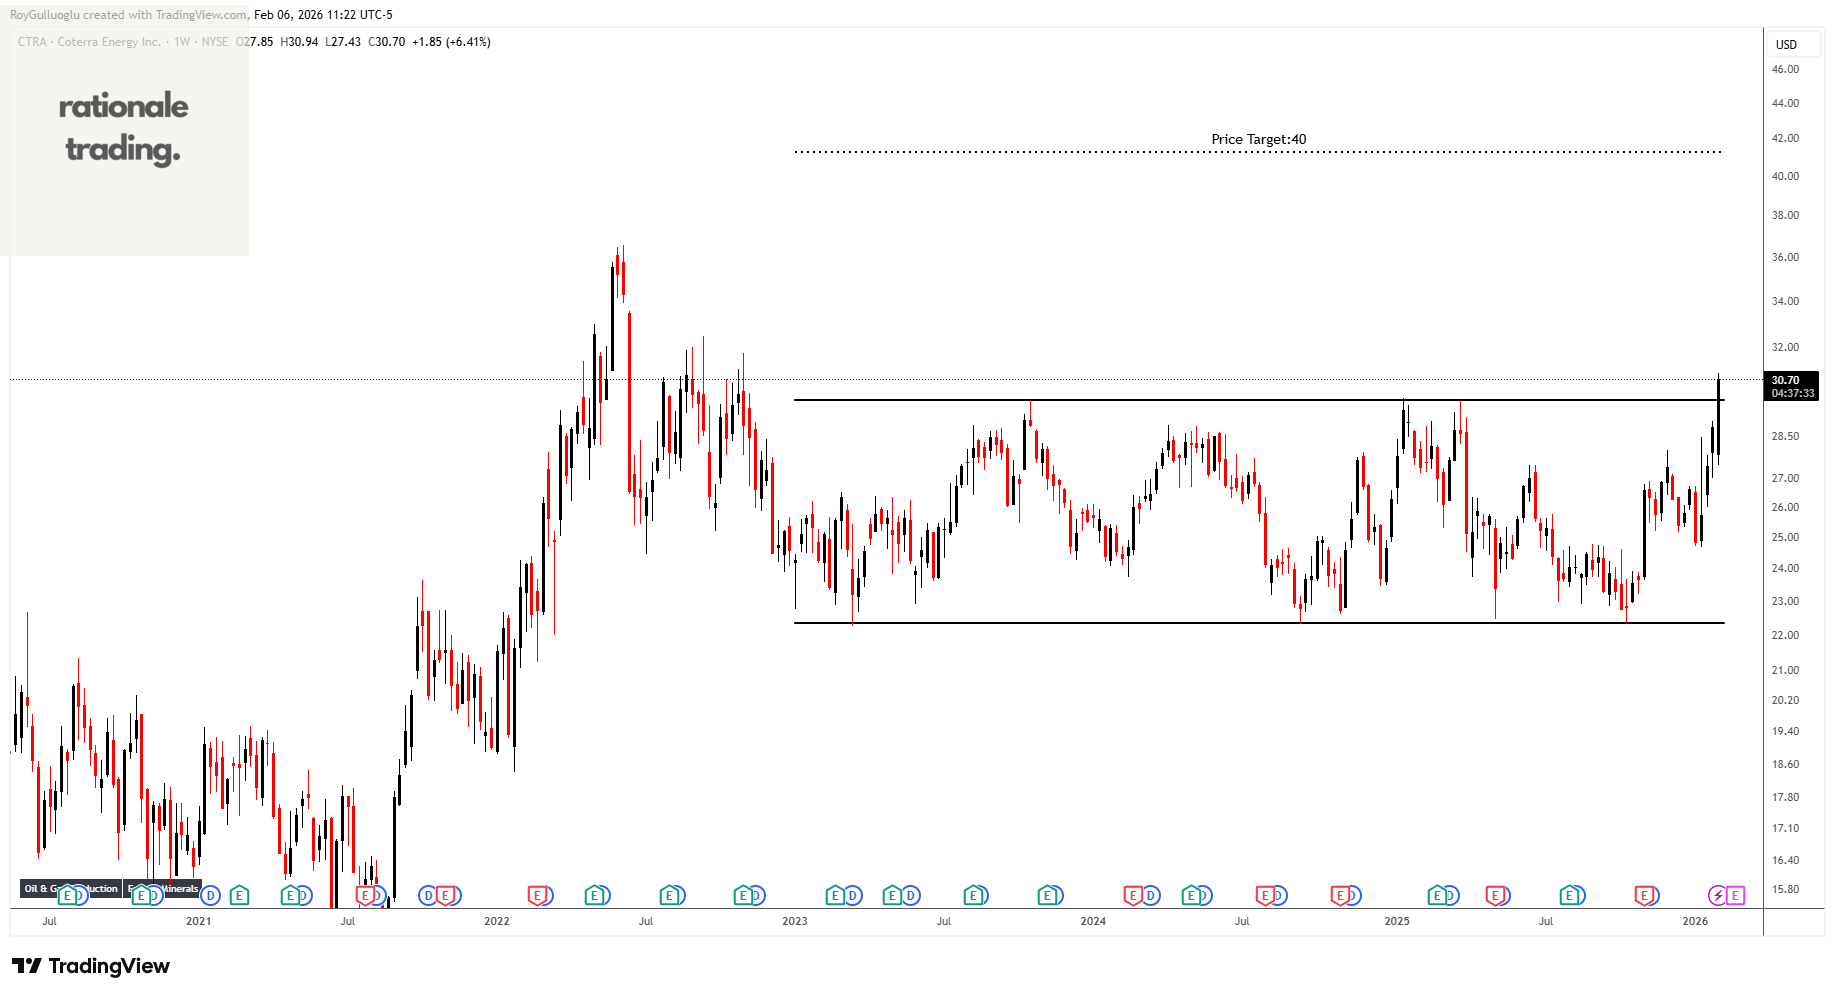
Coterra Energy Inc., an independent oil and gas company, engages in the exploration, development, and production of oil, natural gas, and natural gas liquids in the United States.
The above weekly chart formed an approximately 20-month-long Cup & Handle chart pattern as a bullish continuation after an uptrend.
The horizontal boundary at 29.89 levels acts as a resistance within this pattern.
A daily close above 30.7 levels would validate the breakout from the 20-month-long Cup & Handle chart pattern.
Based on this chart pattern, the potential price target is 40 levels.
Worthington Enterprises, Inc. -(WOR/NYSE)-Long Idea
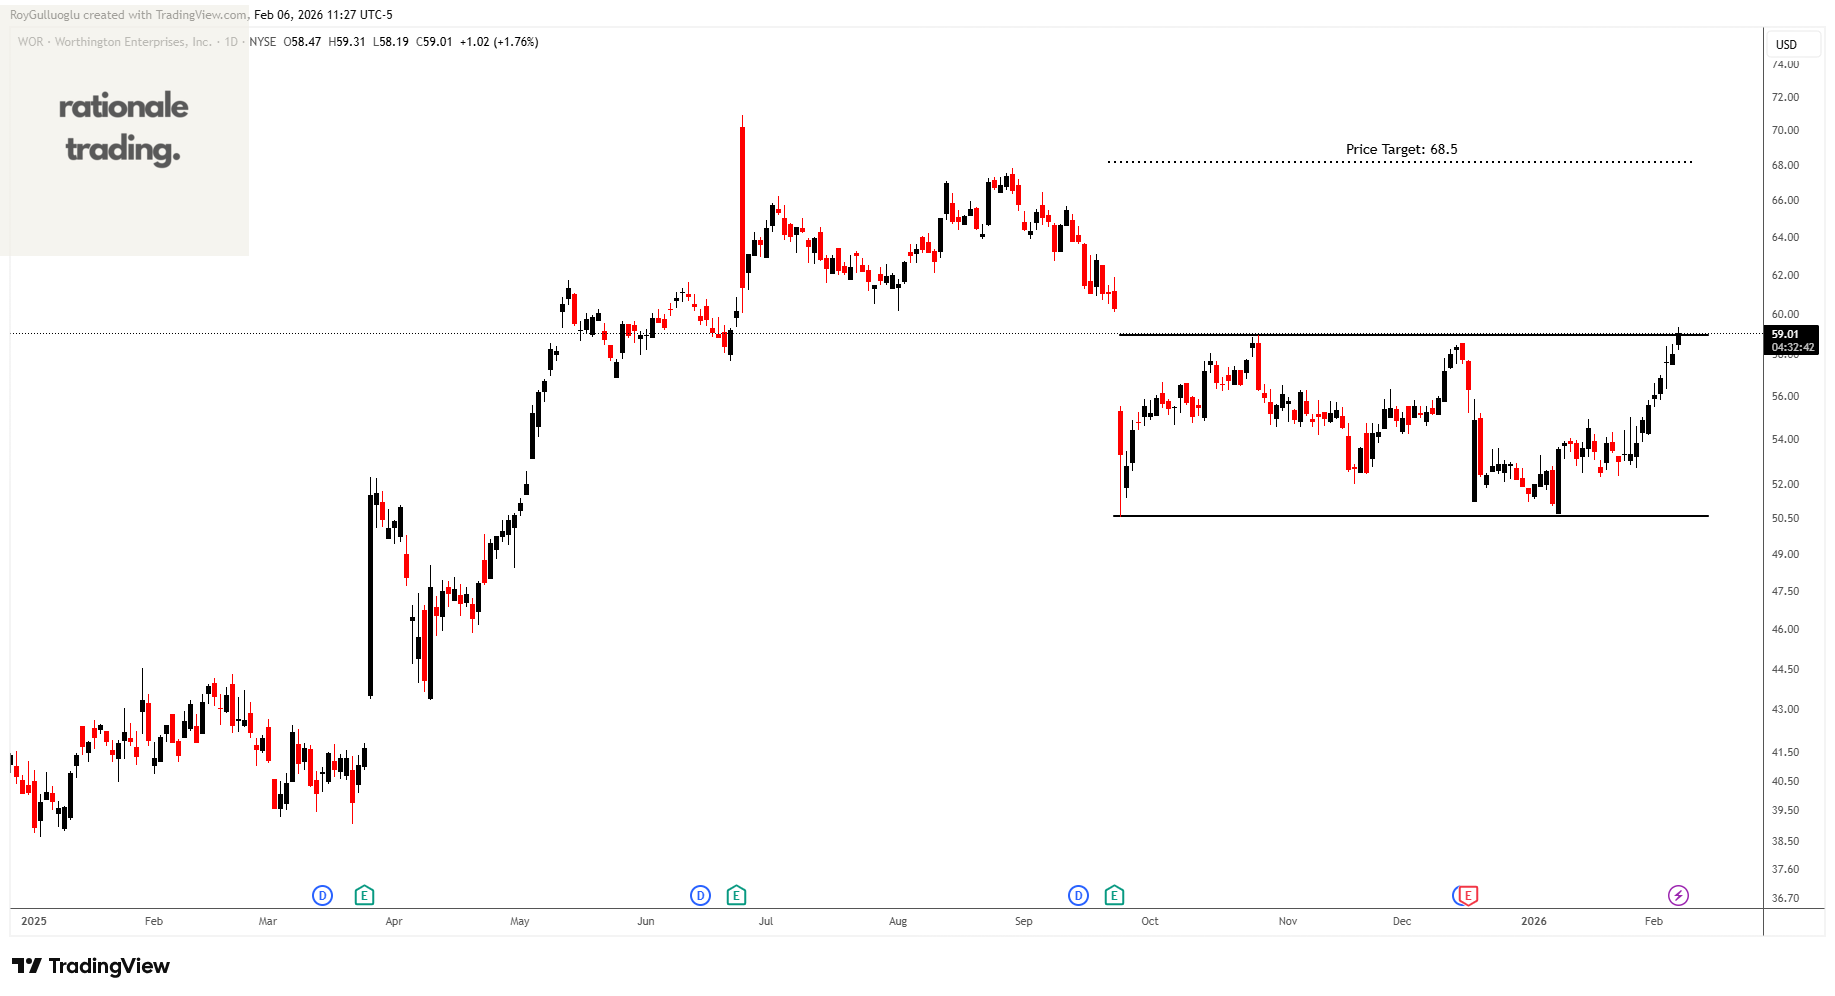
Worthington Enterprises, Inc. operates as an industrial manufacturing company. It operates through two segments, Consumer Products and Building Products.
The above daily chart formed an approximately 3-month-long rectangle chart pattern as a bullish reversal after a downtrend.
The horizontal boundary at 58.94 levels acts as a resistance within this pattern.
A daily close above 60.7 levels would validate the breakout from the 3-month-long rectangle chart pattern.
Based on this chart pattern, the potential price target is 68.5 levels.
Everus Construction Group, Inc. -(ECG/NYSE)-Long Idea
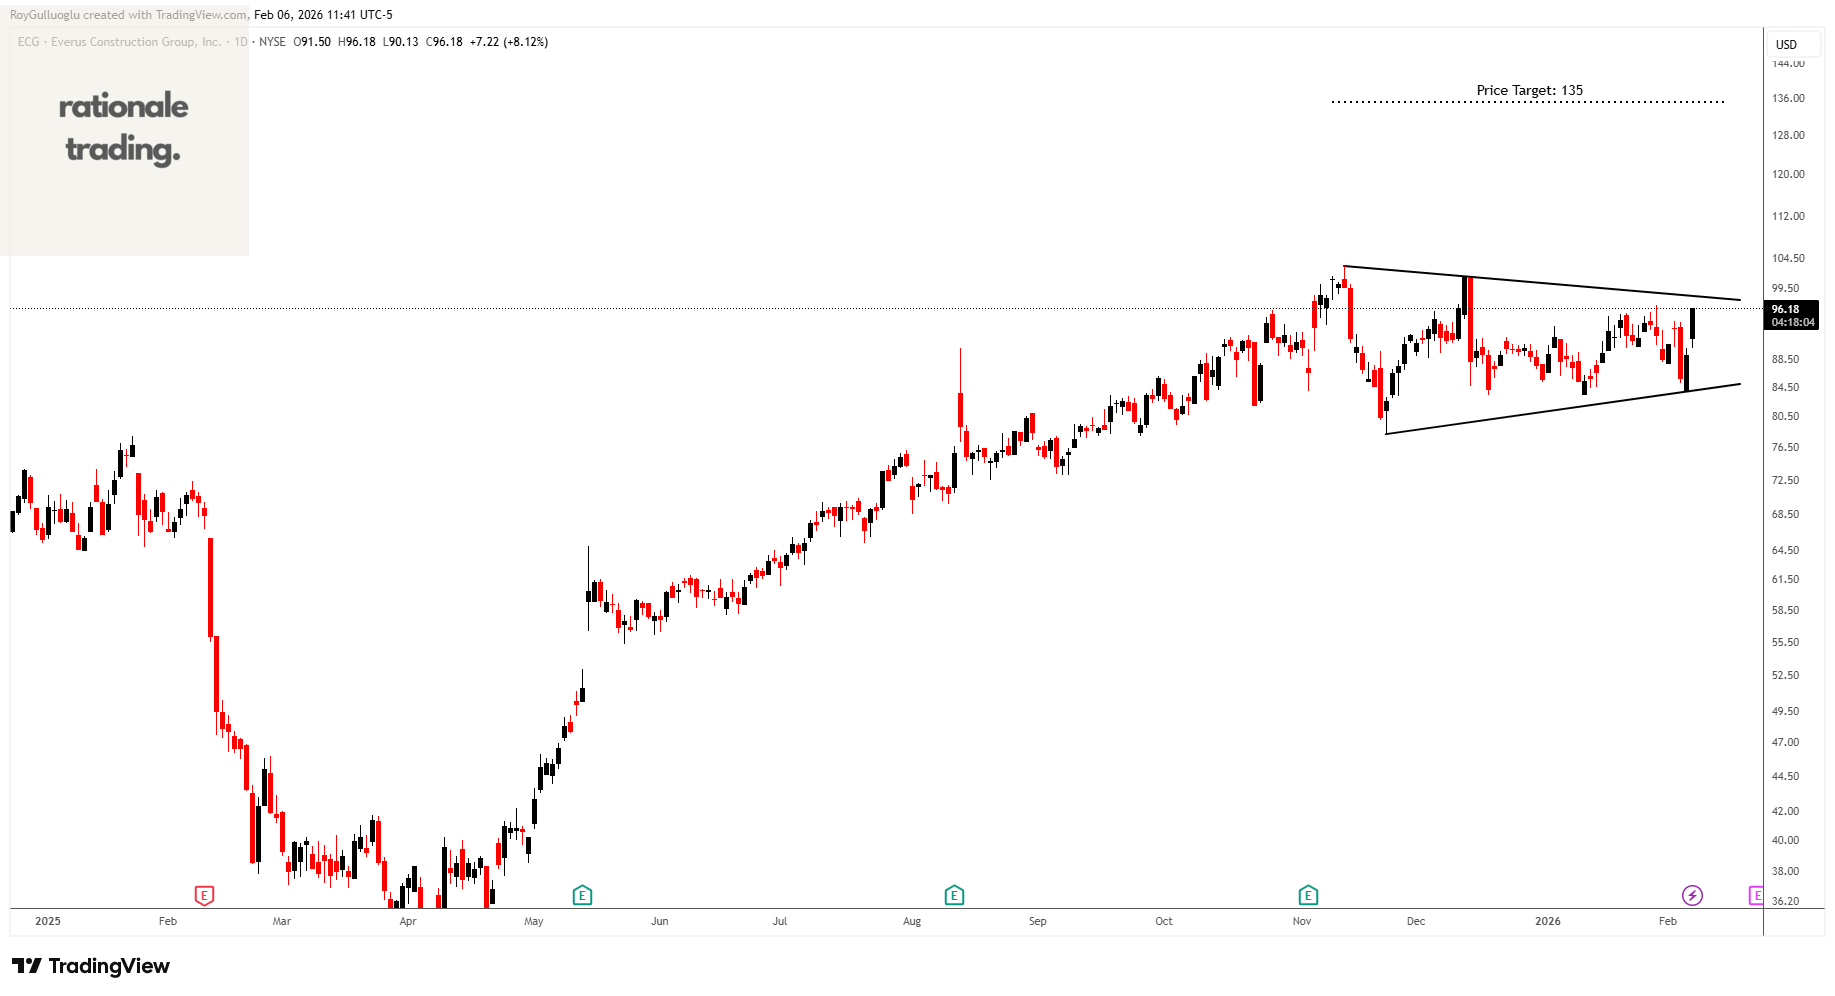
Everus Construction Group, Inc. provides contracting services in the United States. It operates through two segments, Electrical & Mechanical and Transmission & Distribution.
The above daily chart formed an approximately 2-month-long symmetrical triangle chart pattern as a bullish continuation after an uptrend.
A daily close above 101.45 levels would validate the breakout from the 2-month-long symmetrical triangle chart pattern.
Based on this chart pattern, the potential price target is 135 levels.
Escort Teknoloji Yatırım A.Ş.-(ESCOM/BIST)-Long Idea
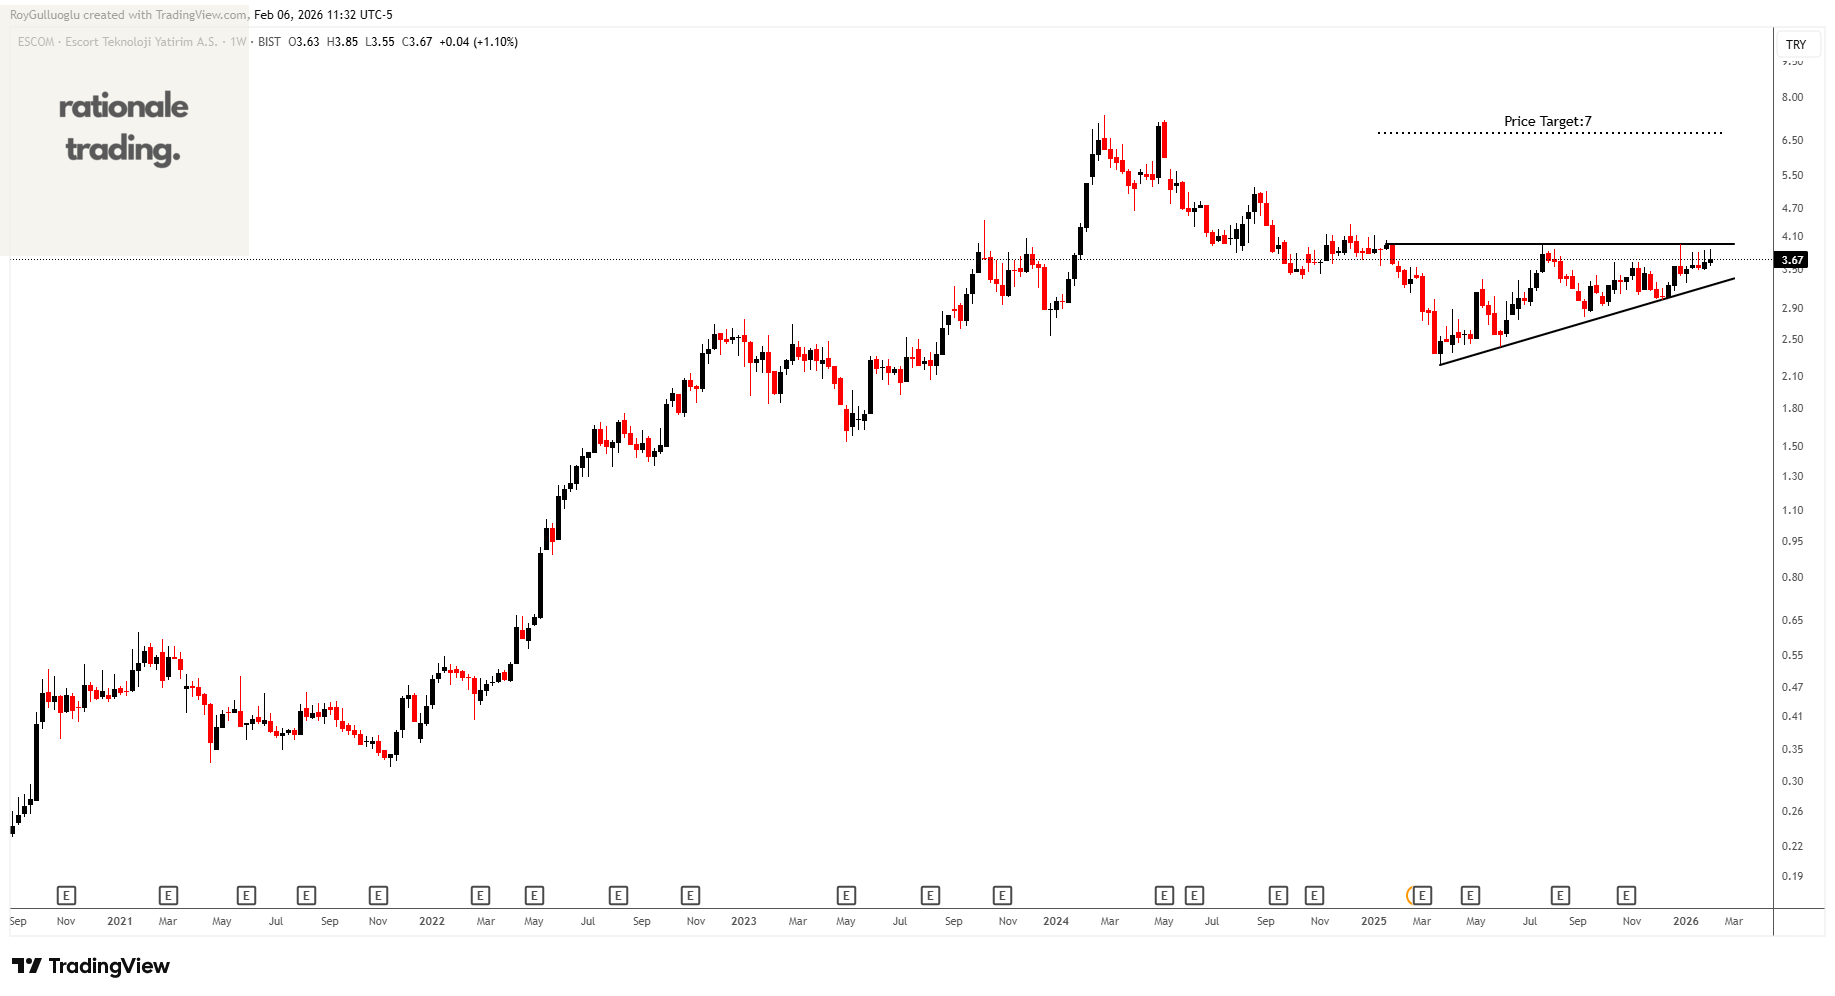
Escort is a Turkish computer manufacturer and Consumer electronics retail chain.
The above weekly chart formed an approximately 15-month-long ascending triangle chart pattern as a bearish reversal after an uptrend.
The horizontal boundary at 3.95 levels acts as a resistance within this pattern.
A daily close above 4.06 levels would validate the breakout from the 15-month-long ascending triangle chart pattern.
Based on this chart pattern, the potential price target is 7 levels.
Kuyas Yatirim A.S.-(KUYAS/BIST)-Long Idea
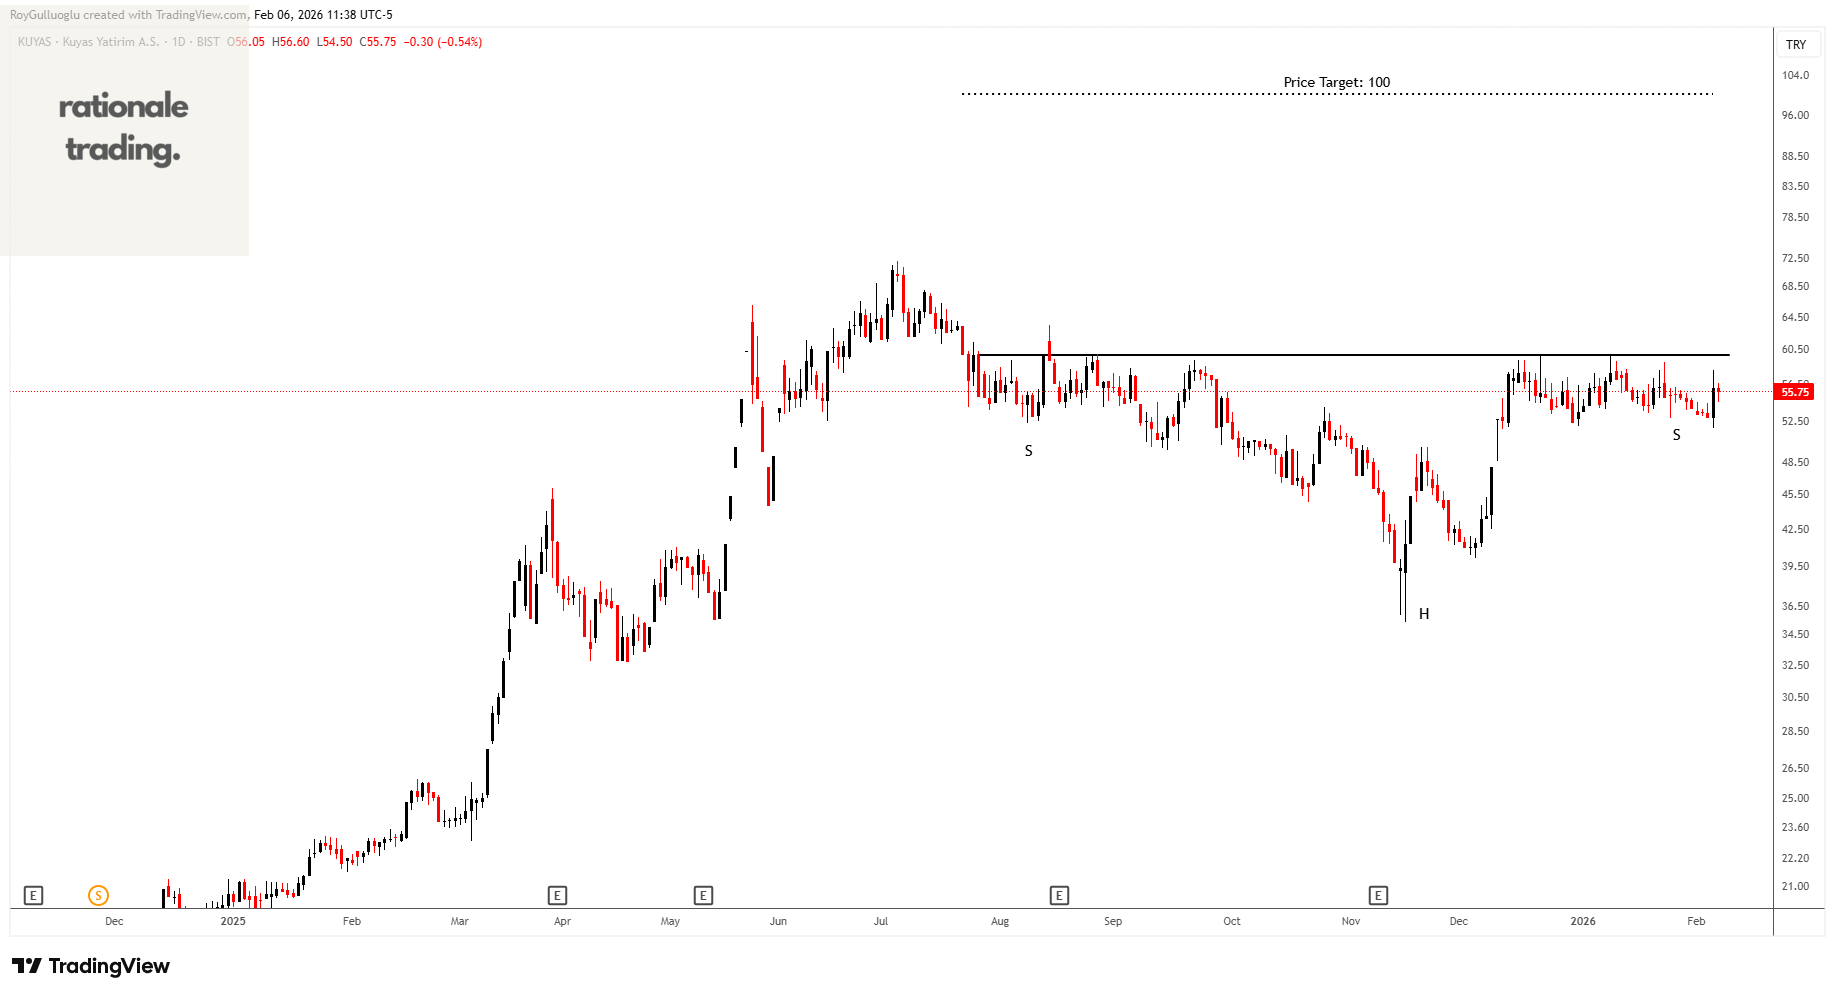
Kuyas Yatirim AS operates as a real estate investment trust.
The above daily chart formed an approximately 5-month-long H&S bottom chart pattern as a bullish reversal after a downtrend.
The horizontal boundary at 59.85 levels acts as a resistance within this pattern.
A daily close above 61.65 levels would validate the breakout from the 5-month-long H&S bottom chart pattern.
Based on this chart pattern, the potential price target is 100 levels.
Merhaba, alttaki analiz başlığında ERBOS yazıyor ama grafik ve içerik KUYAS hakkında.