CPI numbers:

The year-on-year and month-on-month headline inflation exceeded the initial forecasts, but there are positive indications of a slowdown in core inflation. The primary contributing factor to this trend is a 7% year-on-year increase in the shelter segment. If we exclude the shelter component, the index levels off at 2%, aligning with the Federal Reserve's target.
There are four popular measures of inflation which are also closely monitored by the FED,
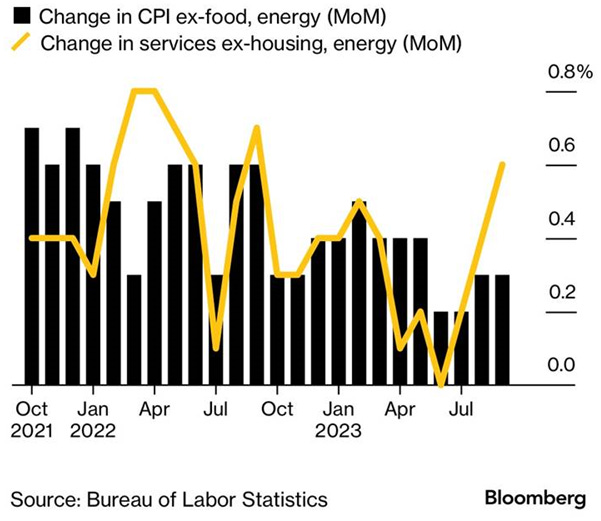
Core Inflation: Excludes food and energy. MoM data is crucial. It increased by only 0.3% as expected. A positive sign of easing inflation.
Super Core inflation: Core Service inflation - Shelter >Heavily led by wage inflation, as labor is a large share of costs for such businesses. It increased by 0.6% MoM but the YoY downtrend is on. This is the only section that could be considered problematic for inflation. A negative sign of easing inflation.
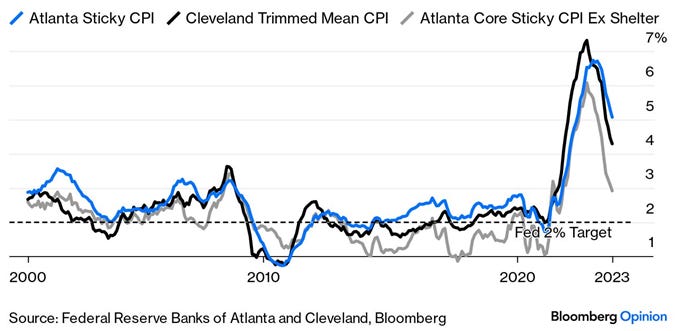
Cleveland FED`s Trimmed mean inflation: Excludes the biggest outliers in either direction and takes the average of the rest. It has dropped to 4.29% from 7% levels. The downward trend is on but still not enough. A positive sign of easing inflation.
The Atlanta FED`s sticky price CPI: Products whose price takes a long time to change and cannot easily be reduced. Eased to 5% levels. A positive sign of easing inflation

The impact of the `worse than expected` headline number on the S&P 500 was limited.

Summing up the pre-war global markets: Leading up to last Friday's nonfarm data release, there was a significant sell-off in bonds, causing yields to rise. This was driven by the anticipation of an additional rate hike and a relatively hawkish stance from Federal Reserve members. While the data initially appeared to support this narrative, factors such as conflicting surveys from households and businesses played a role. As a result, the S&P 500 index managed to close the week at around $4,300 levels, exceeding its 200-day Exponential Moving Average (EMA). In the context of the "higher for longer" discussion, my perspective is that the nonfarm data may be backing the concept of "longer" sustained high rates, but not necessarily "higher" rates.
In my opinion, I still anticipate an upward trend in bond yields. It's essential to note that aside from these geopolitical concerns, the primary driving force behind global market dynamics has been the movement in bond yields, particularly the significant shift in the long end of the yield curve, often referred to as a "bear steepening." This phenomenon suggests a return toward a more conventional yield curve, where long-term rates surpass short-term rates.
The anticipation was that the main influencers of market dynamics for the week would be geopolitical risks and CPI data. However, the spotlight unexpectedly shifted to the 30-year treasuries auction. Given the existing geopolitical concerns, strong demand was anticipated, but surprisingly, there were few buyers, leading to a significant increase in the 30-year yield to 4.87%, and as a result, the S&P 500 (SPX) retreated to around $4,320 levels on Thursday.

Hourly graph of US30Y and SPX
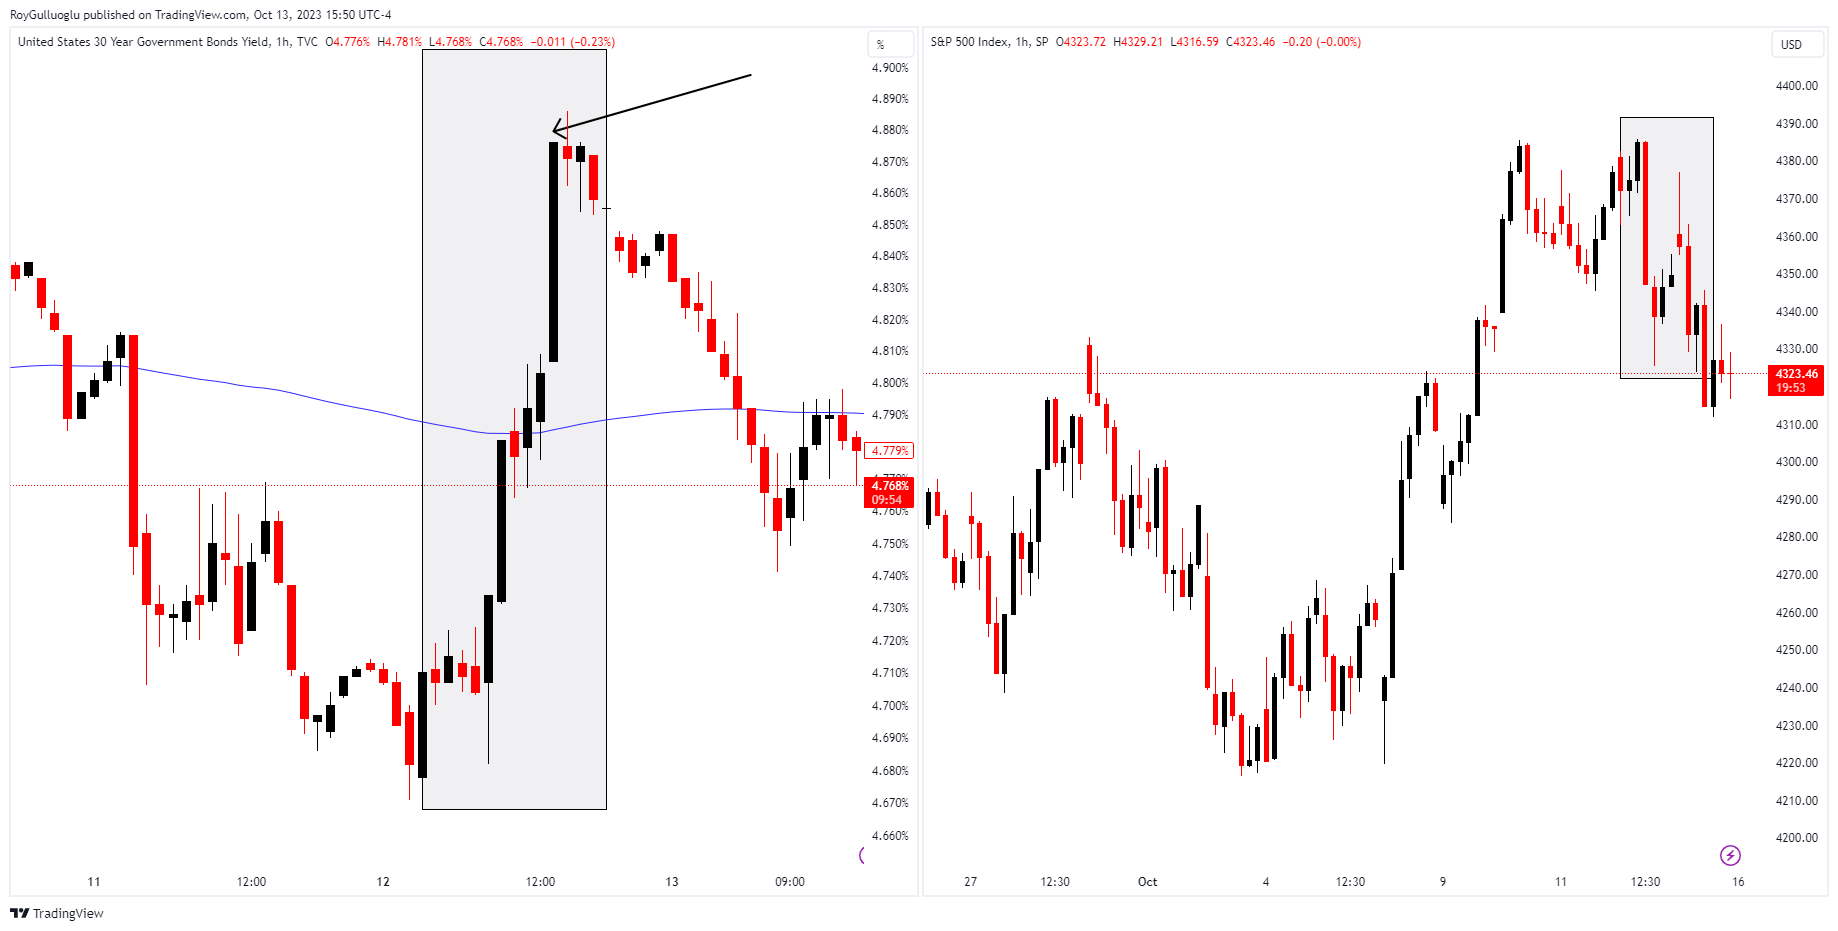
At the weekly market close, there was a surge in demand for bonds, gold, and oil as a precautionary measure against potential geopolitical risks over the weekend. The S&P 500 experienced a decline of approximately 0.5%. Cryptocurrencies, on the other hand, remained relatively stable. In summary, the market sentiment leaned toward a more RISK OFF!
Furthermore, Chinese import data suggests a rise in the importation of energy commodities, which is contributing to the upward momentum in oil prices.
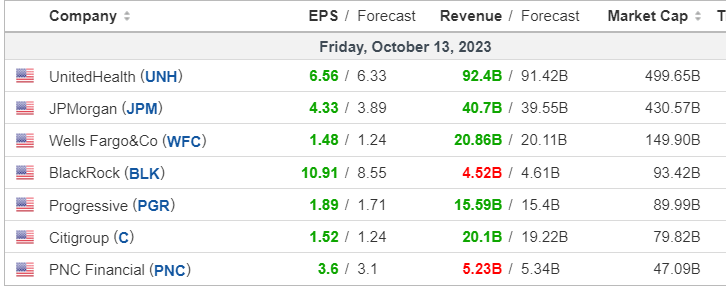
JPMorgan, Citigroup, and Wells Fargo all experienced premarket gains following better-than-expected earnings reports.