


Hello, rationale community! Here is the latest edition of the `MARKET UPDATE` report where I evaluate recent financial developments.
Today I will briefly go over the economic calendar. Then I will talk about the FED and its potential implications on the markets. I will also get into the details of ISM and Nonfarm data that we received last week.
ECONOMIC CALENDAR
TUESDAY(04/30/2024)
US Employment Cost Index QoQ Q1: Actual:1.2%, Forecast:1.0%, Previous:0.9%
US CB Consumer Confidence APR: Actual:97, Forecast:104, Previous:103.1
WEDNESDAY(05/01/2024)
US ISM Manufacturing PMI APR: Actual:49.2, Forecast:50, Previous:50.3
US ISM Manufacturing Prices APR: Actual:60.9, Forecast:55.5, Previous:55.8
US JOLTS Job Openings MAR: Actual:8.48M, Forecast:8.68M, Previous:8.81M
US Fed Interest Rate Decision: Actual:5.5%, Forecast:5.5%, Previous:5.5%
FRIDAY(05/03/2024)
US Average Hourly Earnings MoM APR: Actual:0.2%, Forecast:0.3%, Previous:0.3%
US Nonfarm Payroll APR: Actual:175K, Forecast:238K, Previous:315K
US Unemployment Rate APR: Actual:3.9%, Forecast:3.8%, Previous:3.8%
US ISM Service PMI APR: Actual:49.4, Forecast:52, Previous:51.4
US ISM Services Prices APR: Actual:59.2, Forecast:55, Previous:53.4
FED - Quantitative Tightening
Summing up Treasuries and other bonds, the Fed was allowing $95 billion of bonds (60bn USTs + 35bn MBS) to roll over its balance sheet each month.
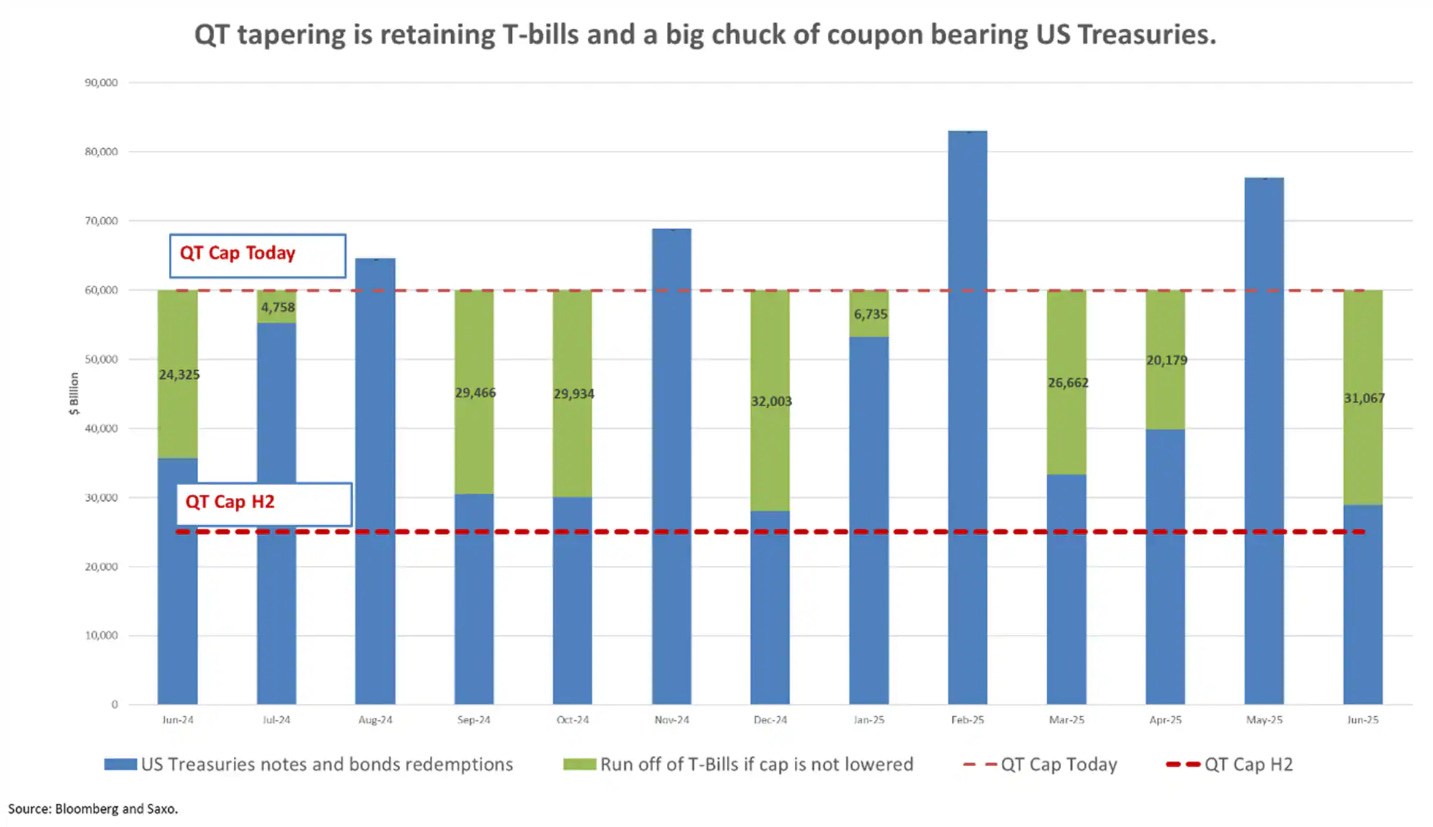
They decided to reduce the monthly QT cap to $25 billion, rather than $30 billion(market expectation) in Treasury Securities(USTs) starting in June is perceived as dovish by the market as it indicates FED`s desire to hold a larger portion of long term bonds. This would put pressure on the long-term yields, which moved recently higher with the signals of persistent inflation and robust labor market data. Here below, you see a great chart from Althea Spinozzi, the Head of Fixed Income Strategy at Saxo Bank.

With the previous cap, the Fed would have retained only $53 billion in coupon-bearing US Treasuries within a year. However, the new cap allows the Fed to retain approximately $300 billion in such Treasuries, about 25% more than with the $30 billion cap.
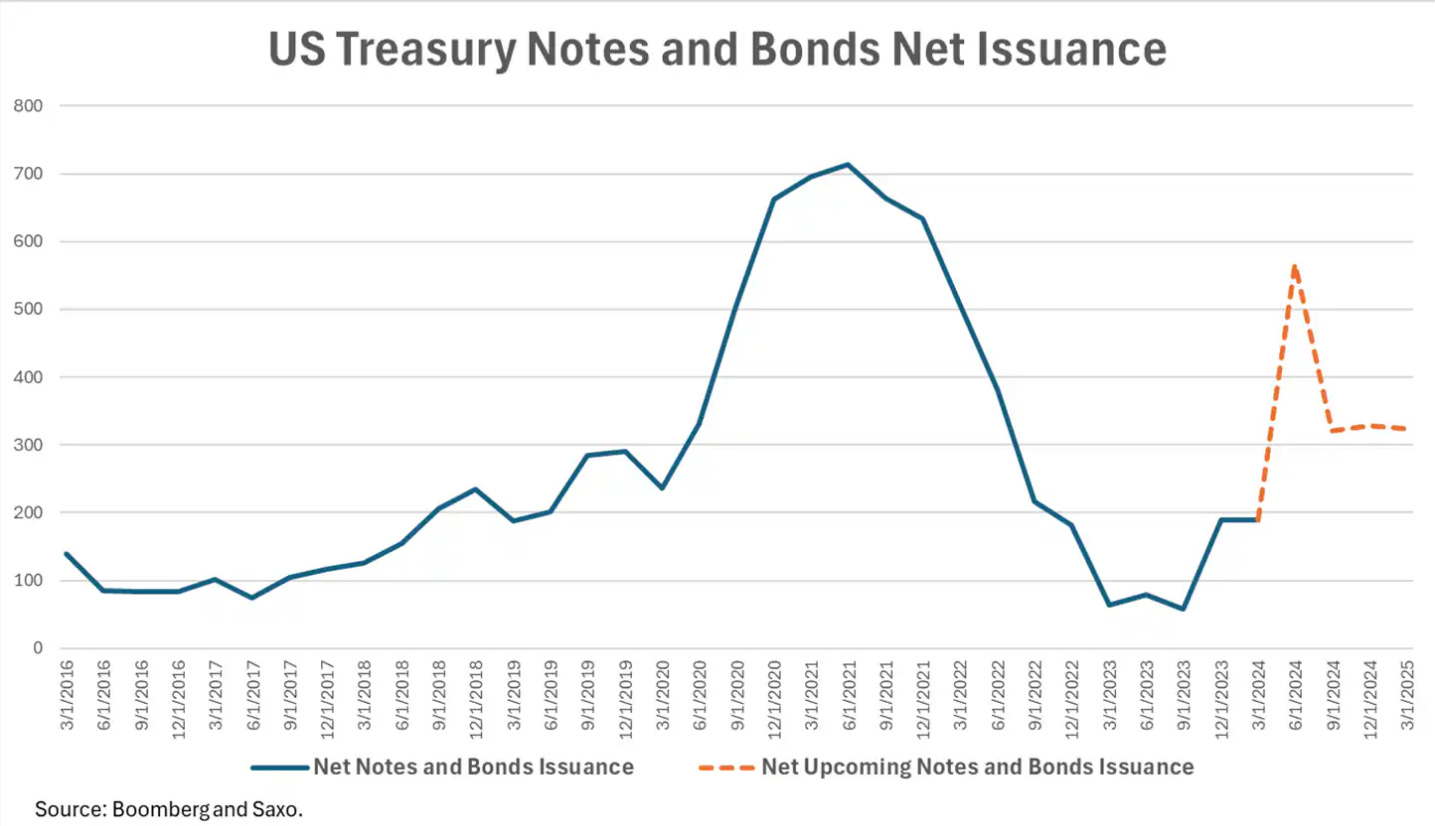
The reduction in QT is expected to put also pressure on the long end of the yield curve but the US Treasury is set to sell the highest volume of notes and bonds since 2022 this quarter, which interestingly coincides with the pre-election period.
What does this imply? Let`s go through another chart from Althea Spinozza, As you can see the QT reduction starts in June, just around that time the highest US bond issuance since 2022. Seems like the additional 5$ billion is also there to absorb the additional debt issuance :)

Since debt monetization potentially creates inflation, we might see the investors ask for a higher inflation premium. This would push the long end of the yield curve higher.
So overall, the reduction of QT might put pressure on the long end of the yield curve and lower the long-term yields in the short term but, with the increasing debt issuance-increase in the supply, we might see it to contribute to inflation which leads to higher long term yields in the longer term.
FED - Powell
Powell remarked that this year's data haven't instilled much confidence, particularly due to higher-than-expected inflation readings, suggesting that it may take longer than previously anticipated to gain substantial confidence.
He acknowledged the restrictive nature of current policies and noted a slowdown in sectors sensitive to interest rates. He highlighted labor market improvements nearing pre-pandemic levels, citing data series, such as the JOLTS report, indicating weaker demand for labor compared to pre-pandemic levels.
Notably, there are now 1.3 job openings per unemployed person, the lowest since 2021, potentially leading to a slowdown in consumer spending and subsequent decreases in both inflation and economic growth in 2024.
Powell's rejection of rate increases, alongside the dismissal of immediate rate cuts, implies a commitment to a "high for longer" approach, driven by sustained inflation and a robust job market. The timing of the first rate cut remains unclear.
Let`s see what the market priced before and after the FED:
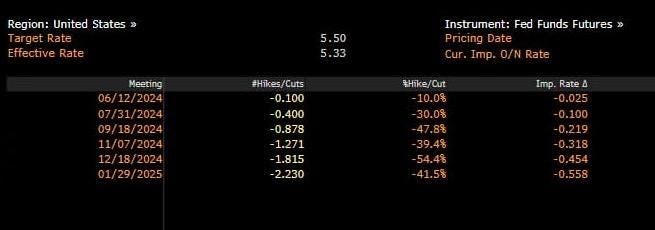
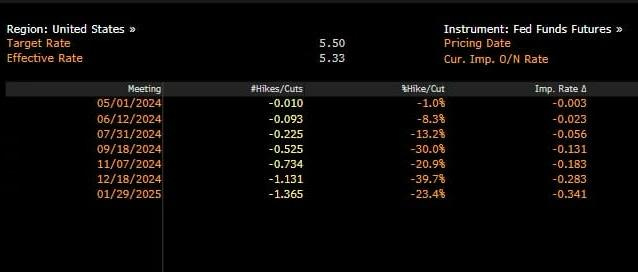
After the FED meeting, the probability of the second rate hike until the end of 2024 increased to 80%.
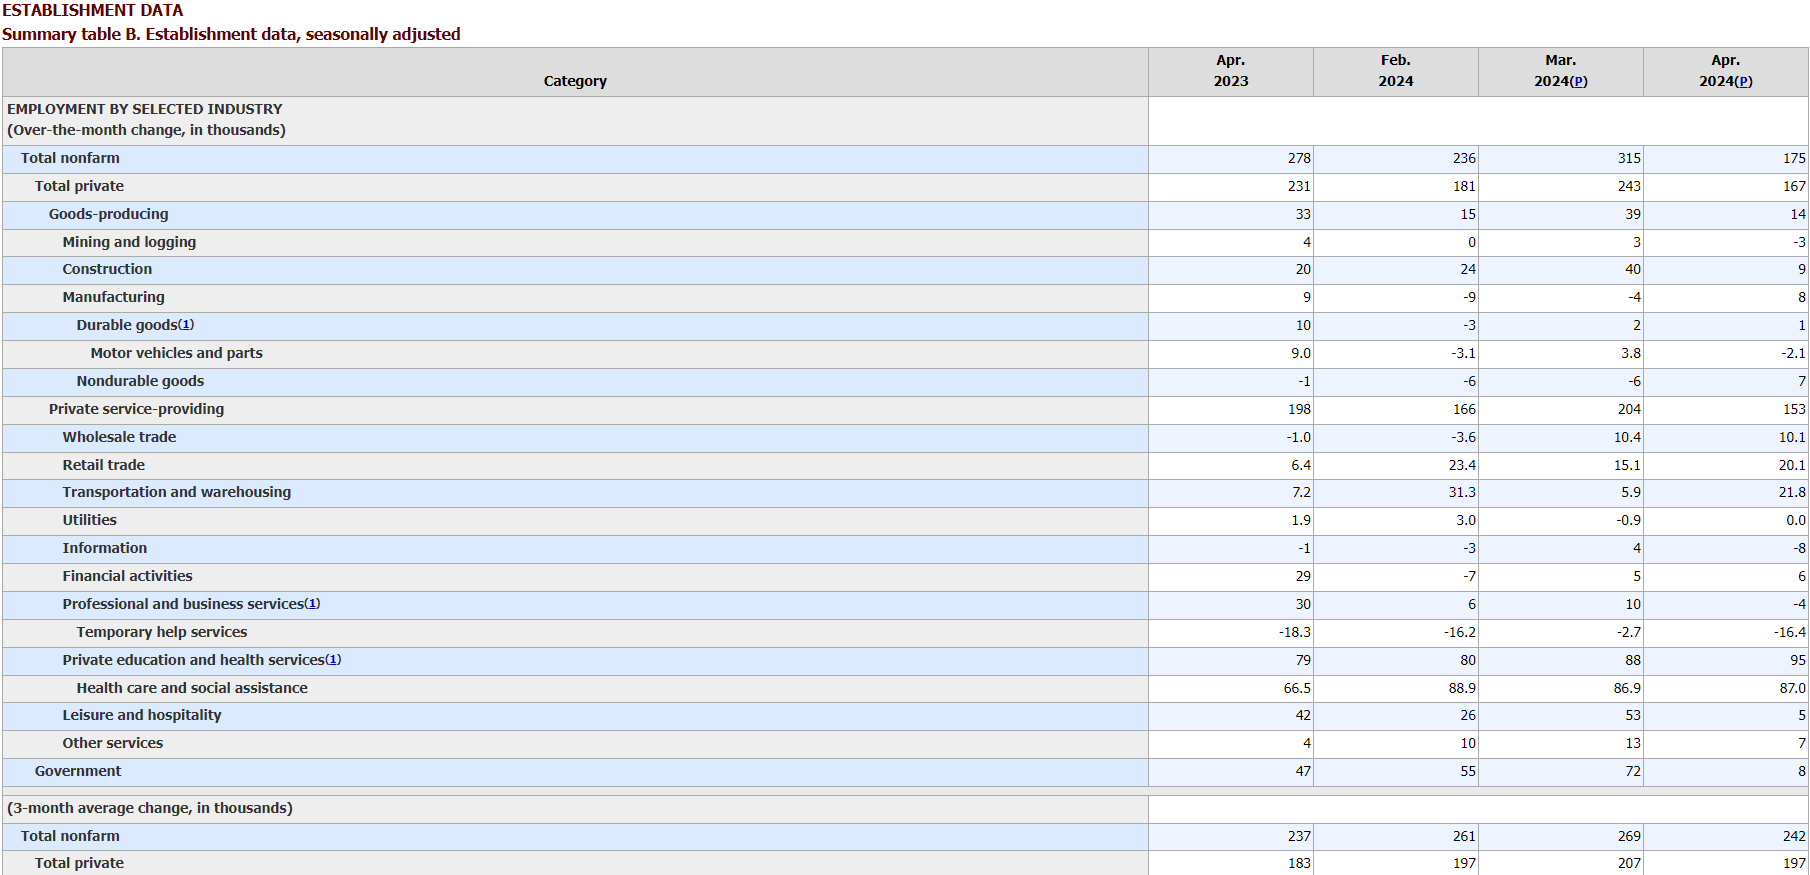
Nonfarm Payroll and Average Hourly Earnings
The market expectation was 240K but the nonfarm payroll came to 175K from the prior data of 303K.
The two-month revision is negative 22K. This downward revision trend aligns with a contracting economic environment.
Within the service segment, the leisure and hospitality part increased by only 5K which is low compared to the prior data. The temporary help services are negative 16K. If the economy is doing well or in a high-demand environment, you would need much more third-party help.
Also, you can see the downtrend in the 3-month average number at the bottom of the table.
Average hourly earnings YoY data decreased to 3.9% from 4.1%. The expectation was 4%—the lowest increase since June 2021 and the MoM increase came to 0.2% from 0.3%- the expectation was 0.3%. This is a positive sign regarding price-wage spiral risk.
ISM Services PMI
The forecast for the service PMI number was 52. The lower-than-expected 49.4 mark has been the second data in the contractionary region since December 2022(49).
I am giving more importance to the service side since it is the problematic part of the inflation. I am trying to trace any distortion on that side to confirm progress in the inflation.
The ISM service prices increased to 59.2 from 55.4, the forecast was 55. It is not a good sign in terms of inflation.
However, ISM service employment and ISM new orders surveys are signaling a contraction in the economy which is a good sign in terms of the impact of tightening the monetary policy but a bad sign for the economy.
OVERALL,
lower-than-expected nonfarm data
lower wage-based inflation risk
ISM data in the contraction region
Considering these factors, market anticipation has risen regarding the likelihood of earlier rate cuts and the number of rate cuts. From now on we need to find out if the soft landing scenario will start to gain its power back.
Accordingly, I still believe that positioning in precious metals and quality stocks should be the base scenario in market corrections. The risky side especially for the US equities is the `soft landing` part. The continuation of disinflation should be achieved without distorting the growth of the economy, thus the companies sustain their profitability. So the level of aggressiveness on US equities should be calibrated cautiously.
Considering the p/e differentials, the European or developing market equities offer more room compared to their US counterparties.
So summing up,
The uncertainty,
Potential geopolitical tensions,
An upcoming rate cut expectations that could potentially elevate with the continuation of the disinflation,
make the precious metal attractive to me. I would see any correction as a buying opportunity.
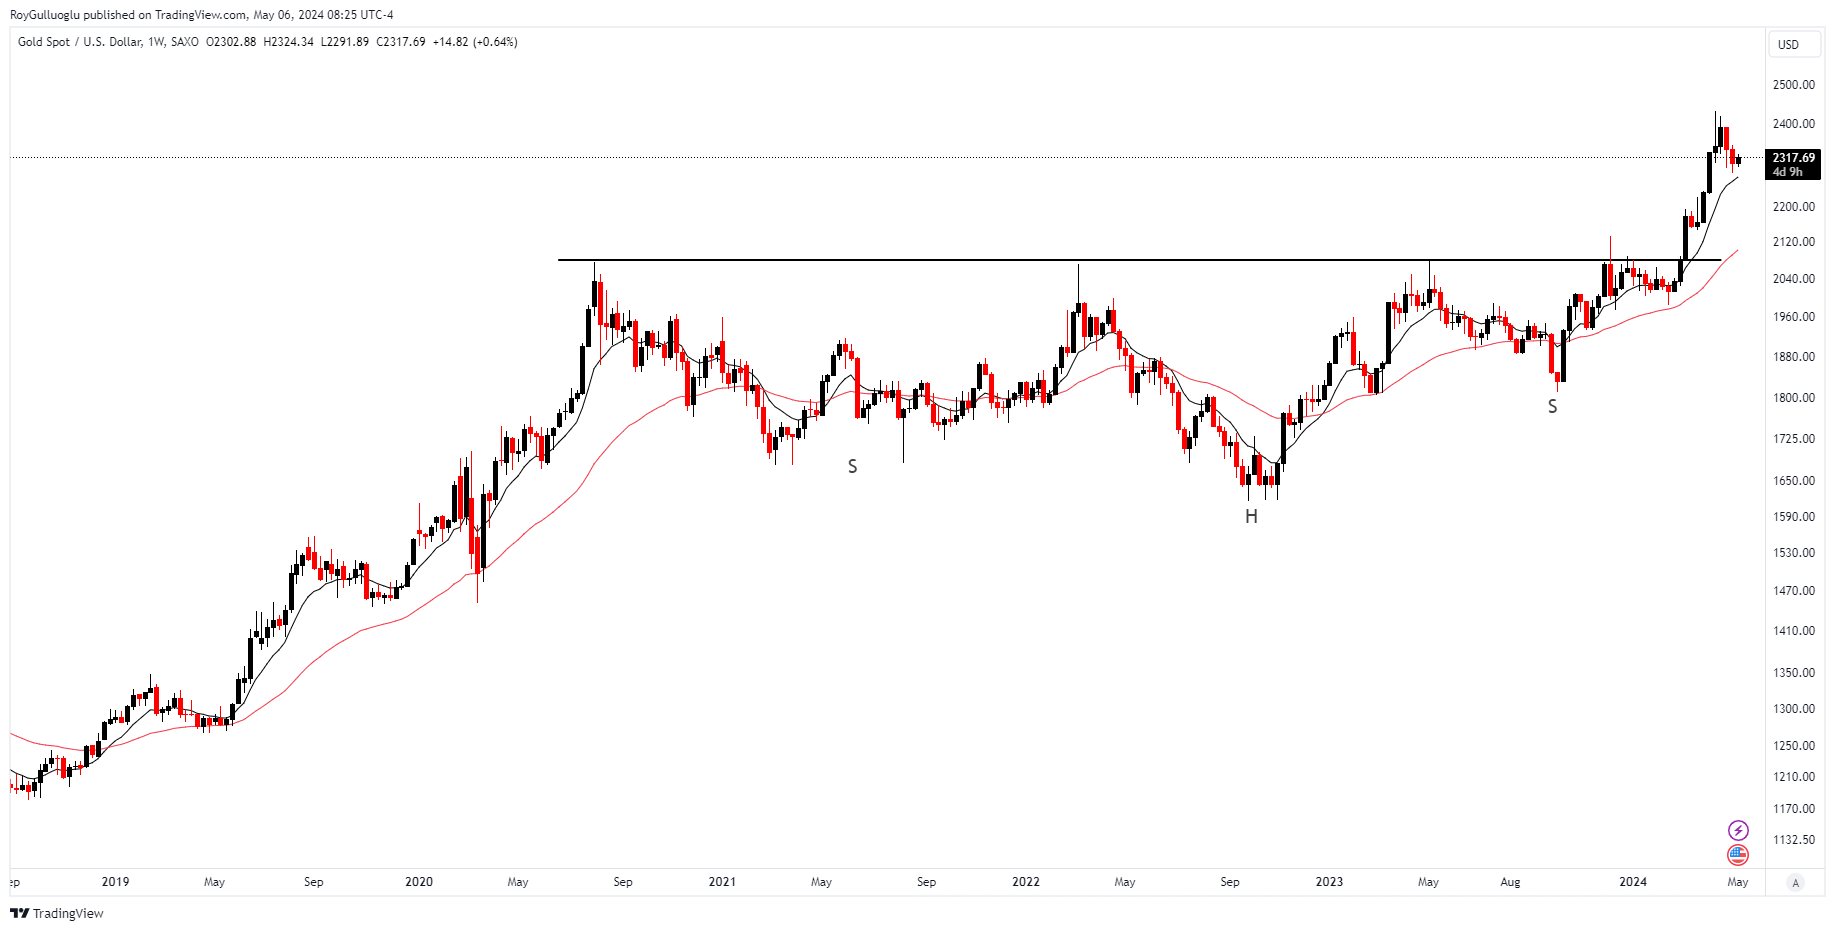
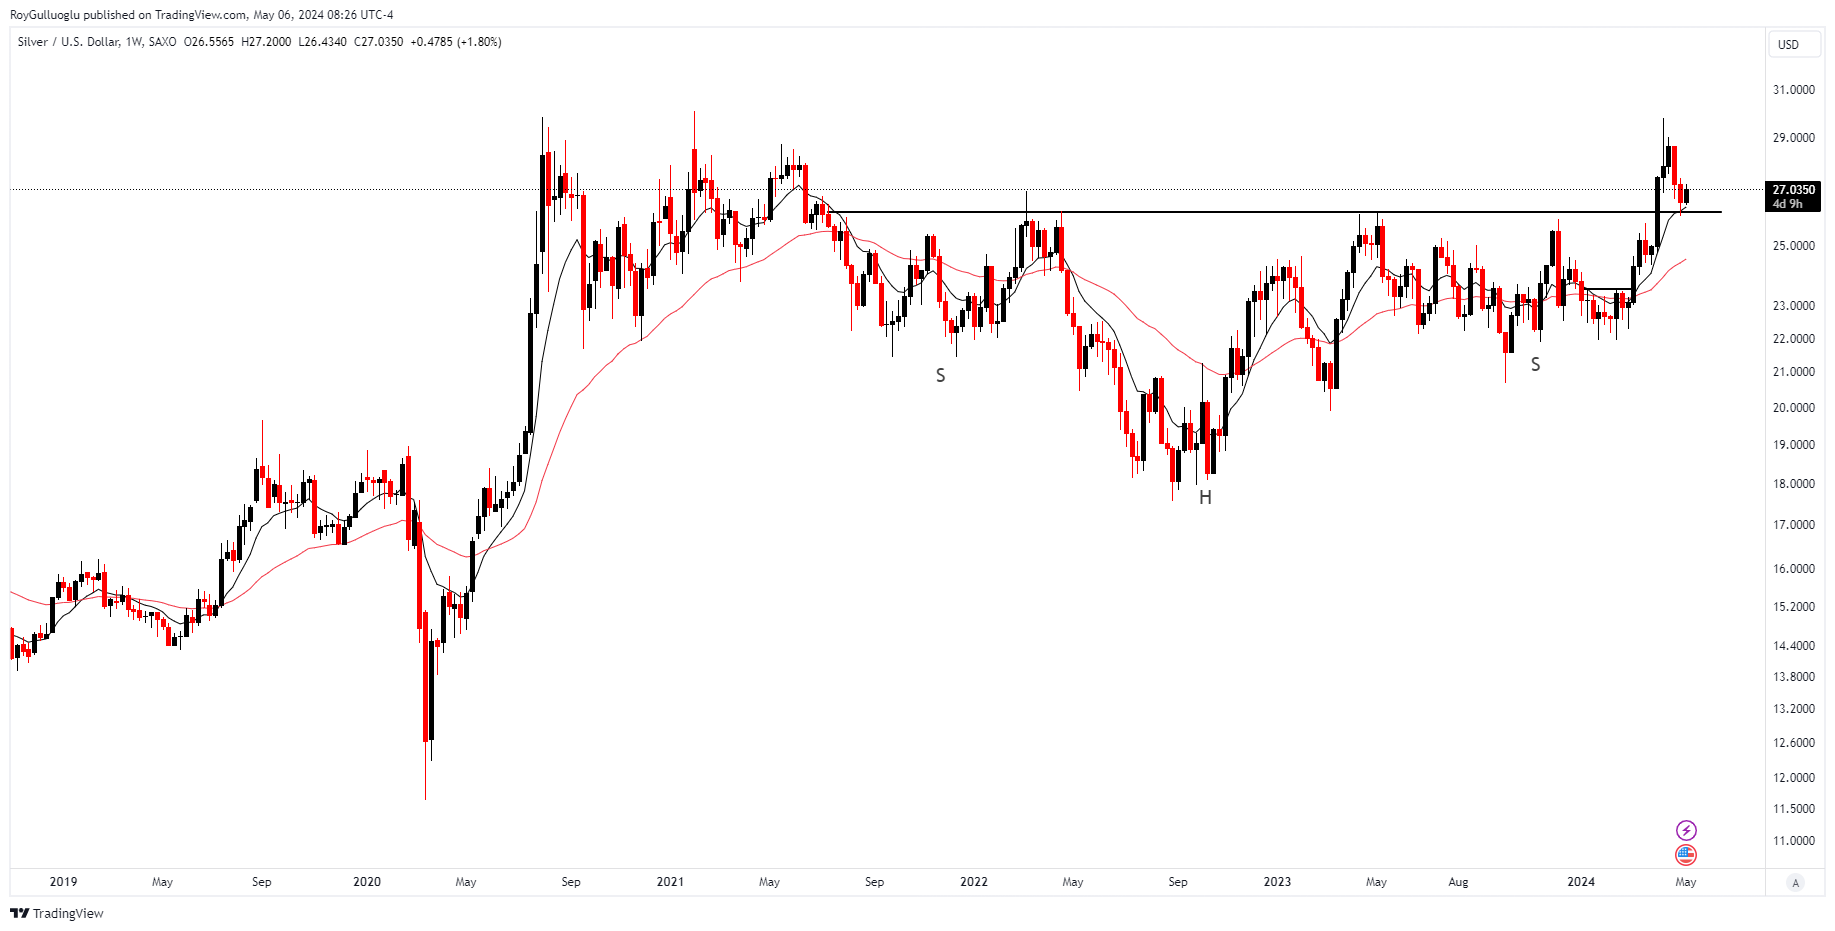
From a technical standpoint, both the weekly charts for gold and silver have broken out from extended bases and retraced back to the breakout points. In the case of silver, the former resistance has now become a tested support level, allowing prices to continue their upward trajectory. Meanwhile, the long-term moving averages, specifically the 10-week and 40-week ones, are supporting the upward momentum in gold. Given the current macroeconomic landscape, any corrections observed in precious metals could potentially be viewed as favorable opportunities for investment with stop loss below the old resistance levels.
Dear Rationale member, your input is highly appreciated. Your valuable feedback will help improve our services to better meet your needs. Could you spare a moment to share your thoughts in a quick ONE QUESTION survey from the button below?