


GLOBAL MARKETS OVERVIEW
To have a wider perspective, let’s start by remembering what has come through from the end of 2021 until now. Risky assets experienced their steepest decline in history in the first 6 months of 2022. This was due to the "sticky inflation" that we observed in October 2021 inflation data that we received in November 2021. However, the market trend reversed in 2023 with the expectation of central banks had reached their peak interest rates and the ceiling interest rate is almost there.
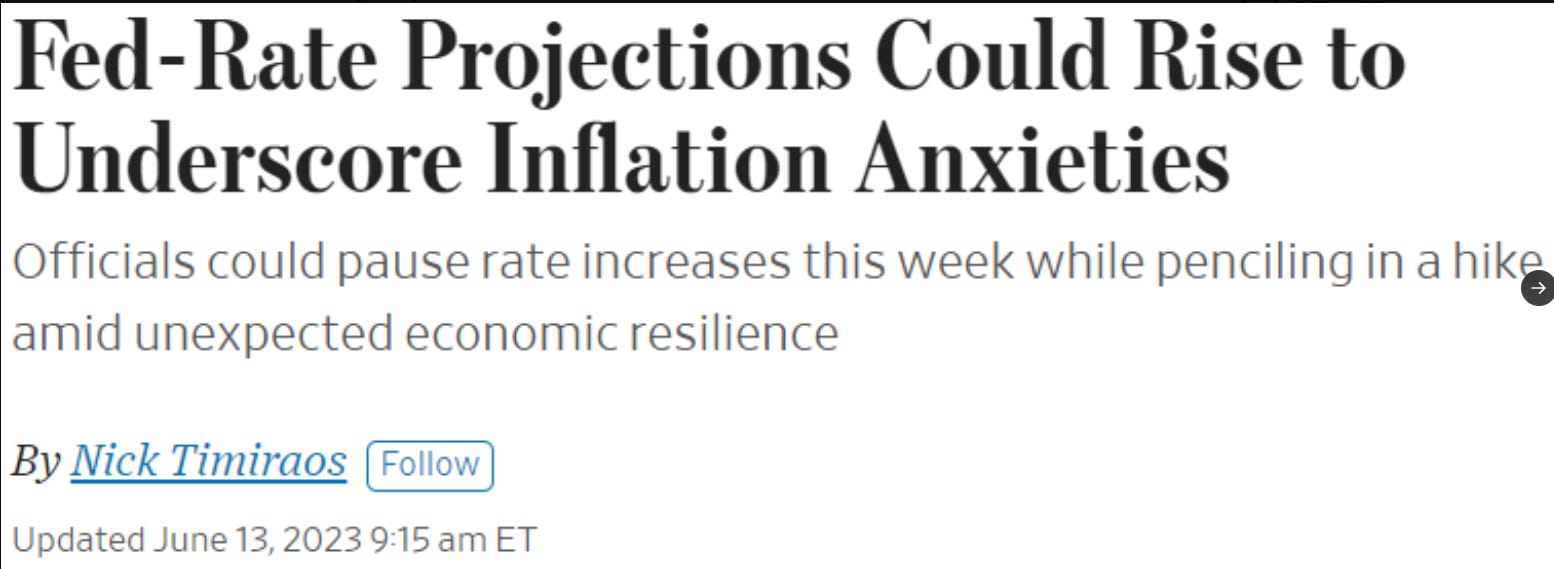
If central banks have reached the peak of interest rate hikes, it is unlikely that we will see investors selling off risky assets. However, if there are two more rate hikes as expected, we may see some profit-taking. We may get a better idea of what to expect from the FED as we will be receiving the FED minutes this week.
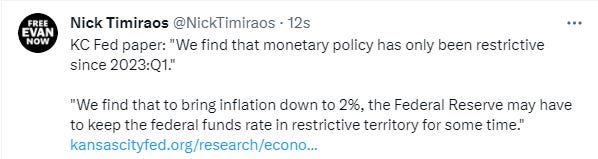
The Kansas FED’s research also supports the hawkish tone that they have had since the last meeting,

To Reach the Fed’s Inflation Target, Interest Rates May Have to Remain Restrictive for Some Time

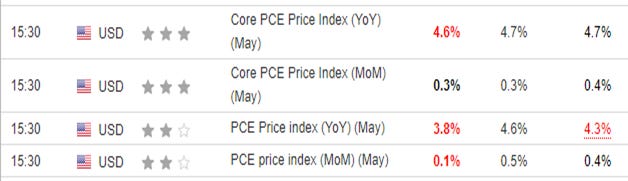
The PCE data that we received last week does not support a sell-off in risky assets. As you can see in the below table the slowdown in the rate of increase in the core inflation is positive.

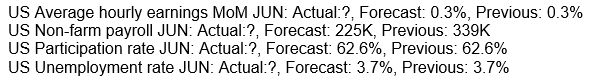
This week the market will be monitoring the non-farm payroll data apart from the FED minutes. I will be paying the most attention to the “average hourly earnings” data given the FED’s emphasis on wage-based inflation risks.

Amid the volatility sourced by data flows, I would like to mention that the tightening path in the UK and Europe seems longer than in the US considering both data and rhetoric from the relevant central bank members. That is why a technical bullish signal for GBP or EUR against a USD might be considered as an opportunity to follow the trend.

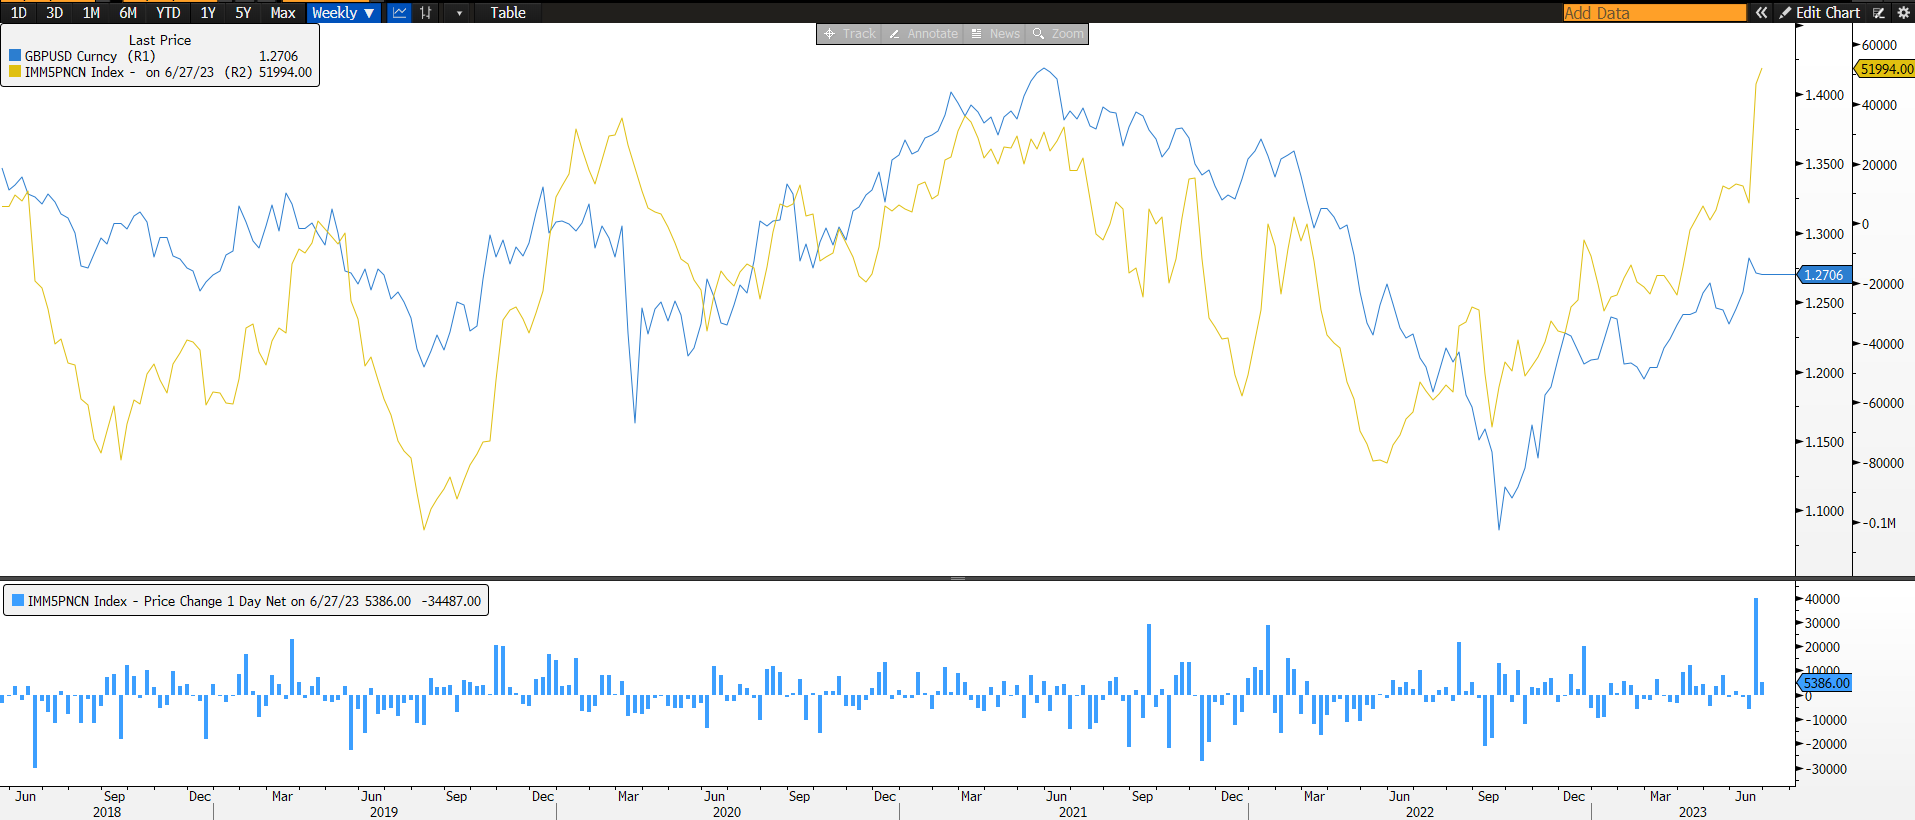
Net non-commercial future positioning which is known as CFTC COT(commitment of traders) data also supports the GBP long positioning. The yellow line below shows the net non-commercial future positioning and the blue line is GBPUSD itself. You can track the way both graphs interact. You can also track COT positions from the blue bars below.
I hope you have a happy and productive week!