

TRADE IDEAS
15/04/2023

FUTURES
S&P 500 E-mini Futures - Long Idea
Story
US Inflation data was released on Wednesday. While core inflation data came in at the expected monthly and annual levels, headline inflation data was below expectations.
With the better-than-expected headline data risk-on sentiment kicked in but the details of the core inflation indicated that the inflation risks are still on the table mainly caused by shelter and transportation services. Especially shelter section is an indication of the stickiness of the inflation. Monthly shelter data suggested that the increasing trend is over but YoY data came to around 8% which is a clear sign of the existing risks of inflation.
In addition to that the optimism came from the headline inflation sourced by the declining energy prices but considering the future impact of the OPEC+ decision of cutting supply on energy prices, that could be an early celebration :)
Also, I expect the continuing re-opening of China which will cause an energy demand that will push prices higher.
So FED fund rates also moved down to 63% levels after the data, then the current probability of a rate hike is 77%. In line with initial optimism then the realization of the upcoming FED hike is still there.
To wrap up I keep my thoughts of a short-term limited decline in risky assets in my pocket that could be followed by a medium-term relatively permanent positive price action.
Technical Analysis
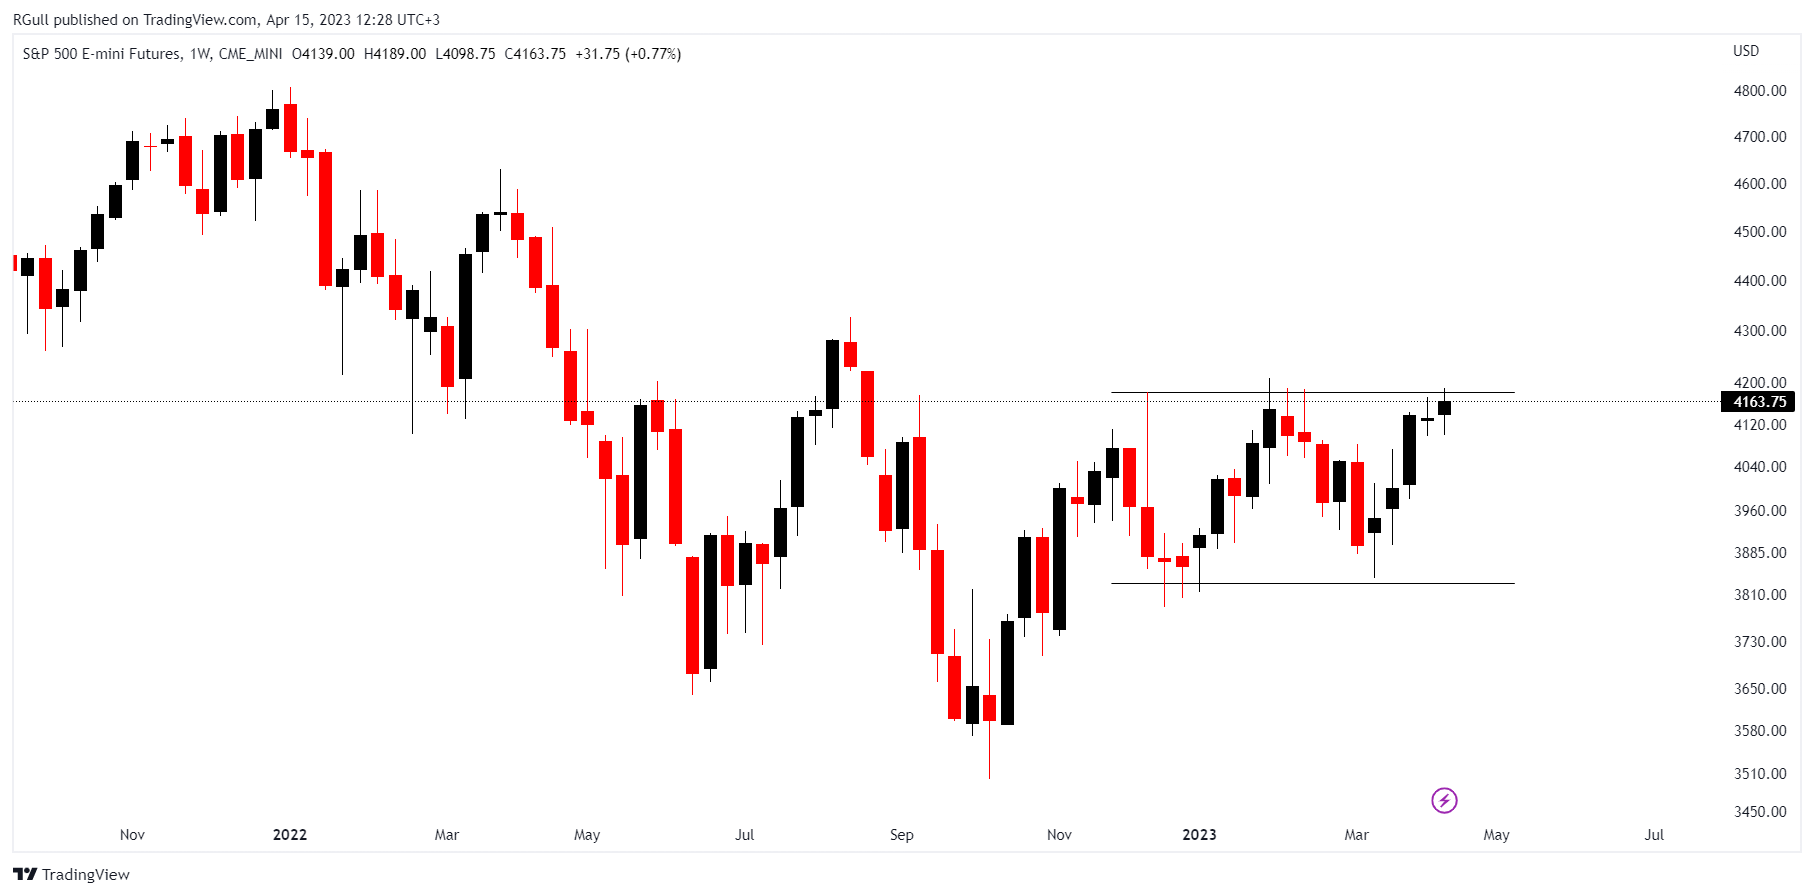
As you can see in the above daily graph, an approximately 4-month-long Rectangle Chart Pattern formation is established with the 4180 resistance level.
The technical view is in line with the macroeconomic story above. There might be a breakout of this graph but after a limited retracement.
50 EMA > 200 EMA, Price> 200 EMA → Trending.
The current price is above 25% of 52 weeks low.
Game Plan
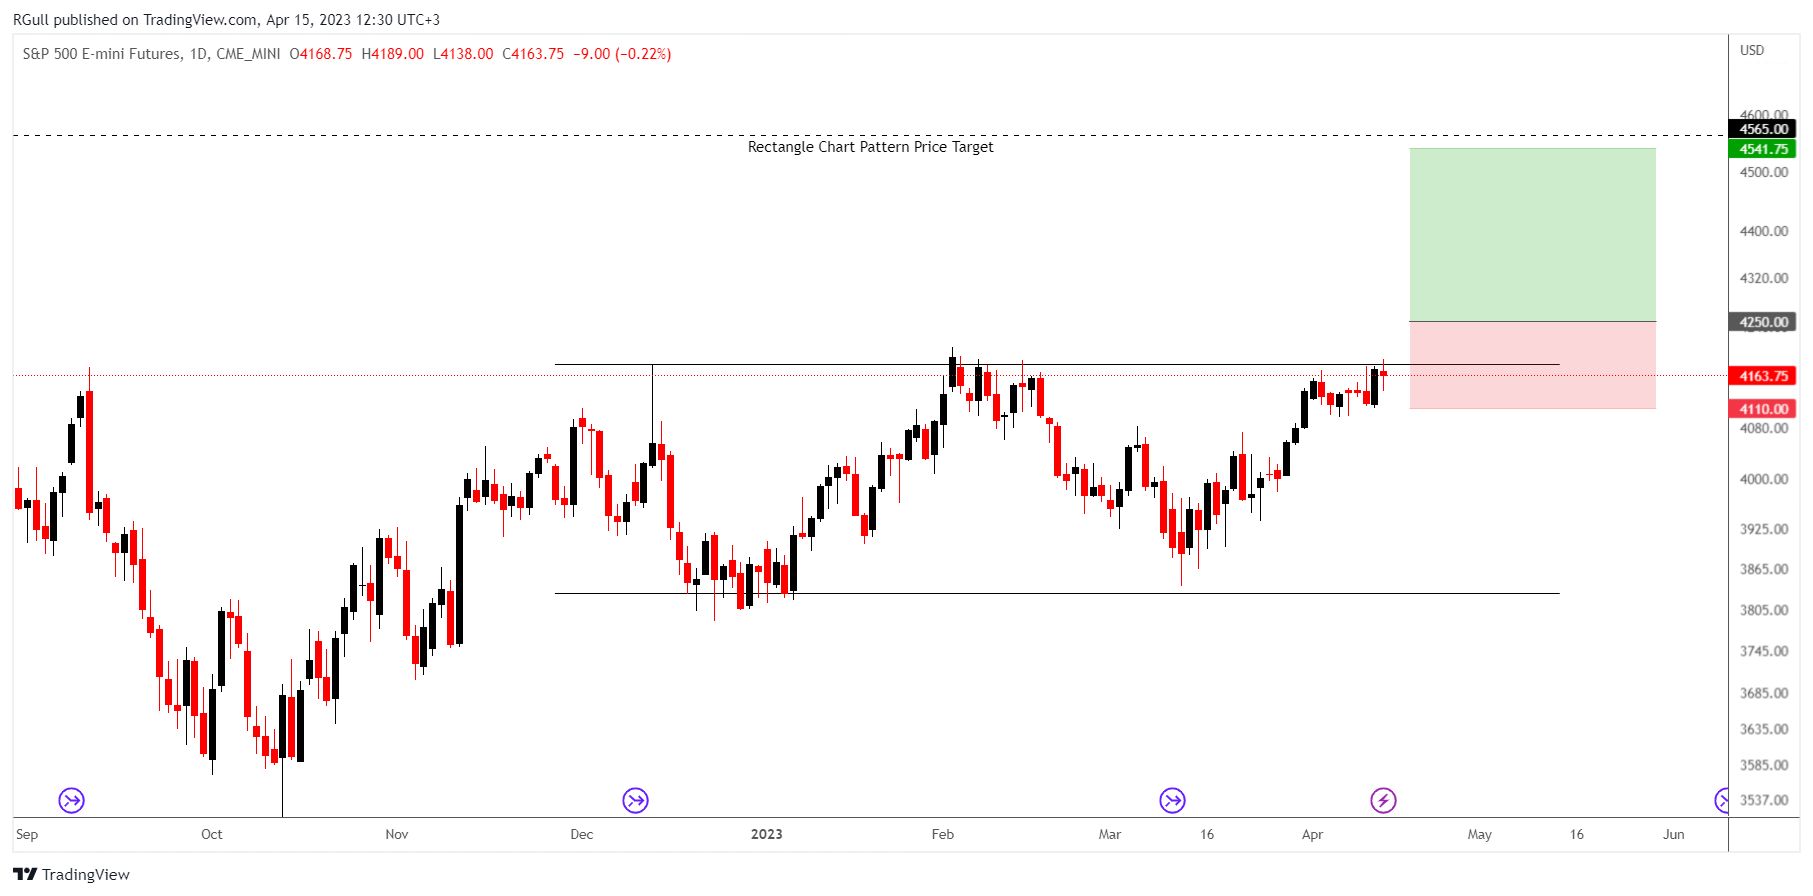
I prefer to structure the game plan on the above daily graph where the 4180 level acts as a resistance.
Entry: 4250, Stop Loss Level: 4110, Take Profit Level: 4540, RR= 1 / 2 or more.
Since this is an index future instrument. Apart from trading it directly, you can also benefit as a market indicator. Where does the market go? How is the risk sentiment? How does the market perceive the policymakers’ actions? and so on…
I’d rather risk 1% of my portfolio for this position.
US EQUITIES
VRTX(Vertex Pharmaceuticals incorporated) - Long Idea
Story
Vertex Pharmaceuticals Inc operates in the field of researching, designing, producing, and promoting medications composed of small molecules to treat severe illnesses within specific markets.
According to GICS, the company is classified under the healthcare sector which generally performs better in early recession times.
Considering FED’s expectation of a “light recession” for the end of the year in the meeting minutes, Q2 or Q3 quarters could be counted as an early recession time interval.
Regardless of the current situation of the general risky assets, the stock is traded at almost its all-time highs. This is an essential sign of strength.
Technical Analysis
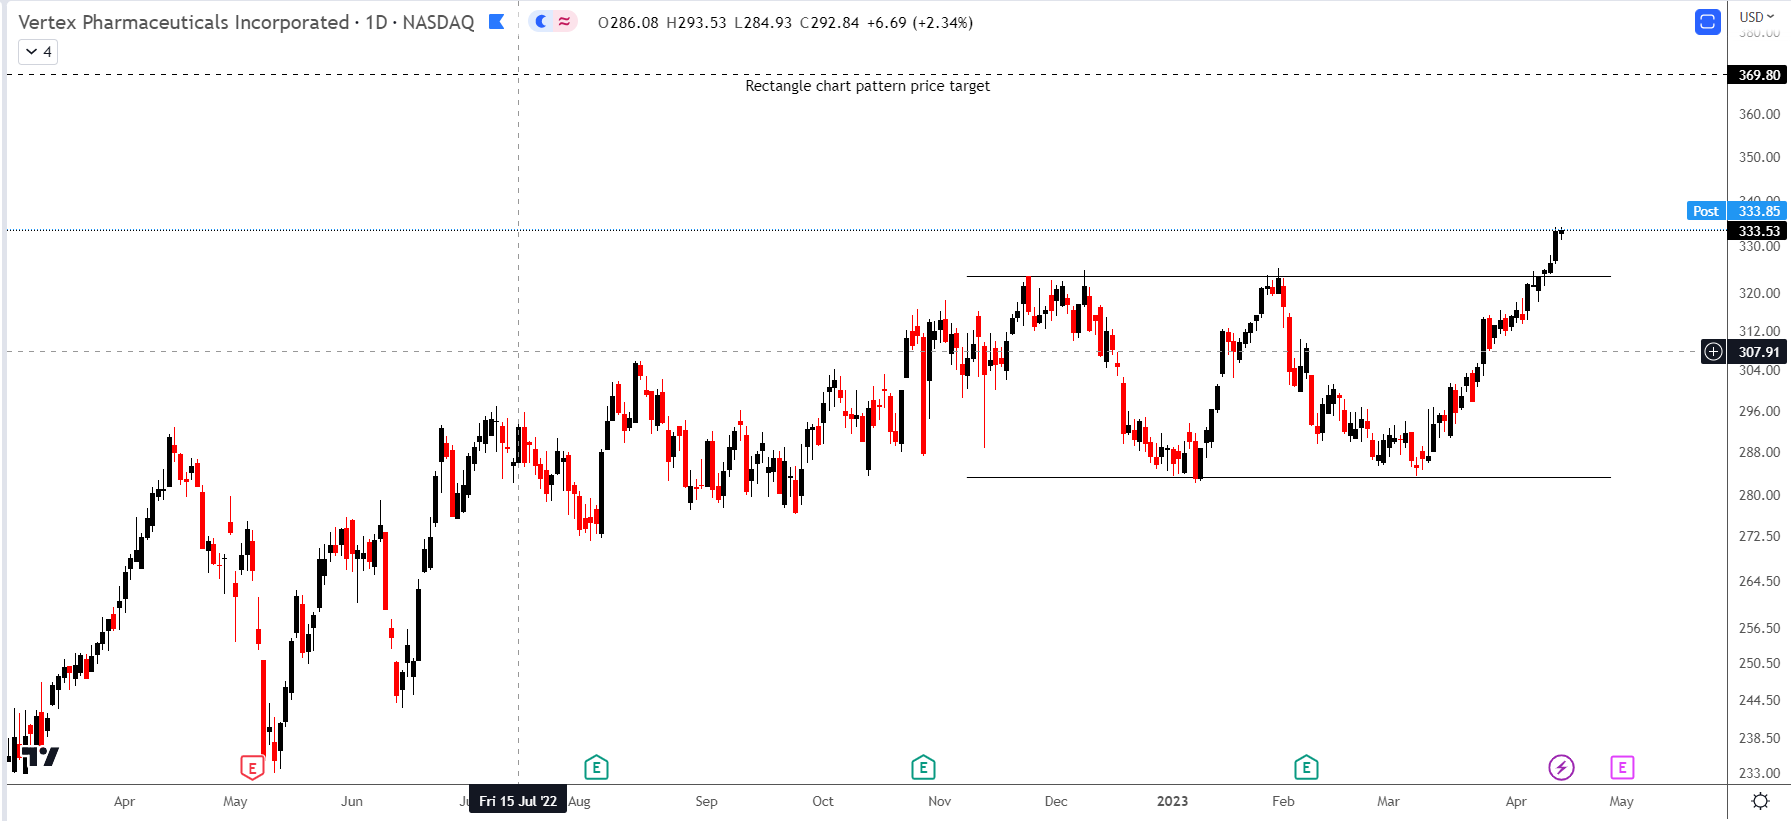
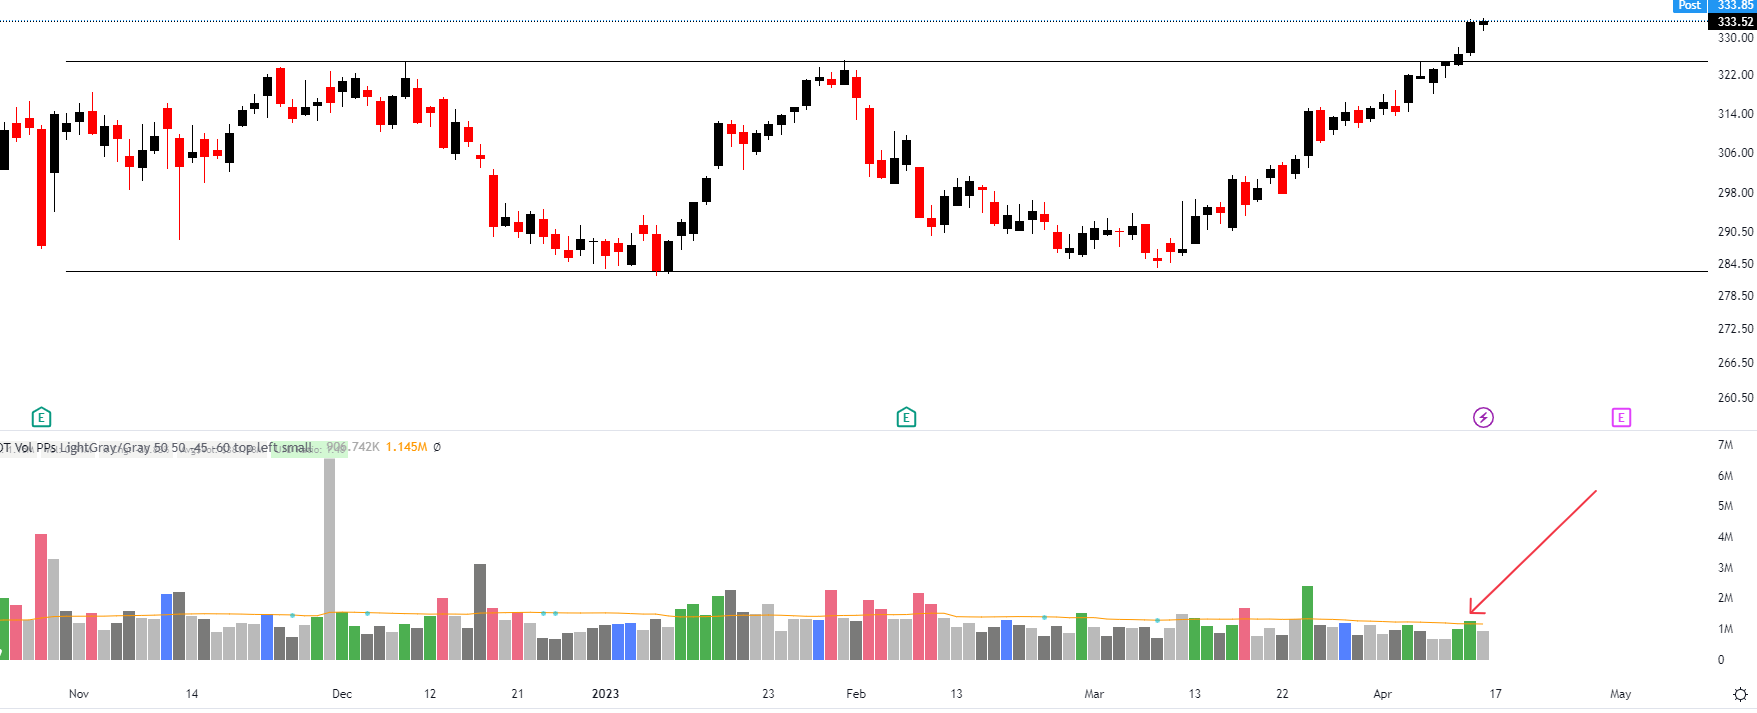
As you can see in the above daily graph, an approximately 3-month-long Rectangle Chart Pattern formation is established with the 325 resistance level.
The target of a 3-month-long Rectangle Chart Pattern is 368 levels.
Also, the price is trading above its 200-day EMA as a trend filter.
The breakout bar came with a 10-day pocket pivot which is known as a positive volume bigger than the max negative volume within the last 10 days. Tracking it is very crucial to get an insight into institutional investors’ interests.
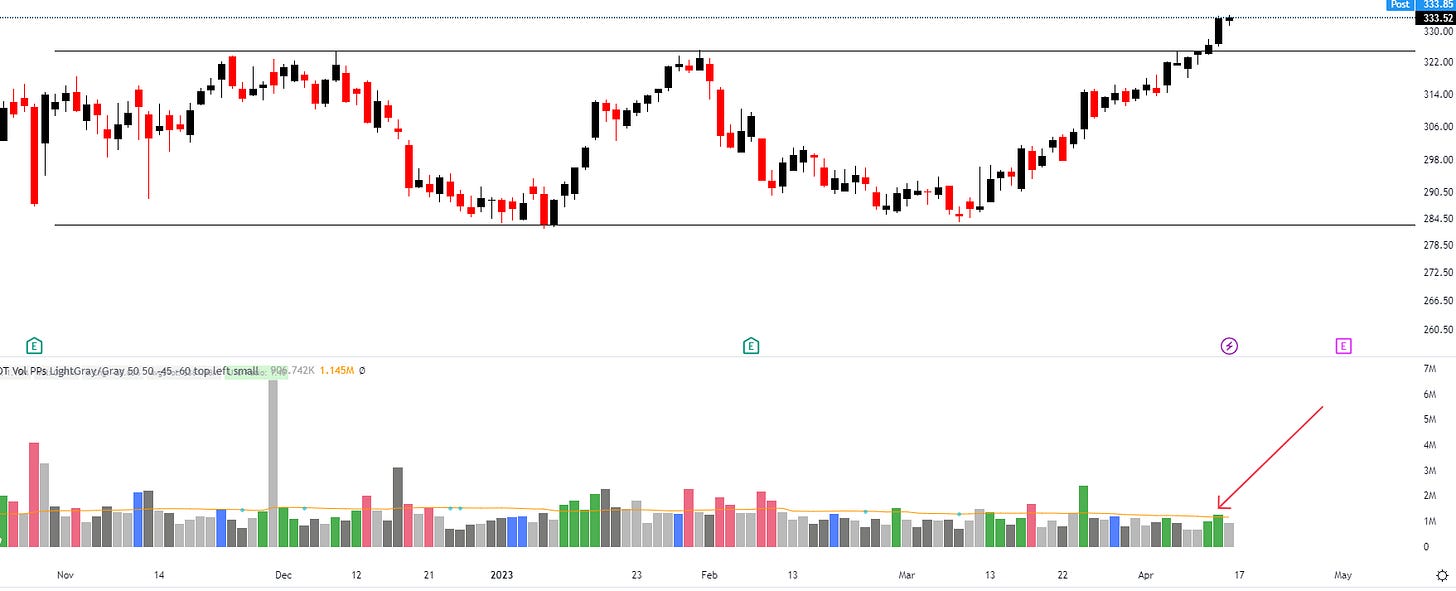
Breakout day volume with a green bar that indicates a 10-day pocket pivot
Game Plan
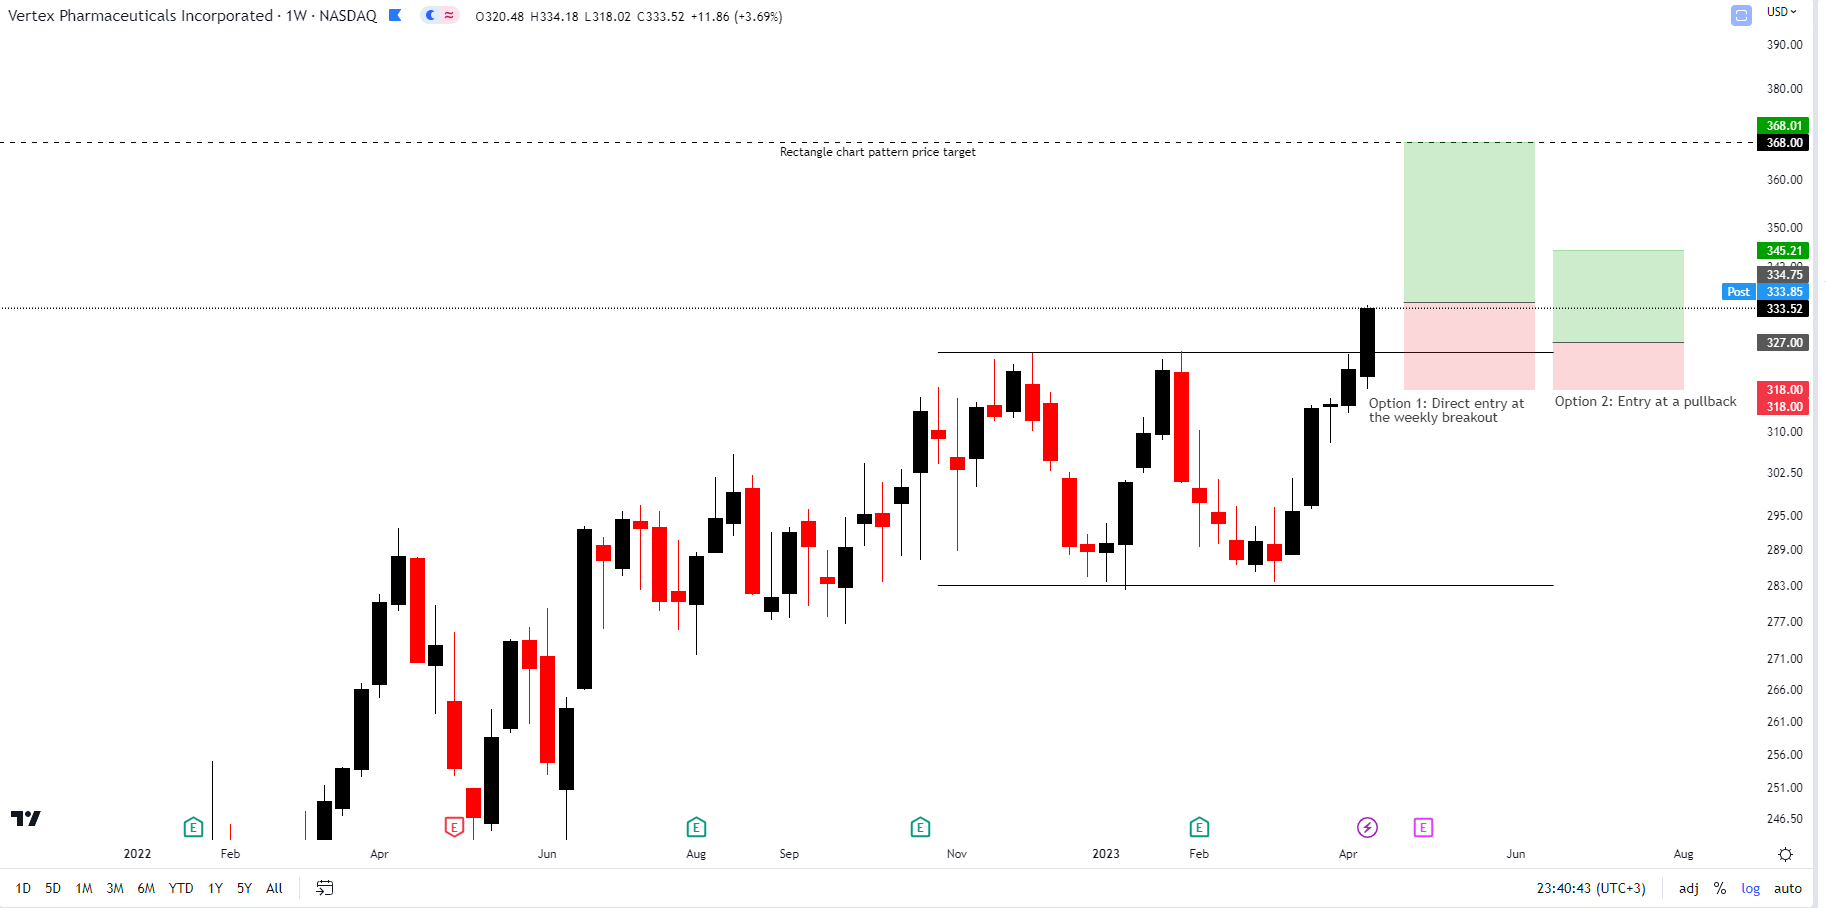
I prefer to structure the game plan on the above weekly graph where the 325 level acts as a resistance.
Here I see two options for a trade entry,
Option 1: Direct entry at the weekly breakout → Entry: Active price, Stop Loss Level: 318, Take Profit Level: 368, RR= 1 / 2
Option 2: Entry at a pullback → Entry: 327, Stop Loss Level: 318, Take Profit Level: 345 or Trailing Stop, RR= 1 / 2 or more
The stop loss level is determined according to the low of the weekly breakout candle before the breakout.
I’d rather risk 1% of my portfolio for this position.
IDEXX(IDEXX Laboratories) - Long Idea
Story
IDEXX Laboratories Inc is involved in the creation, production, and dissemination of various products and services aimed at serving the companion animal veterinary, livestock and poultry, dairy, and water testing sectors.
According to GICS, the company is classified under the healthcare sector which generally performs better in early recession times.
Seeing three-quarters of EPS acceleration on a YoY basis is an important support on the fundamental side. The numbers are not that solid but at least the trend seems upward.
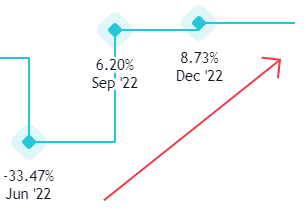
EPS diluted one-year growth % The stock outperformed the market and the competitors on Friday’s close.

Technical Analysis
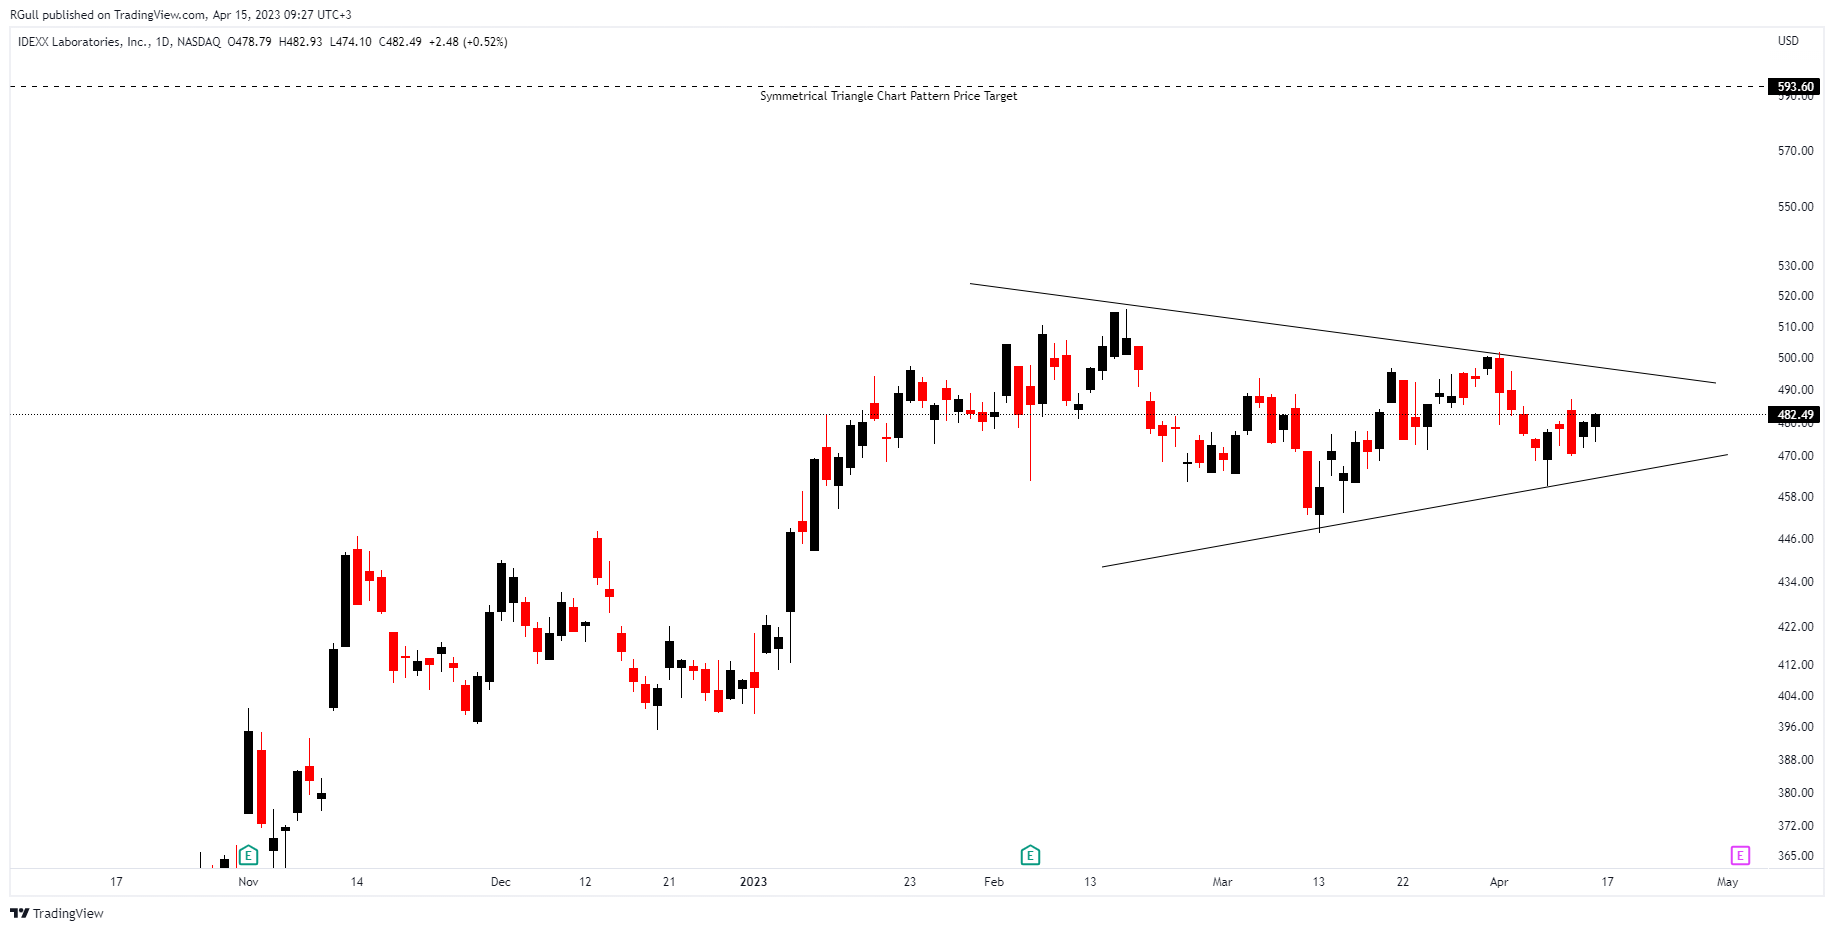
As you can see in the above daily graph, an approximately 2-month-long Symmetrical Triangle Chart Pattern formation is established.
The target of a 2-month-long Symmetrical Triangle Chart Pattern is 593.6 level.
The price is trading above its 200-day EMA as a trend filter. It has been trading above its 200-day EMA at least for a month, which is another indication of strength.
The current stock price is 25% above the 52 weeks low.
Currently, the 50-day EMA acts as a resistance.
Game Plan
I prefer to structure the game plan on the above daily graph.
A possible breakout might cause price action to the price target of the Symmetrical Triangle Chart Pattern.
Entry level: I would like to see a daily close of 3% above the chart pattern, Stop Loss Level: The low of the breakout bar, Take Profit Level: Any level that makes this trade minimum 1/2 risk/reward ratio, RR= 1/2
I’d rather risk 1% of my portfolio for this position.
KDNY(Chinook Therapeutics, Inc) - Short Idea
Story
Chinook Therapeutics is a biotech firm that is presently at the clinical stage and is dedicated to the development of precision medicines that target kidney diseases. As a global issue, kidney diseases have been growing in severity, and the unavailability of effective remedies has resulted in dialysis, transplantation, and high healthcare costs.
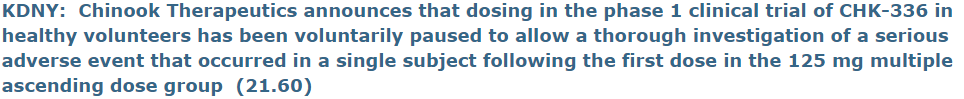
The below news might be effective on the share price decline.

But other than that the stock’s EPS performance keeps decelerating. The shrinkage from Q3 2022(-20.17%) to Q4 2022(-743.2%) is also big.
Technical Analysis
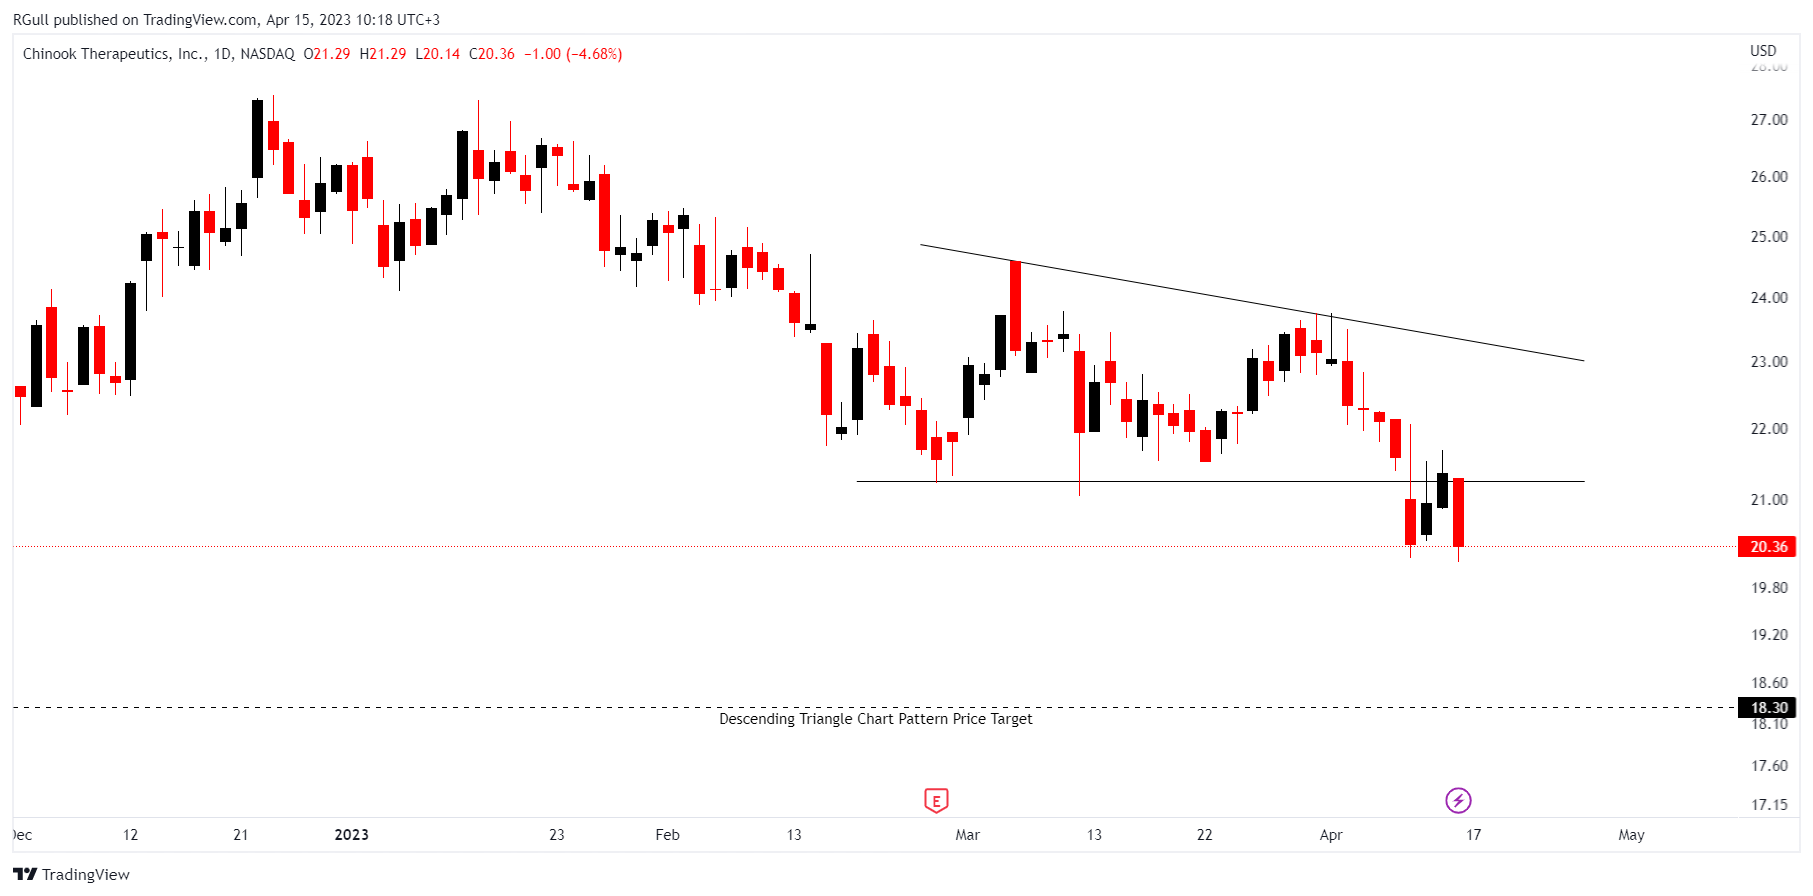
The price chart formed an approximately 2-month-long Descending Triangle Chart Pattern as a continuation pattern in a downtrend with the horizontal boundary acting as support at 21.25 levels.
After the breakdown, we see a pullback up until the ex-support, the current resistance level of 21.25, and Friday’s close indicates the continuation of the downward movement.
My technical filter for shorting any kind of instrument is 200 day MA to be in line with the trend. The stock is traded below the 200-day EMA.
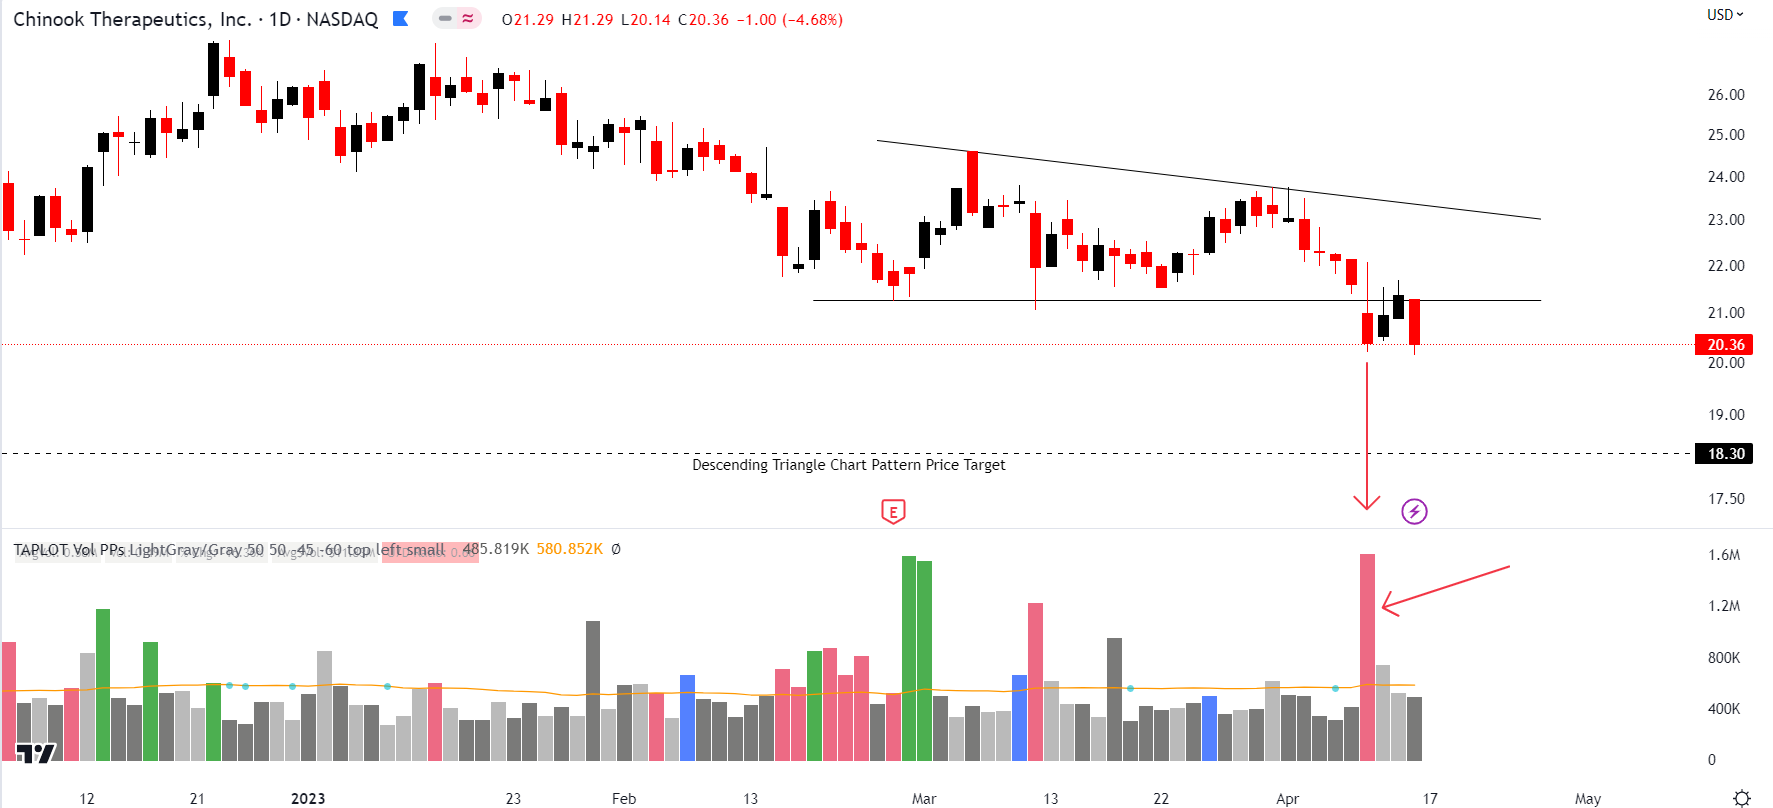
Also as you can see the breakdown in the below graph came with a huge sell volume which supports our short idea in terms of tracking the institutional behaviors.
Game Plan
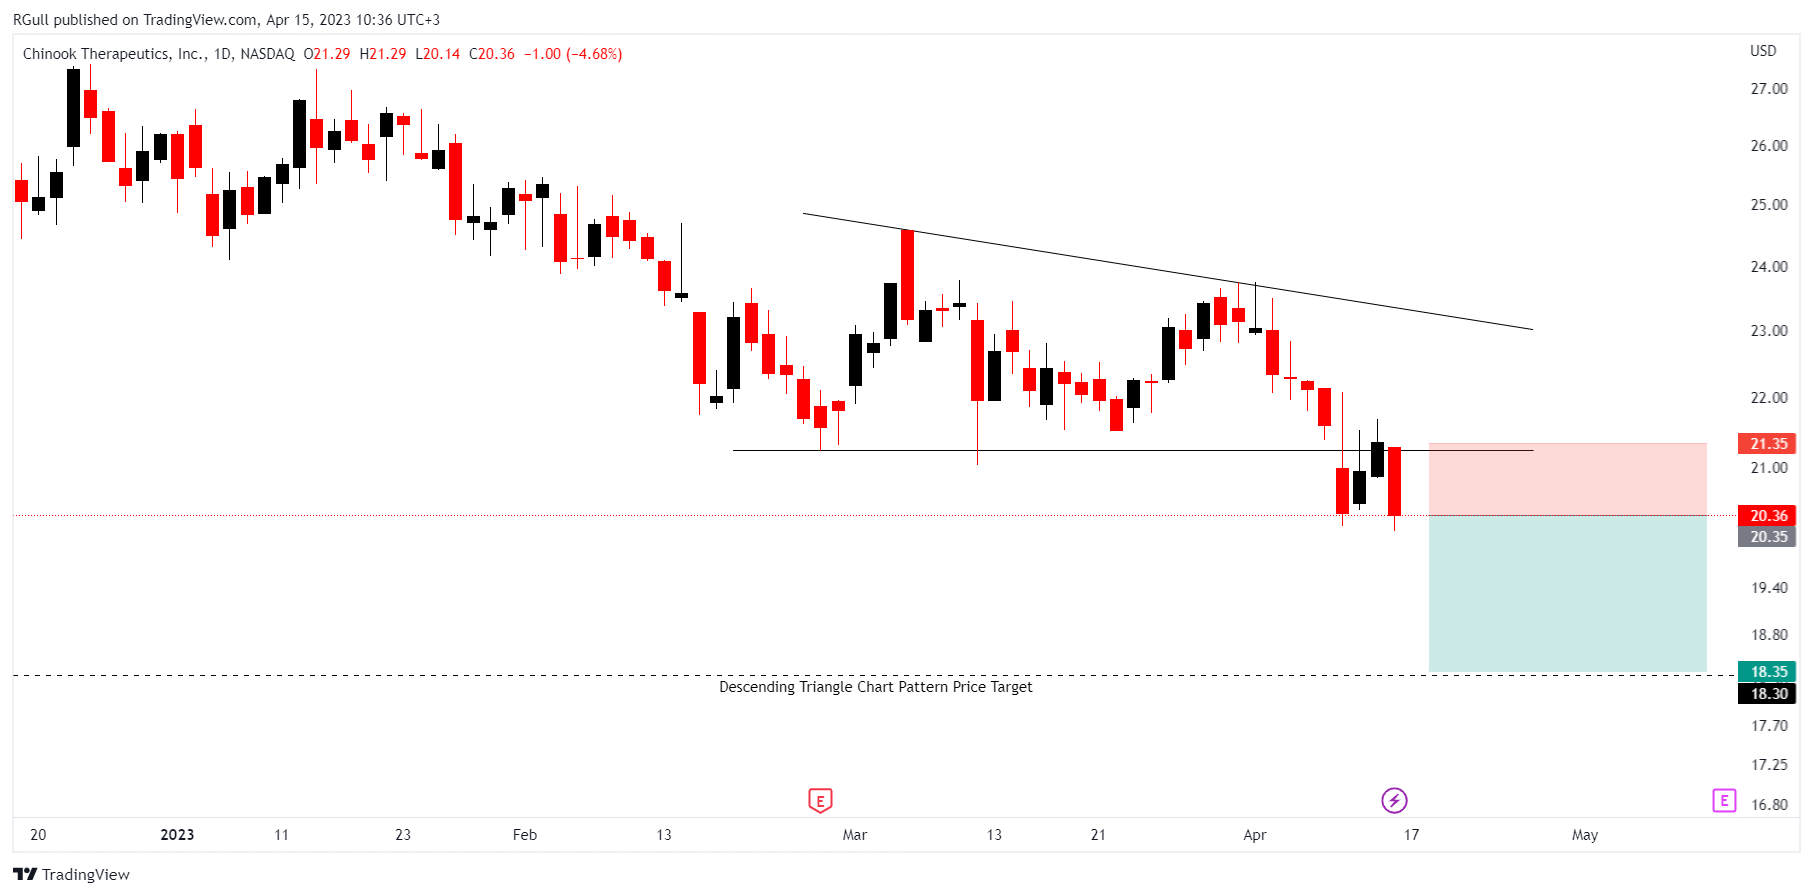
I prefer to structure the game plan on the above daily graph.
Entry: 20.35, Stop Loss Level: 21.35, Take Profit Level: 18.35, RR= 1 / 2
The stop loss level is determined according to the ex-support, the current resistance level of 21.25. If the share price moves above that level I’d like to be stopped out fastly to cut my losses as quickly as possible. Remember that sitting on a losing trade has an opportunity cost which is why it is so crucial to cut losses small and let the winners run within the general portfolio strategy.
I’d rather risk 0.5% of my portfolio for this position.
MSI(Motorola Solutions, Inc) - Long Idea
Story
Motorola Solutions Inc manufactures communications equipment that includes infrastructure, two-way portable radios, and a variety of services to manage and support communication networks.
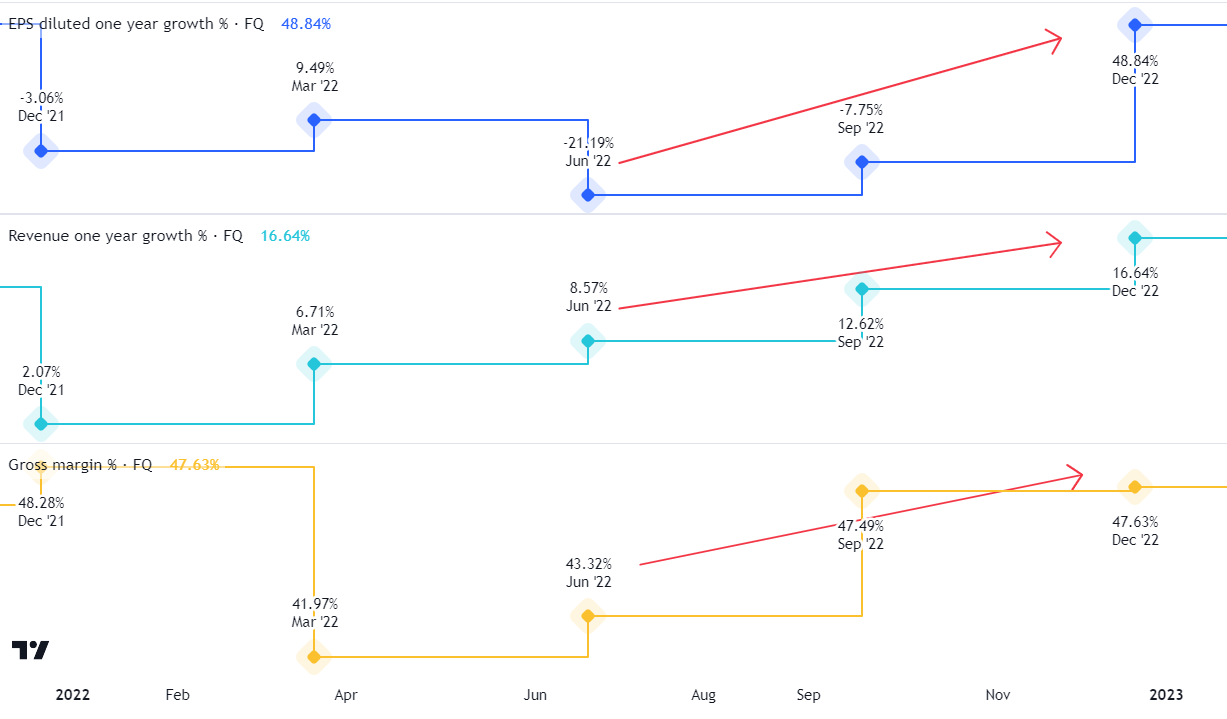
Seeing three-quarters of EPS acceleration on a YoY basis is an important support on the fundamental side. As you can see below, the company has 3 quarters of acceleration in both EPS YoY, Revenue YoY, and Gross Margin YoY.
The driving force behind the price action in March could be the below news,


Technical Analysis
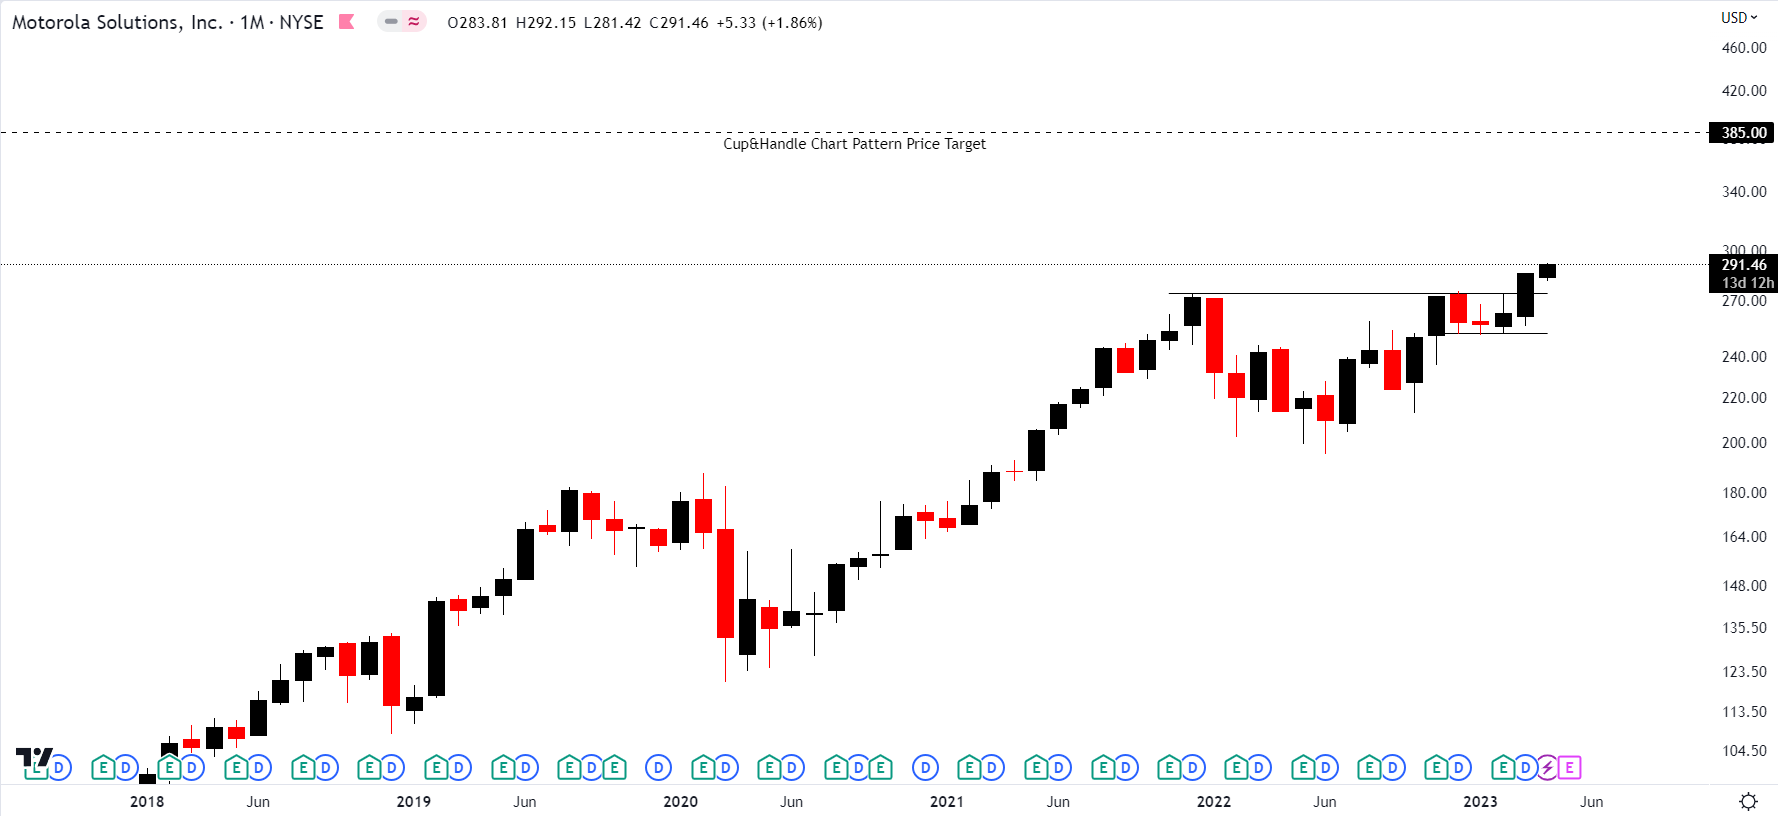
The price chart formed an approximately 1.5-year-long Cup & Handle Chart Pattern Price Target as a bullish continuation in an uptrend with the horizontal boundary acting as resistance at 275 levels.
The March monthly bar close or the 27/03/2023 weekly bar close might have been a better entry for the trade but breakouts in monthly graphs are more reliable than the lower time frames. That is why it shouldn’t be considered a missed opportunity.
The stock price is above 150 EMA and 200 EMA.
150 EMA > 200 EMA.
The current stock price is 25% above the 52-week low and it is within 25% of the 52-week high.
Game Plan
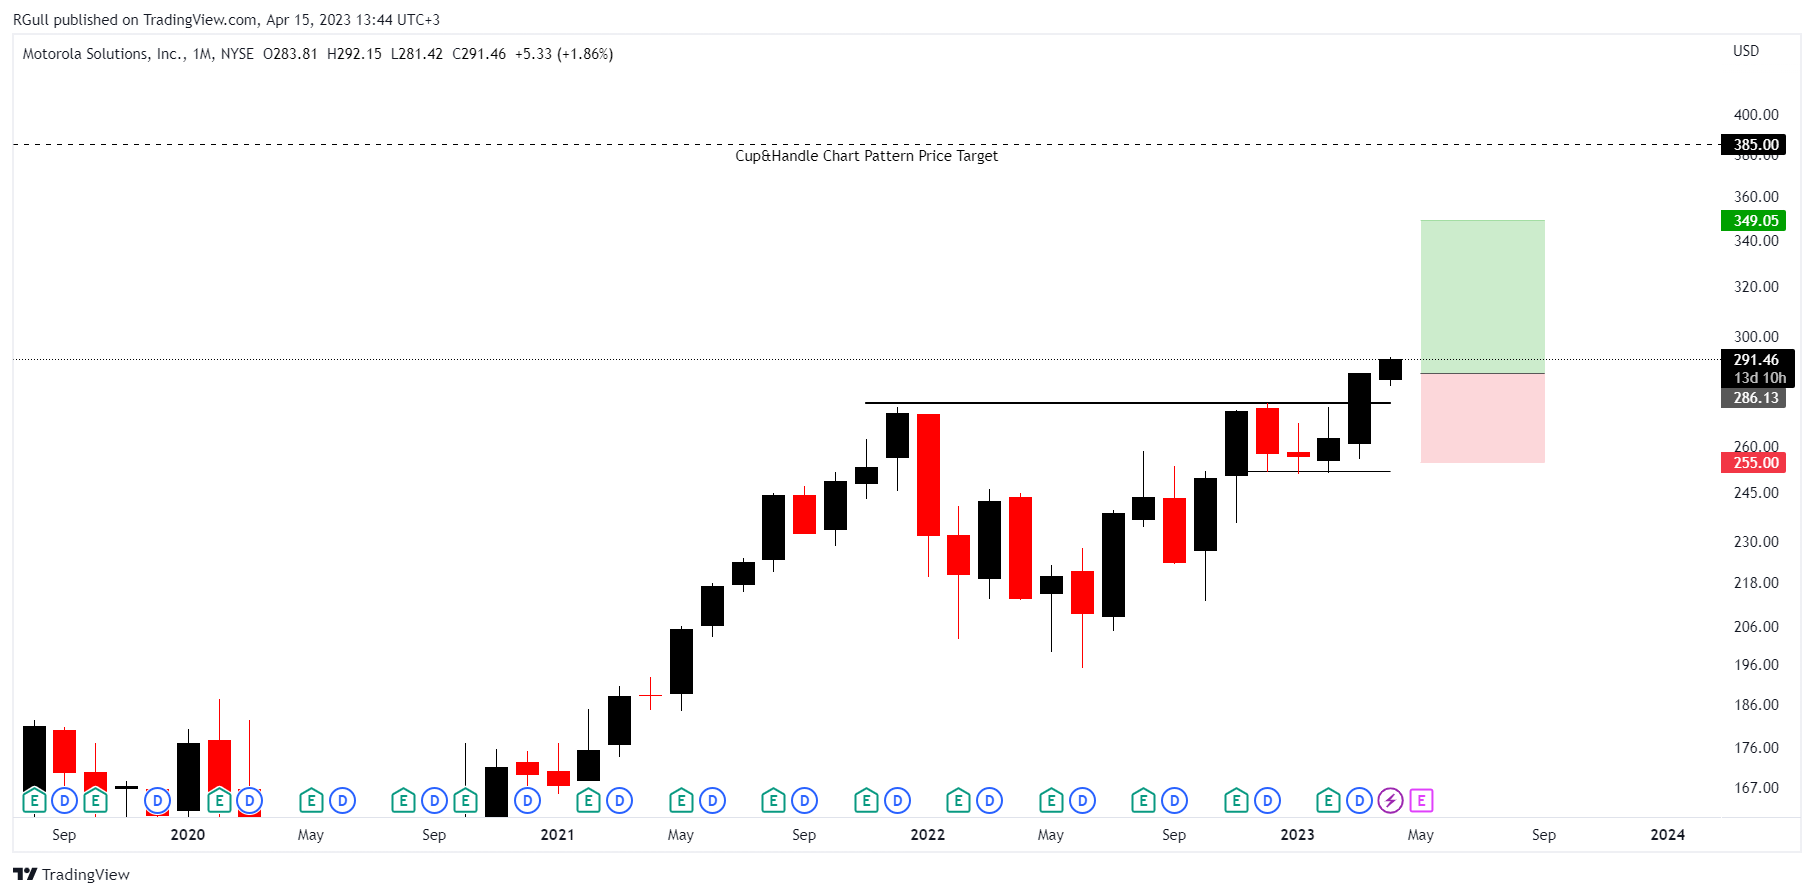
I would prefer to structure the game plan on the above monthly graph, which is why it is a long-term trade idea.
Entry: 286.13 (buy-limit order to the March close price), Stop Loss Level: 255, Take Profit Level: 349 or trailing stop, RR= 1 / 2 or more.
I’d rather risk 1.5% of my portfolio for this position because it is a relatively long-term trade.
AZO(AutoZone, Inc) - Long Idea
Story
AutoZone, Inc. retails and distributes automotive replacement parts and accessories. It offers various products for cars, sport utility vehicles, vans, and light trucks, including new and remanufactured automotive hard parts, maintenance items, accessories, and non-automotive products.
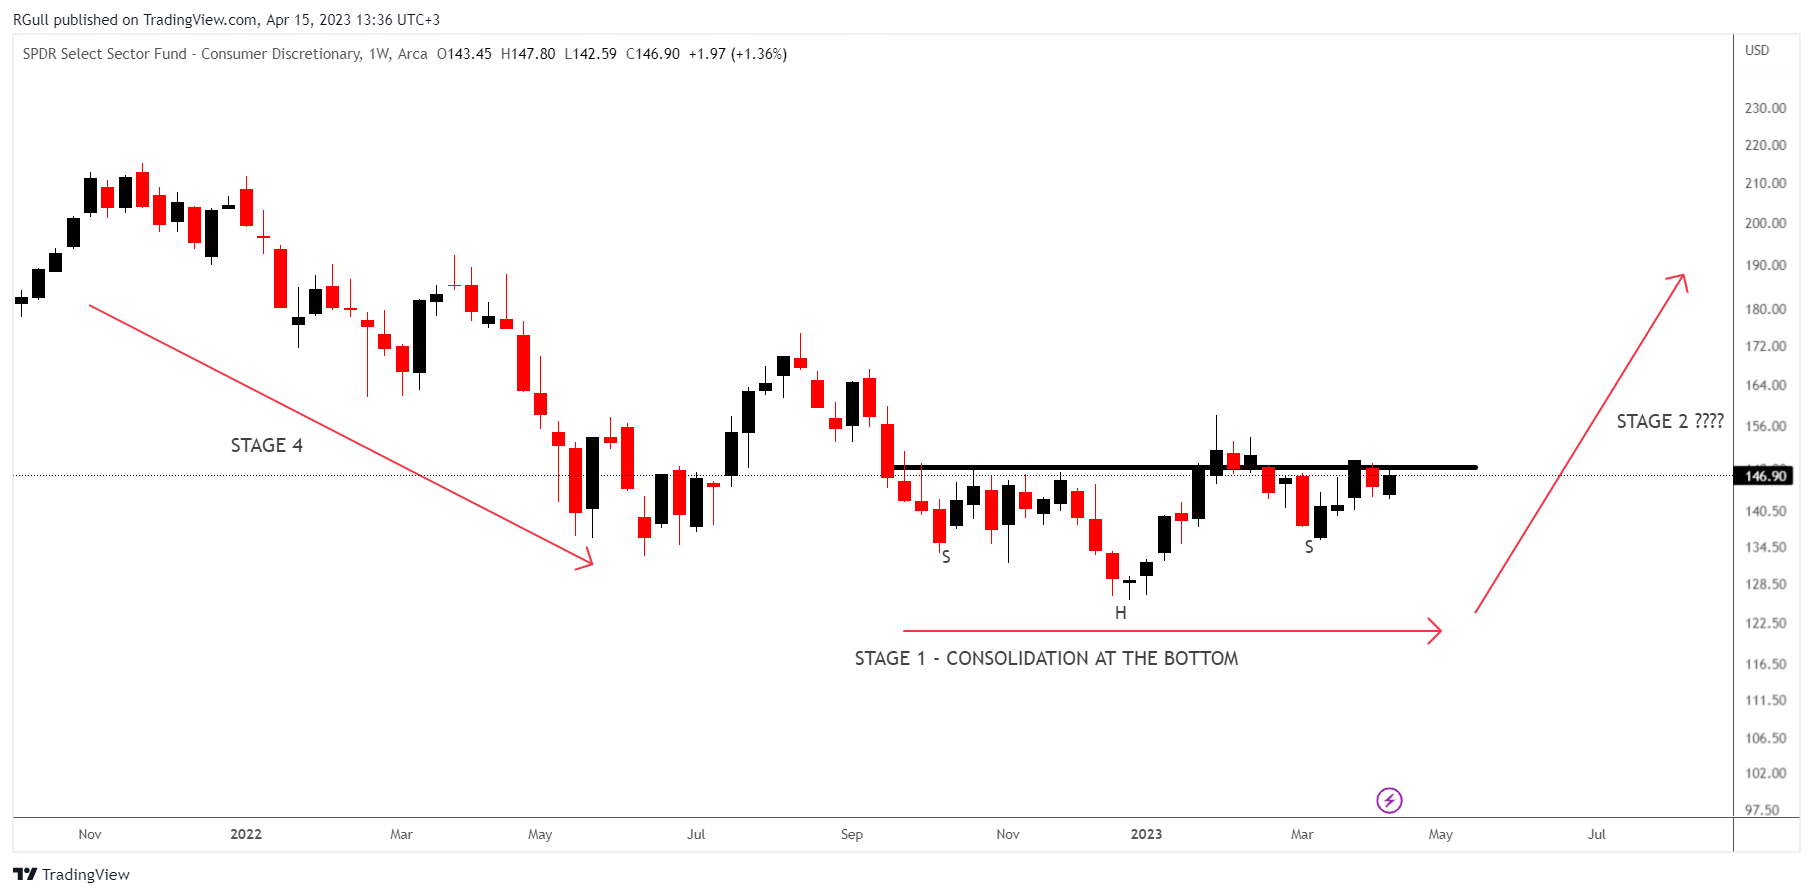
According to GICS, the company is classified under the consumer discretionary sector which generally performs better when the market bottoms. Below you can see XLY-Consumer Discretionary Sector Fund which is establishing a consolidation at the bottom.
The company has 2 quarters of acceleration in both EPS YoY, Revenue YoY, and Gross Margin YoY. Not that solid numbers but it is still a positive sign.
Technical Analysis
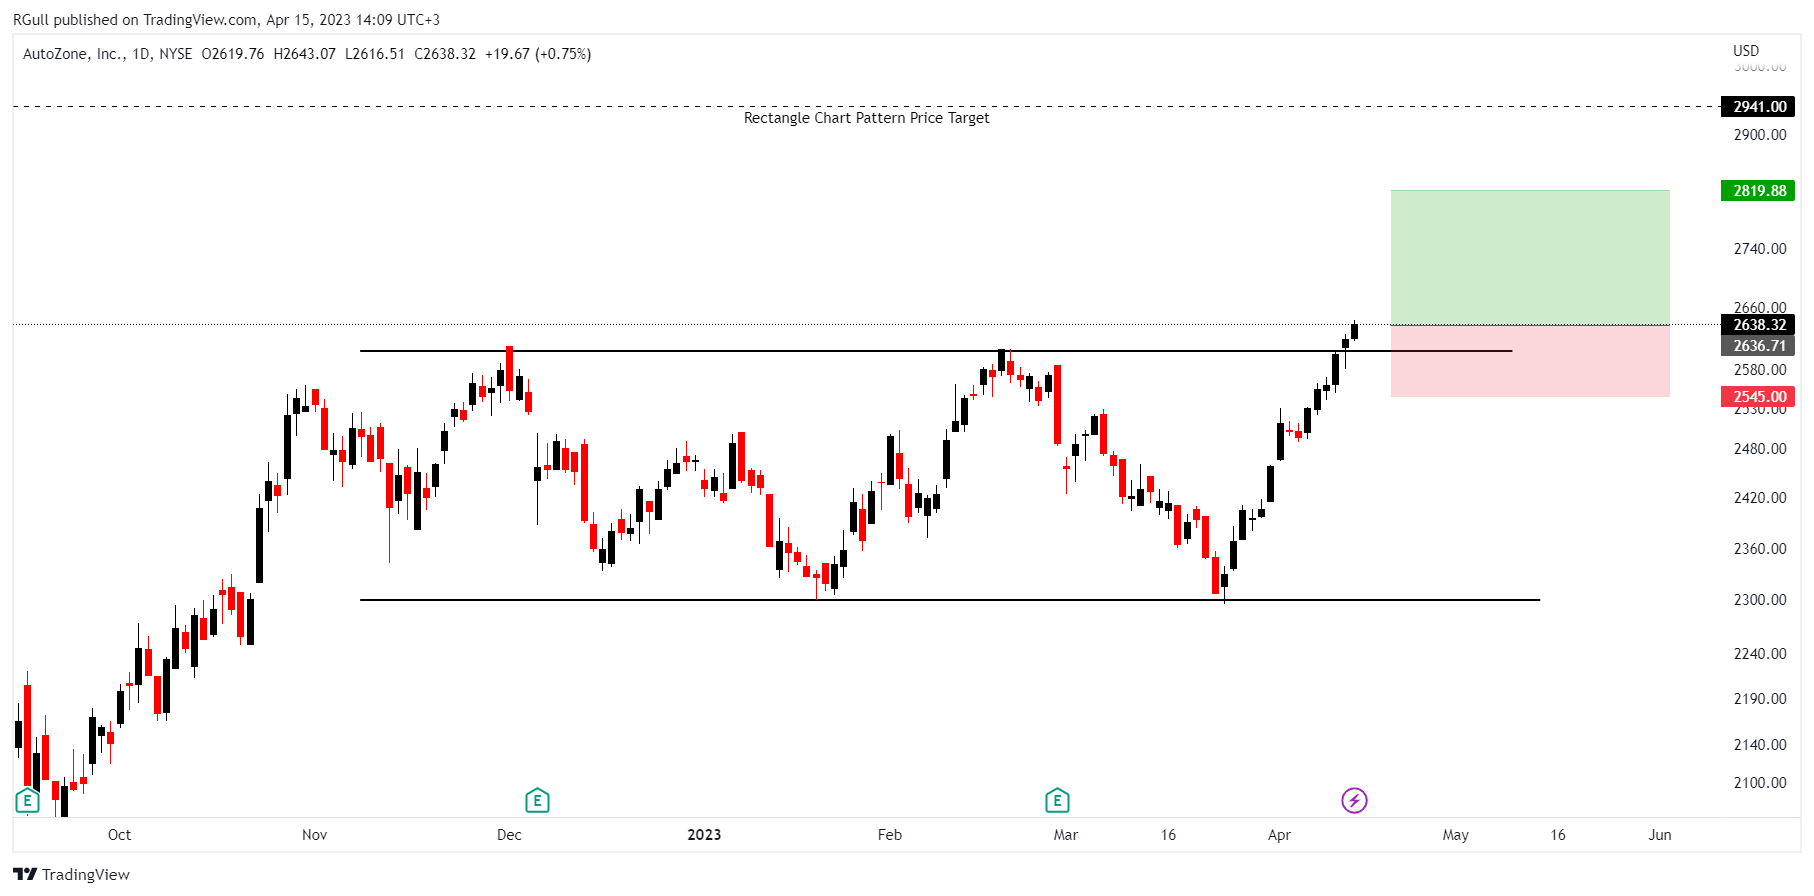
The price chart formed an approximately 5-month-long Rectangle Chart Pattern Price Target as a bullish continuation in an uptrend with the horizontal boundary acting as resistance at 2603 levels.
The stock price is above 150 EMA and 200 EMA.
150 EMA > 200 EMA.
The current stock price is 25% above the 52-week low and it is within 25% of the 52-week high.
Game Plan
To convince myself about the strength of the breakout, I seek a daily close of at least 3% above the resistance level by taking Edwards and Magee as a reference but if there is a convincing weekly breakout I might take the trade.
I would prefer to structure the game plan on the above weekly graph(technical analysis section).
Entry: 2636.7, Stop Loss Level: 2545, Take Profit Level:2819, RR= 1 / 2.
I’d rather risk 1% of my portfolio for this position.
CRYPTO
BNBUSDT - Long Idea
Technical
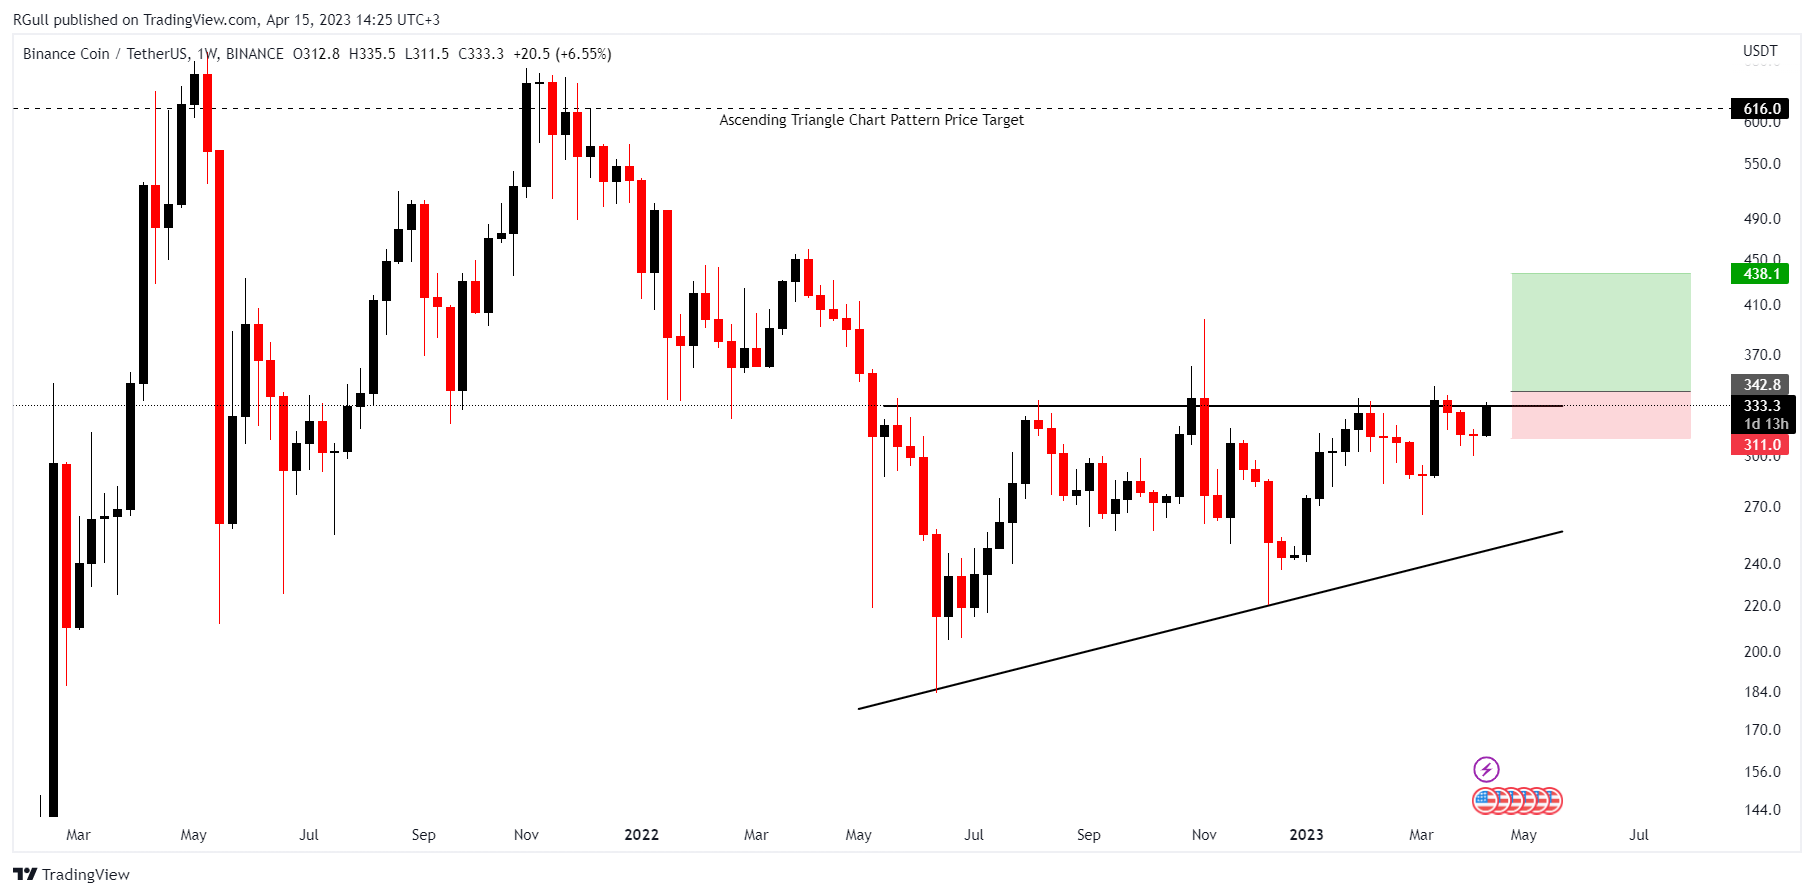
The price chart formed an approximately 10-month-long Ascending Triangle Chart Pattern Price Target as a bullish reversal after a downtrend with the horizontal boundary acting as resistance at the 332.8 level.
After a possible breakout above the resistance level, the price might target the 616 level.
The stock price is above 150 EMA and 200 EMA.
150 EMA > 200 EMA.
The current stock price is 25% above the 52-week low.
Game Plan
I would prefer to structure the game plan on the above weekly graph(technical analysis section).
Entry:342.8, Stop Loss Level:311, Take Profit Level:438, RR= 1 / 3.
Getting into the trade if we see a daily close of 3% above the 332.8 level.
The stop loss level is determined according to the low of the weekly breakout candle before the breakout.
I’d rather risk 1% of my portfolio for this position.