TRADE IDEAS
29/04/2023

GBPUSD - Long Idea
PCE deflator, the inflation data that the FED follows in determining its policy, came in at 0.1% MoM (in line with expectations) and 4.2% YoY(from 5.1% in February) in March. The lowest increase since May 2021.
Core PCE increased by 0.3% and 4.6% on both monthly and annual basis, respectively, in line with expectations.
PCE side supports FED’s soft landing so the data does not suggest any game plan change from the 25 bp increase.
As the GDP report on Thursday already disclosed the quarterly reading of the PCE inflation data, it was not expected to cause a significant response. That is why market participants paid close attention to Employment Cost Index data which increased by 1.2% quarterly(0.1% more than expected).
Personal income was up 0.3% in March, and spending was unchanged. Mitigate the risk of a sudden recession so in line with the 25bp rate hike plan in May.
On the UK side, the last 10.1% inflation print suggests more hikes compare to FED but we still need to follow updates on the real economy side.
Overall, BoE’s potential hiking path seems to be longer than FED’s. Thus we can justify being on the long side in GBP.
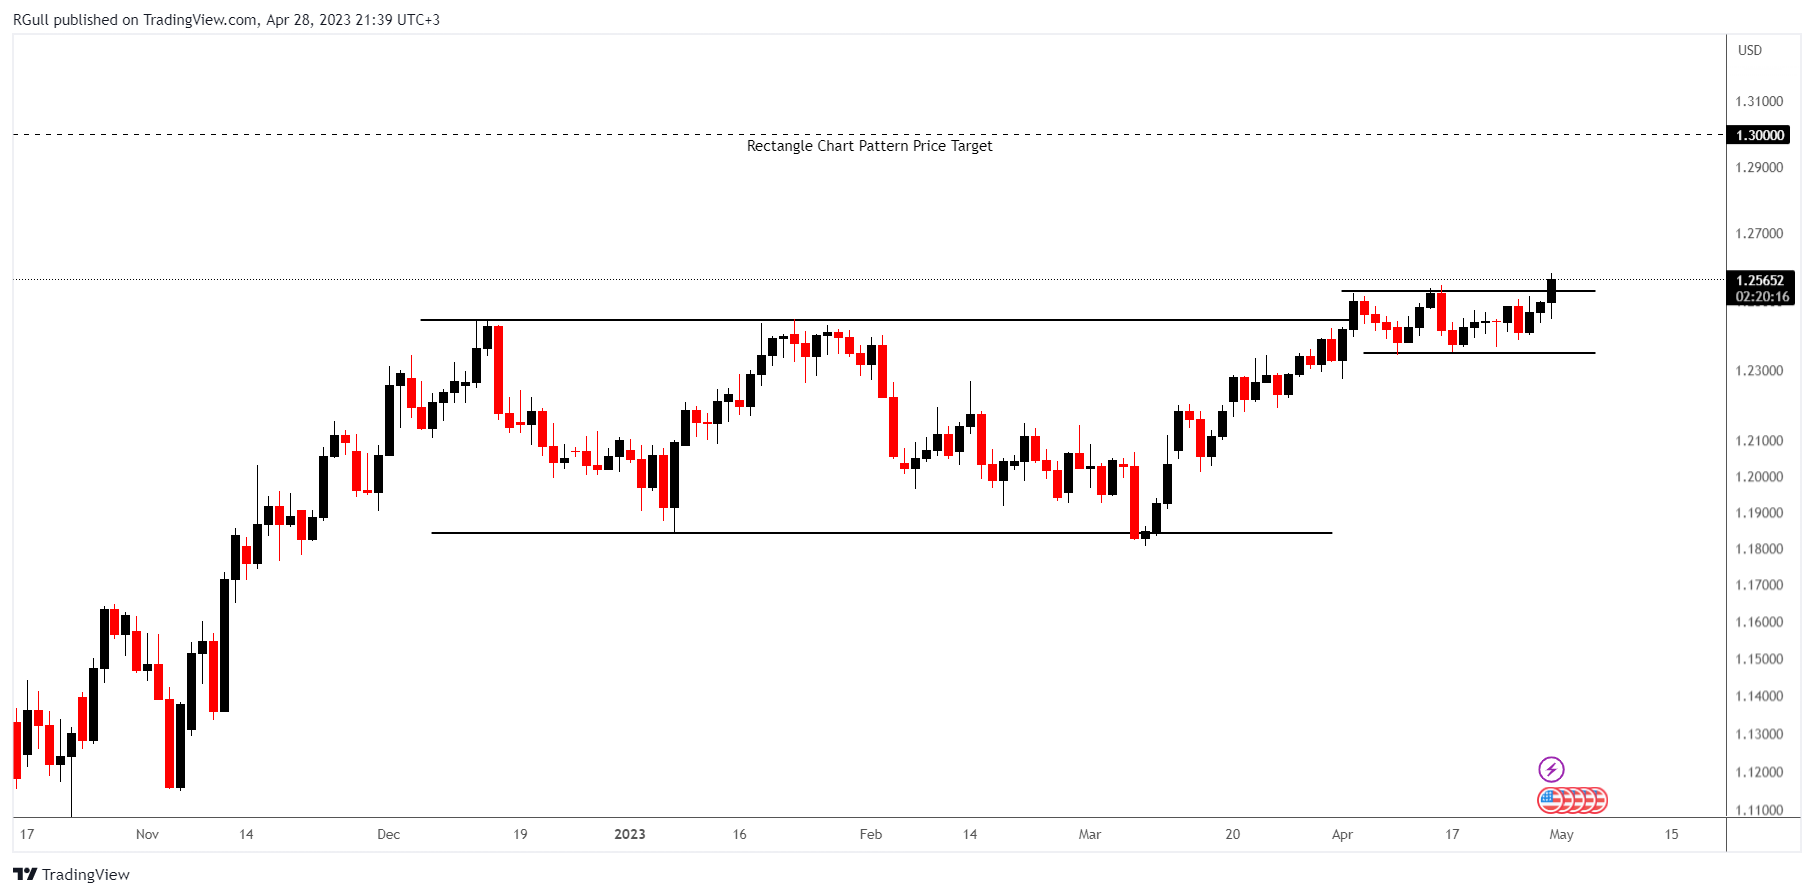
The chart formed an approximately 4-month-long rectangle chart pattern as a bullish continuation in an uptrend, with resistance at 1.24465 levels.
Apart from that the chart also formed an approximately 1-month-long rectangle chart pattern as a bullish continuation in an uptrend, with resistance at 1.253 levels.
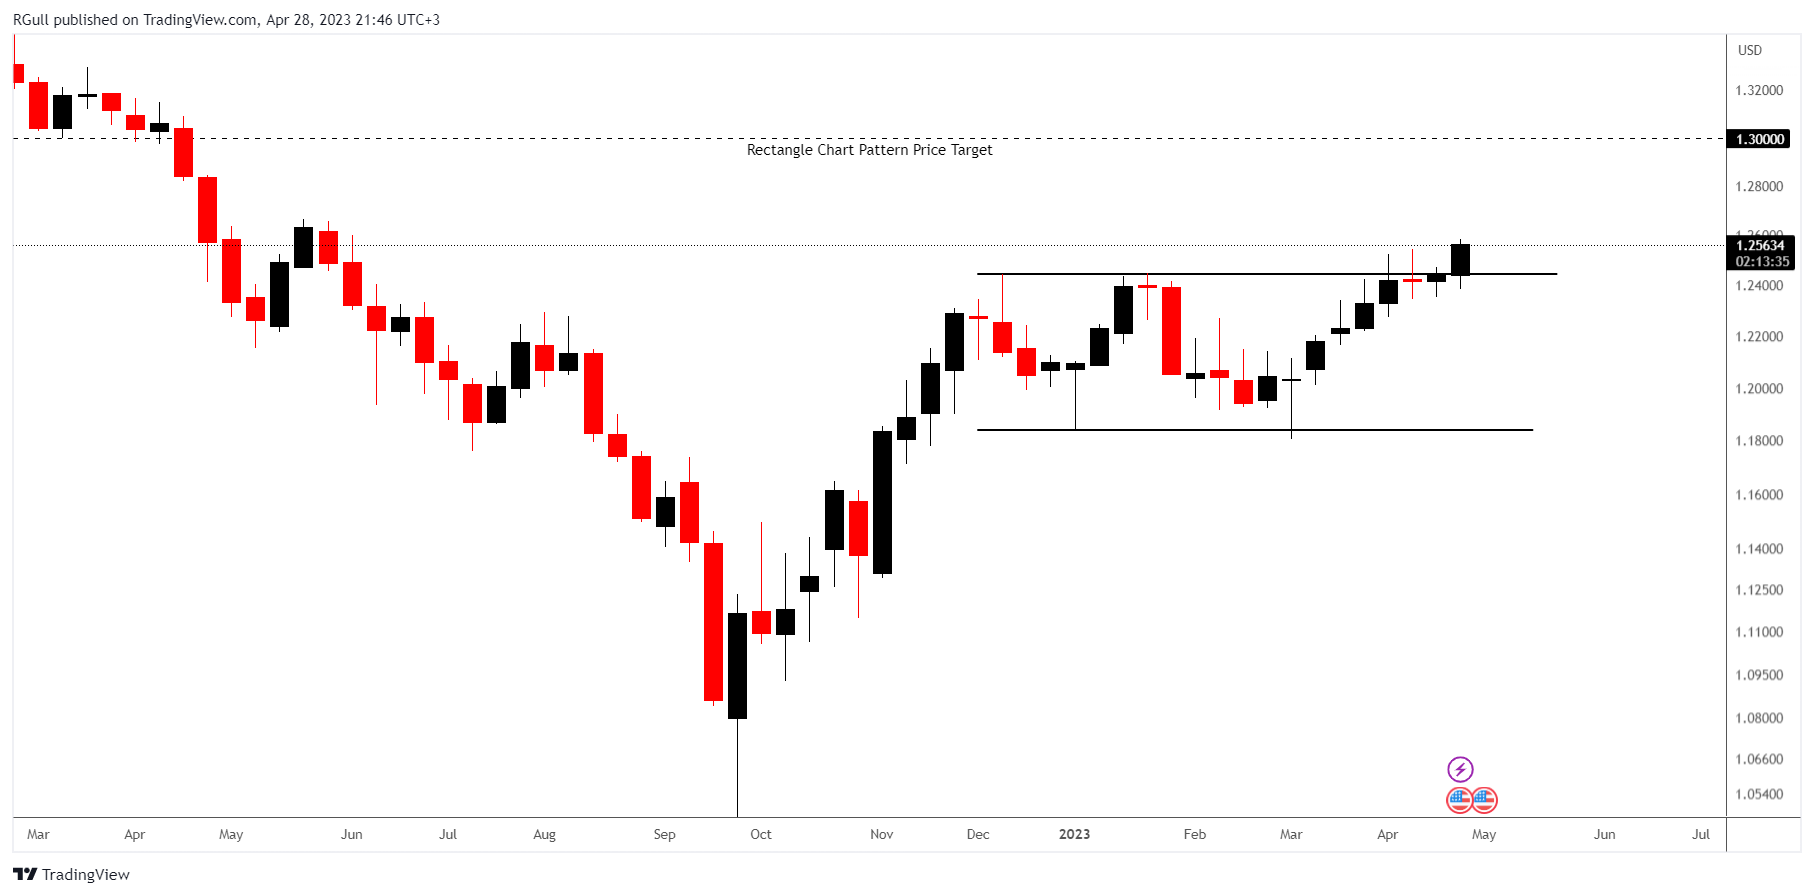
A daily close above 1.2570 levels would validate the breakout from the first 4-month-long rectangle chart pattern.
This breakout could potentially result in a chart pattern target of 1.30 levels.
EURUSD - Short Idea
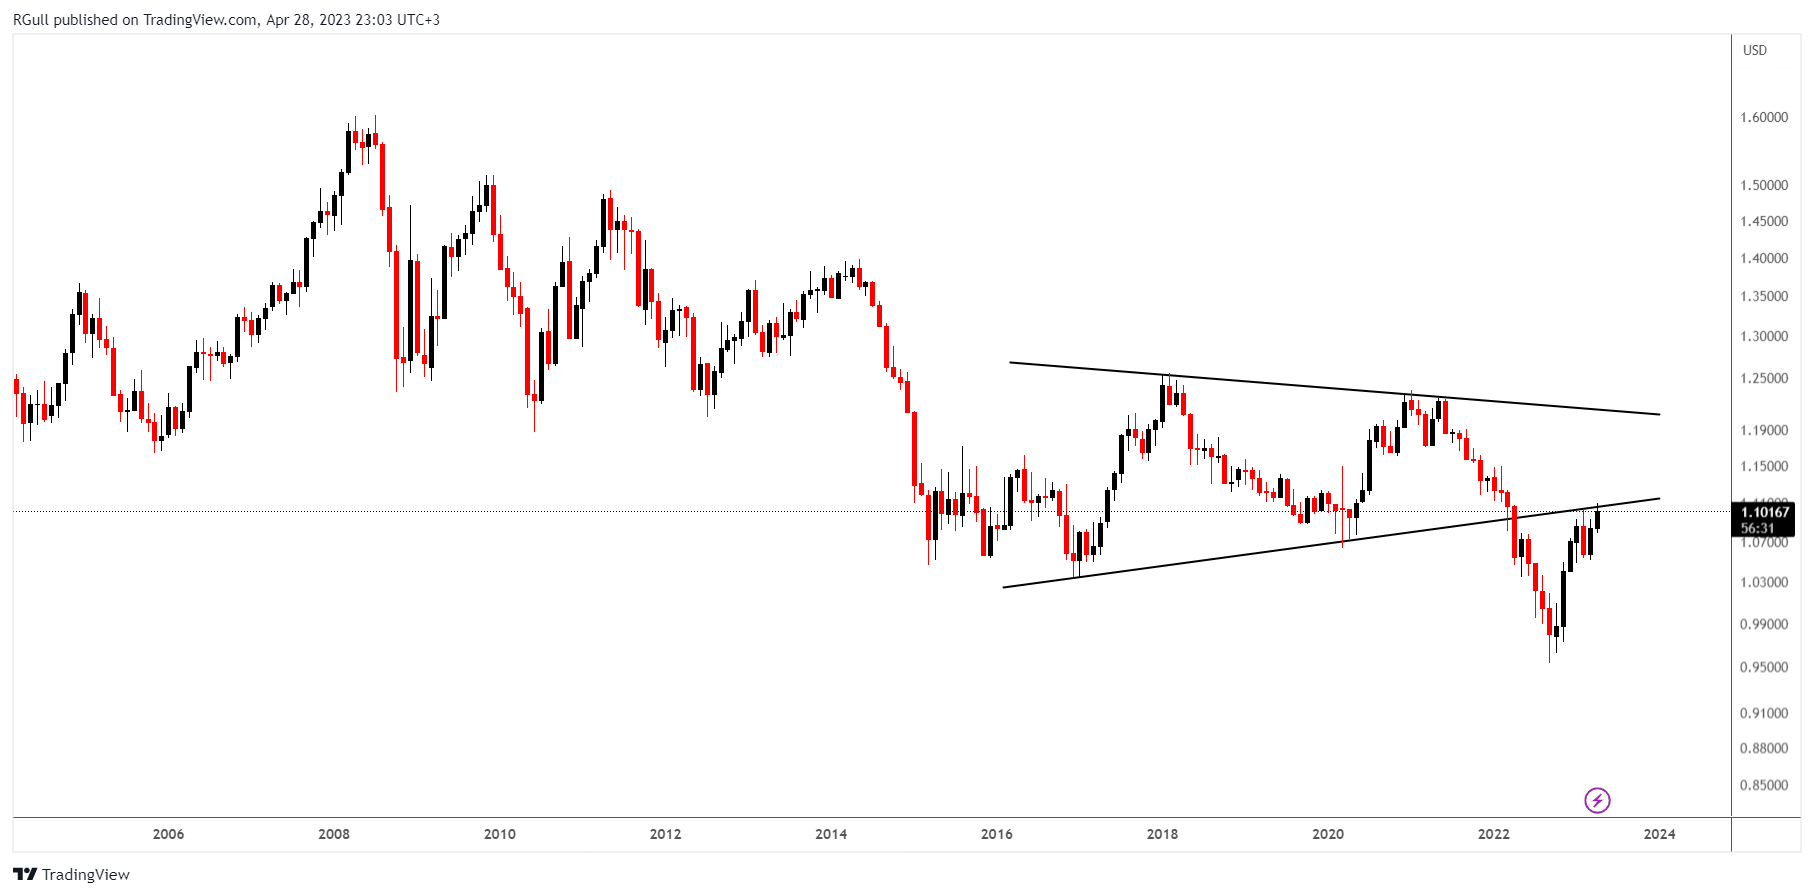
The above monthly EURUSD graph shows the importance of the 1.10 level which acts as a resistance.
On the DXY side as I mentioned in the above GBPUSD trade idea 25 bp rate hike is being priced and there has been no data indicating a sudden recession that makes FED reevaluate its hiking path.
Just to recall that any threat on the growth side would be influential on central banks’ rate-hiking decisions.
However, on the Euro side, we saw the first quarterly negative growth on Friday which might push the ECB to reevaluate its hiking path.
Also considering the reliability of the monthly scale graphs, the price is trading at an important resistance level which is why any decrease in EUR against USD wouldn’t be a surprise.
USDZAR- Long Idea
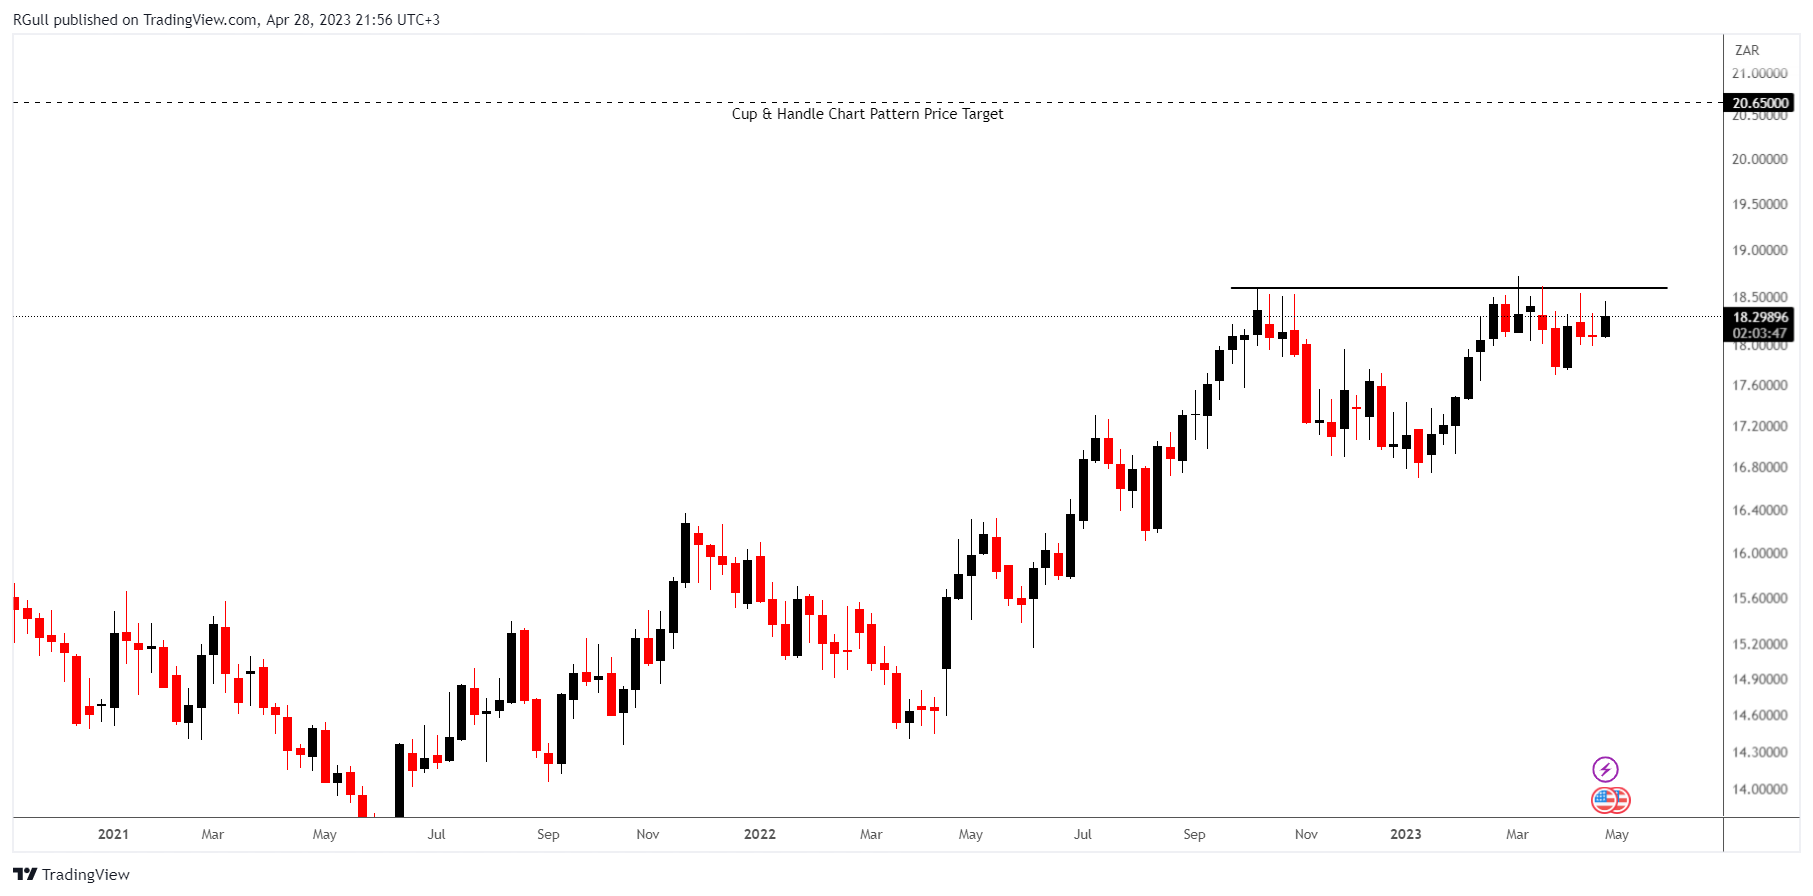
A well-known phenomenon is that money flows to developed economies from emerging economies during contractionary monetary policy times.
Considering the current tightening process of central banks, emerging currencies such as ZAR seem weak relative to USD. Also, an upcoming 25 bp rate hike favors the idea of a strong USD against emerging currencies.
The chart formed an approximately 6-month-long Cup and Handle chart pattern as a bullish continuation in an uptrend, with resistance at 18.59 levels.
A daily close above 18.78 levels would validate the breakout from the first 6-month-long Cup and Handle chart pattern.
This breakout could potentially result in a chart pattern target of 20.65 levels.
CADJPY- Long Idea
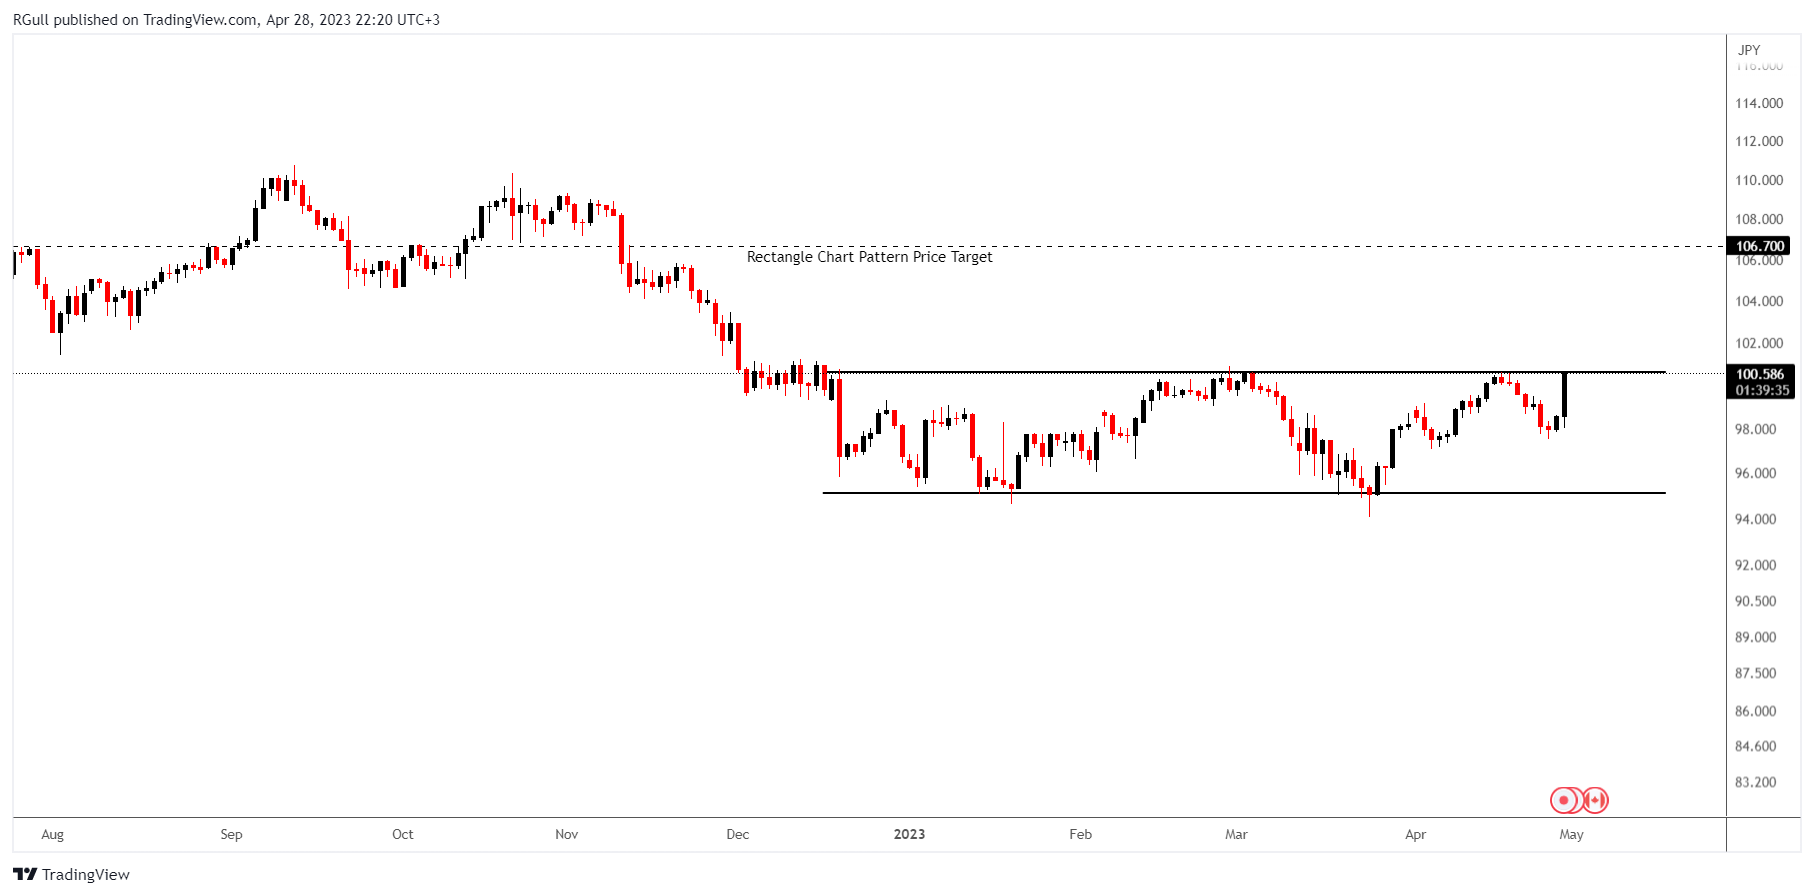
Considering the well-known correlation between CAD and Oil, we may expect to see positive pricing in CAD due to OPEC + decision of cutting 1 million barrels of daily production at the beginning of April.
The Bank of Japan (BoJ) chose to maintain its policy rate at -0.1% and continue with quantitative easing on Friday, which has a negative impact on the competitiveness of the Japanese yen compared to other currencies.
As there has been no data indicating a sudden recession, it is reasonable to anticipate a favorable shift in oil prices and a corresponding negative impact on the Japanese yen due to its “safe haven” status. This, in turn, could indirectly affect the Canadian dollar.
Remember that if there is no recession, we would expect to see a demand for Oil due to its status of making the production engines of the world economy work. Therefore seeing a positive impact on Canada’s currency would make sense due to its position as an oil exporter.
The chart formed an approximately 4-month-long Rectangle chart pattern as a bullish reversal after a downtrend, with resistance at 100.64 levels.
A daily close above 101.65 levels would validate the breakout from the first 6-month-long Rectangle chart pattern.
This breakout could potentially result in a chart pattern target of 106.7 levels.
Hang Sang Index Futures(HSI1!) - Long Idea
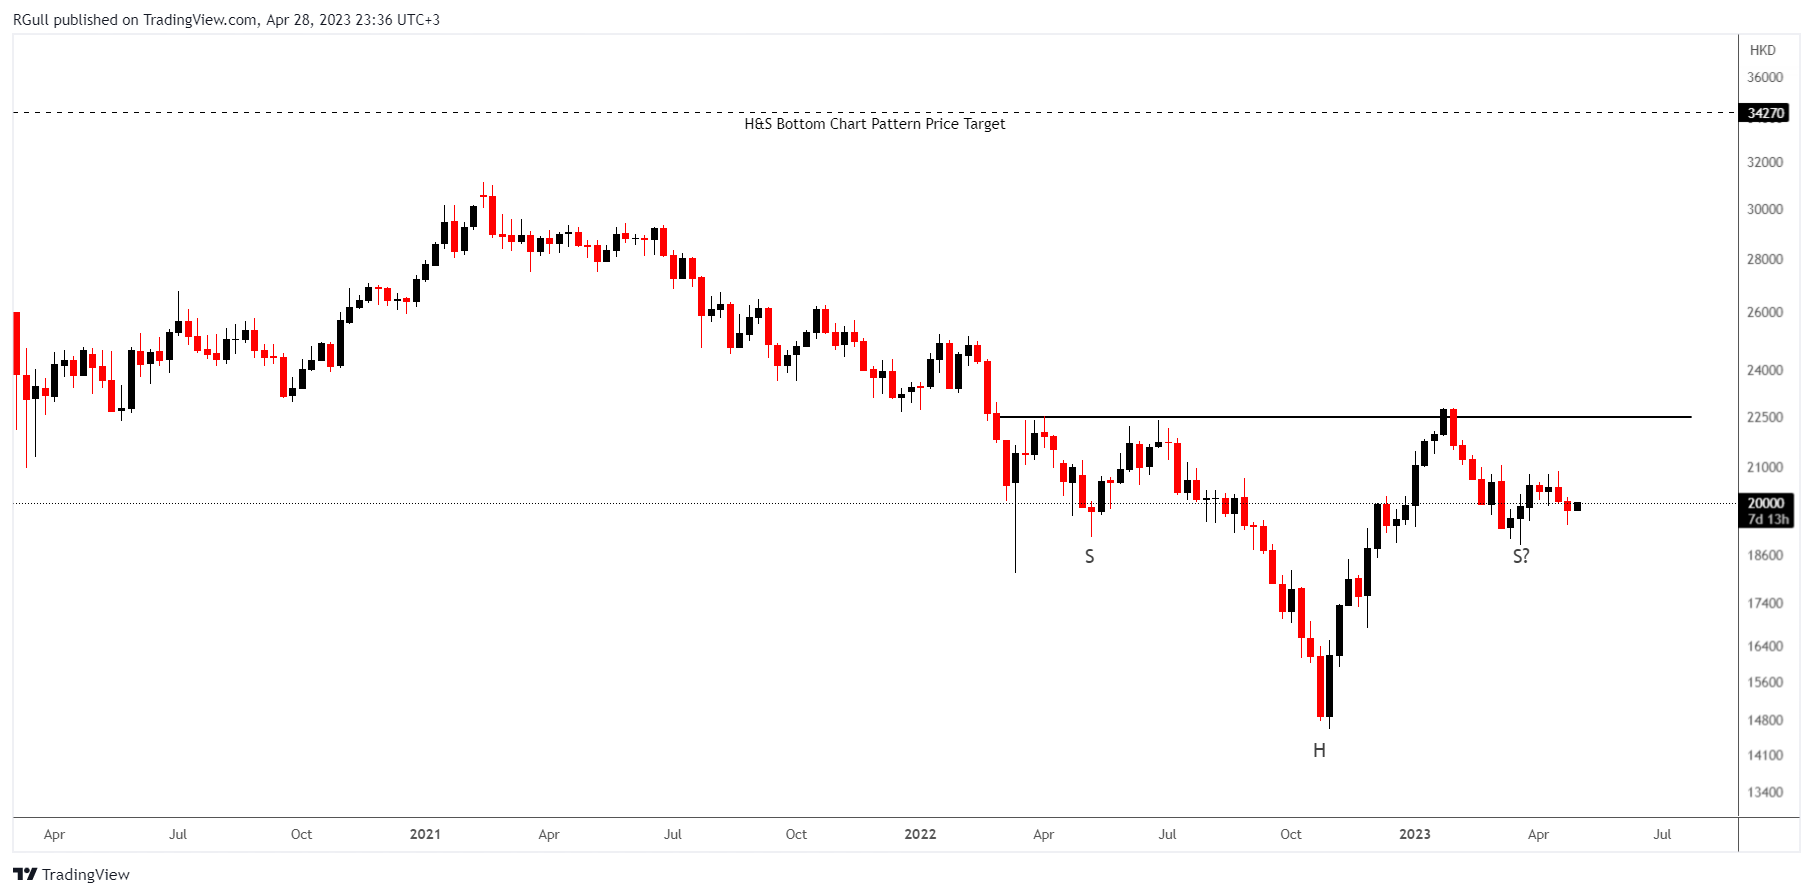
Hang Sang index is an important indicator to follow the process of China’s reopening.
Also could be considered a reliable indicator of world economic growth because growing China means a growing world.
So being long on HSI futures means believing that there won’t be a sudden or strong recession.
The chart formed an approximately 12-month-long H&S Bottom chart pattern as a bullish reversal after a downtrend, with resistance at 22500 levels.
A daily close above 23175 levels would validate the breakout from the first 12-month-long rectangle chart pattern.
This breakout could potentially result in a chart pattern target of 34270 levels.
FTMUSDT - Long Idea
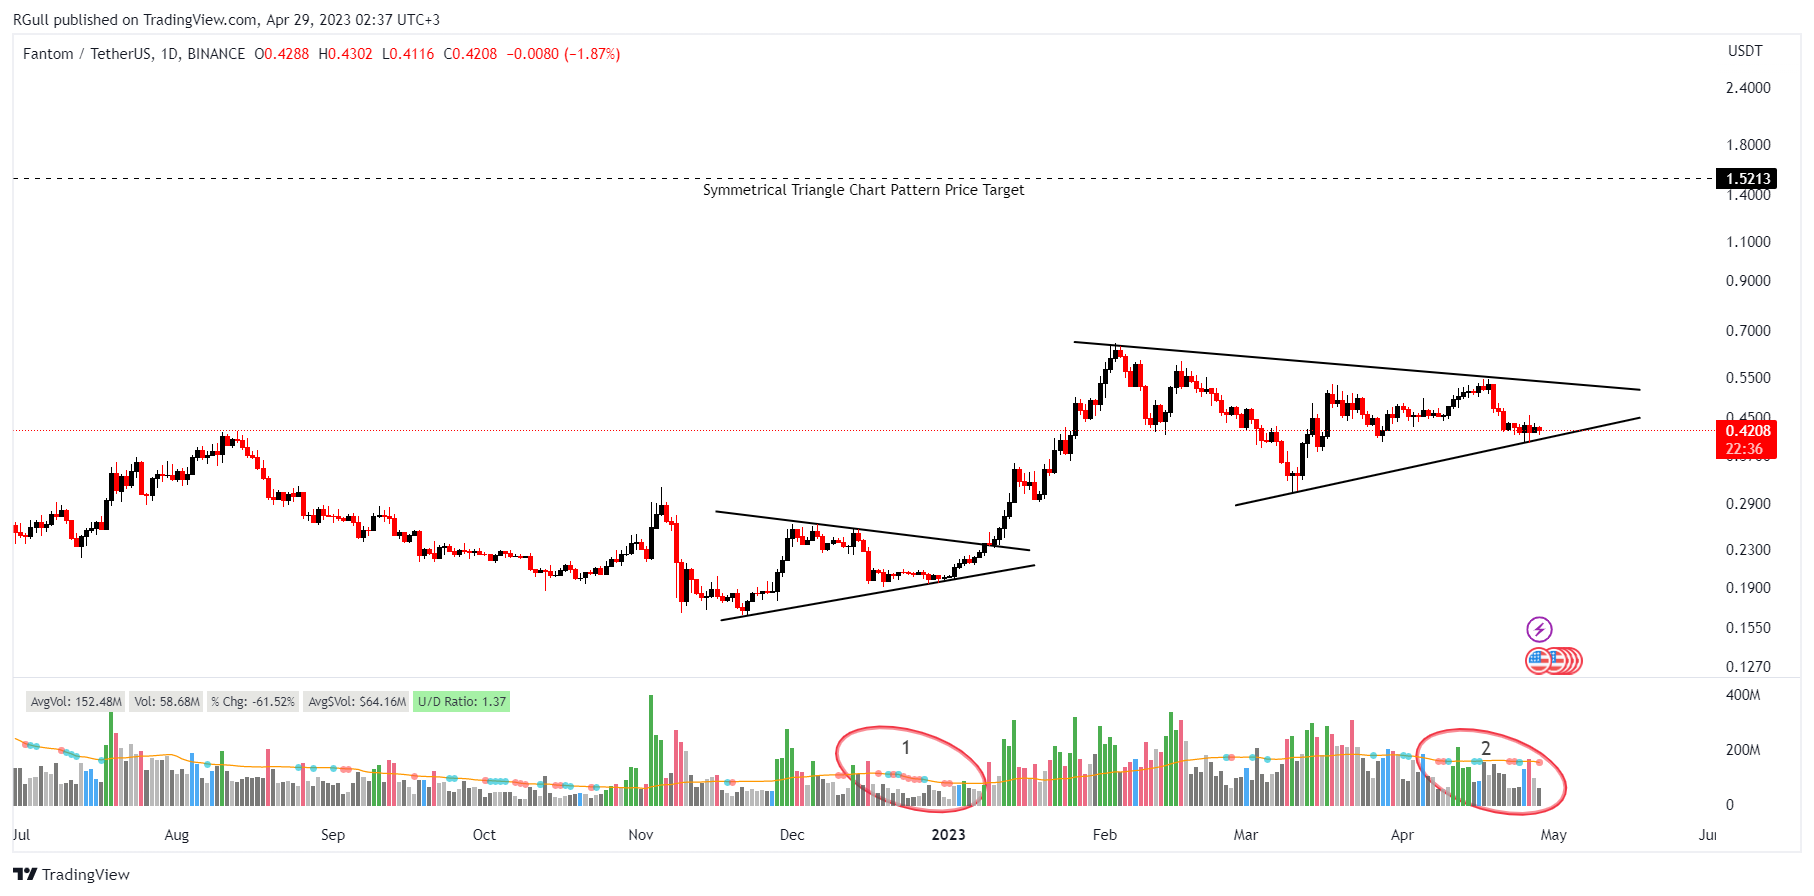
The chart formed an approximately 3-month-long Symmetrical Triangle chart pattern with resistance at 0.53-0.54 levels.
A daily close above 0.56 levels would validate the breakout from the first 3-month-long Symmetrical Triangle chart pattern.
This breakout could potentially result in a chart pattern target of 1.52 levels.
There are two periods of consolidation shown in the above graph. One resulted in a breakout after low volume as you can see in the volume section number 1, the other one is still forming.
Typically if we see a breakout with a high volume following a low volume as shown in the graph, we would see a stronger price movement. If we see the selling volume getting lower and lower toward the breakout point, that means not enough supply coming to the market in other words sellers are drying.
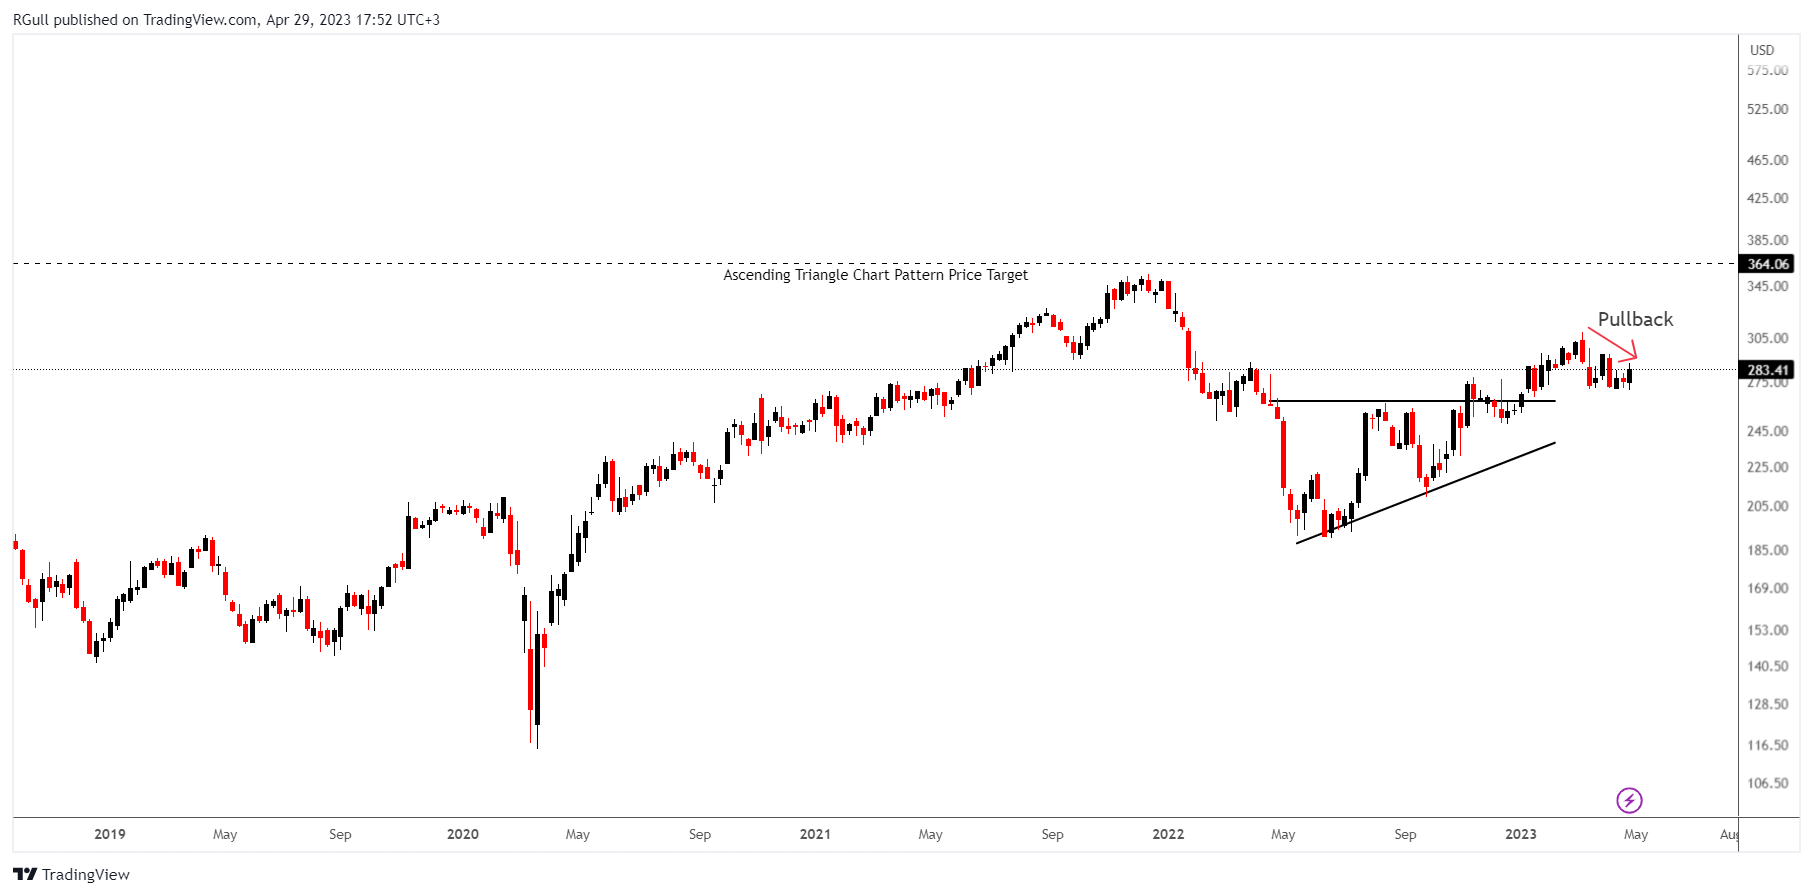
ROK(Rockwell Automation Inc) - Long Idea
Respectively we see three price contraction(45%-20%-10%) periods, each half the size of the other which is considered a prerequisite for Mark Minervini’s VCP pattern. That means the sellers are drying up in each price contraction with the decline in volume toward the breakout point.
Seeing two-quarters of EPS, Revenue, and Profit Margin acceleration on a YoY basis is an important support on the fundamental side.
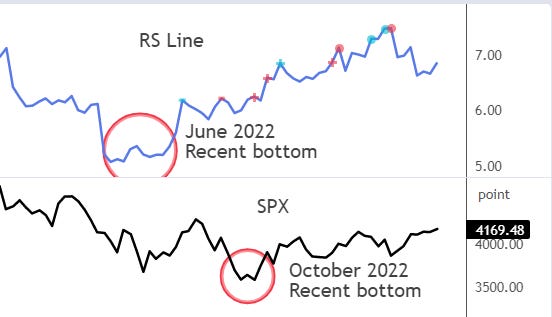
Also when comparing the stock’s relative strength(RS line of the stock) and SP500 performance, it is desired to see that the stock bottoms before the market so it could be evaluated as a potential future market leader.

The chart formed an approximately 8-month-long ascending triangle chart pattern as a bullish reversal after a downtrend, with resistance at 262.79 levels.
First, there has been a fake breakout on 07 Nov 2022 week then we see a valid breakout on 09 Jan 2023. Now the stock pulling back toward the old resistance level of 262.79 which I might evaluate as a potential buying opportunity.
This breakout could potentially result in a chart pattern target of 364.06 levels.