

TRADE IDEAS
New setups
TLT - Long/Short Idea
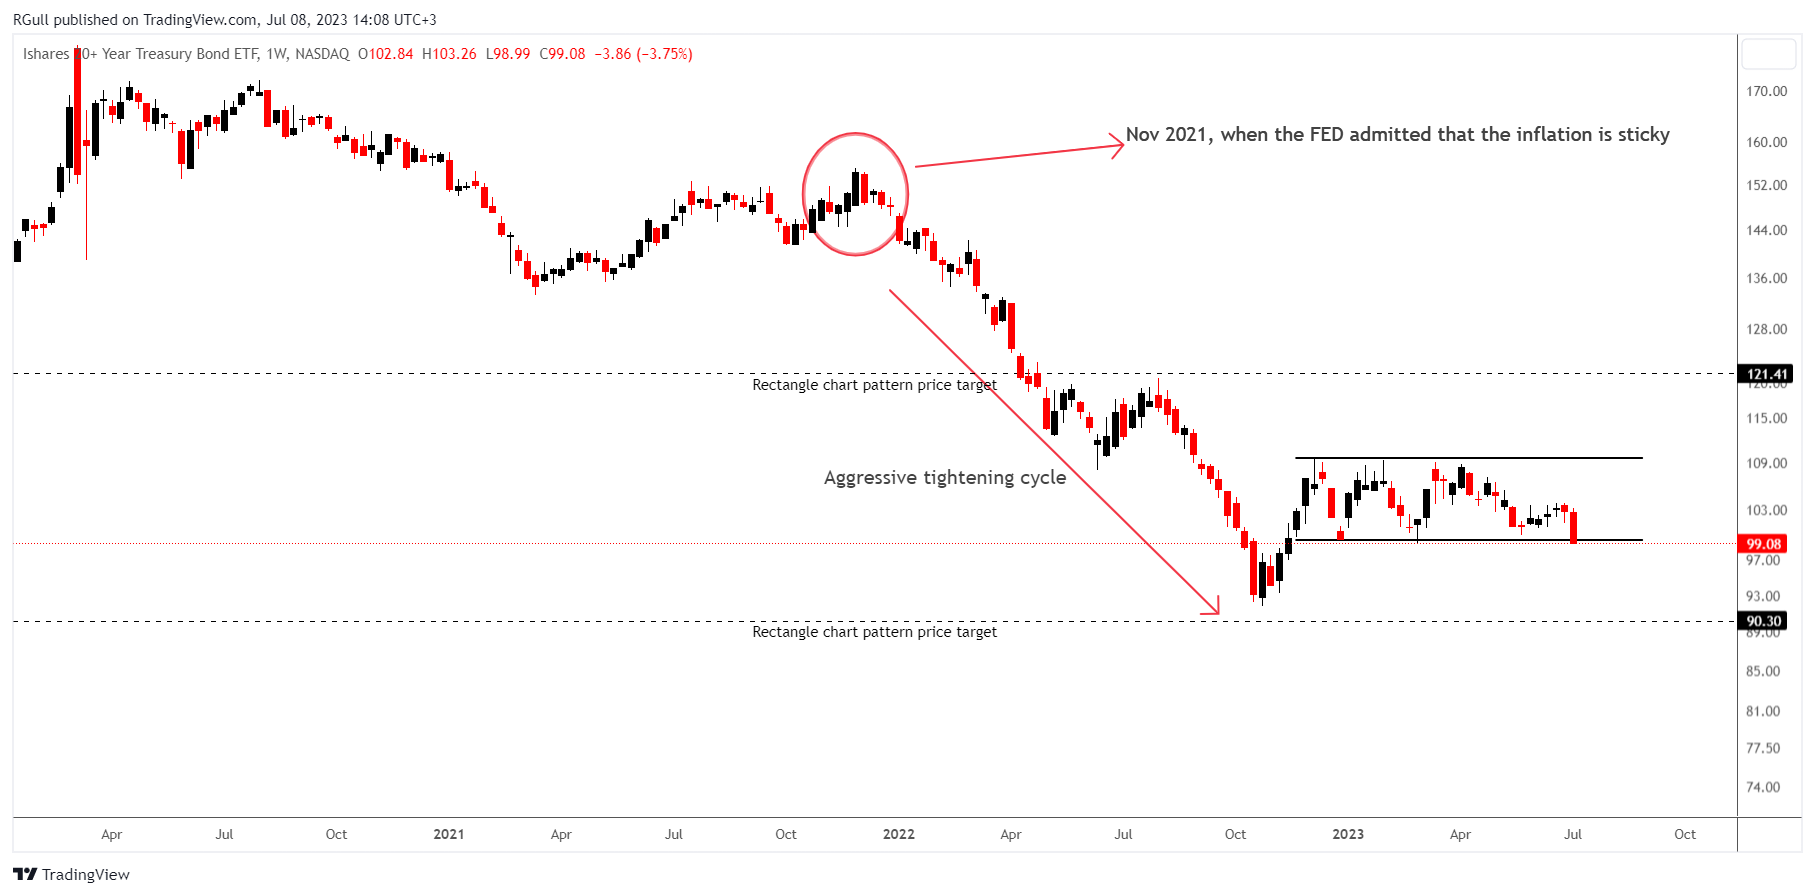
TLT is a 20+ year treasury bond ETF. As the rates increase, this graph decrease due to the inverse relationship between bond yield and the price of the bond itself.
So if you want to take a bet that the rate hikes came to an end the price is at its support so you may want to build a long position.
If you think that the economic dataflow also supports the FED’s idea of two more rate hikes you may want to be short on TLT as it breaks down.
The above weekly chart formed an approximately 7-month-long Rectangle chart pattern, with resistance at 109.61 levels and support at 99.35 levels.
A daily close above or below resistance and support levels respectively would validate the breakout from the 7-month-long Rectangle chart pattern.
This breakout could potentially result in either a chart pattern target of 121.41 levels or 90.3 levels.
TUR - Long Idea
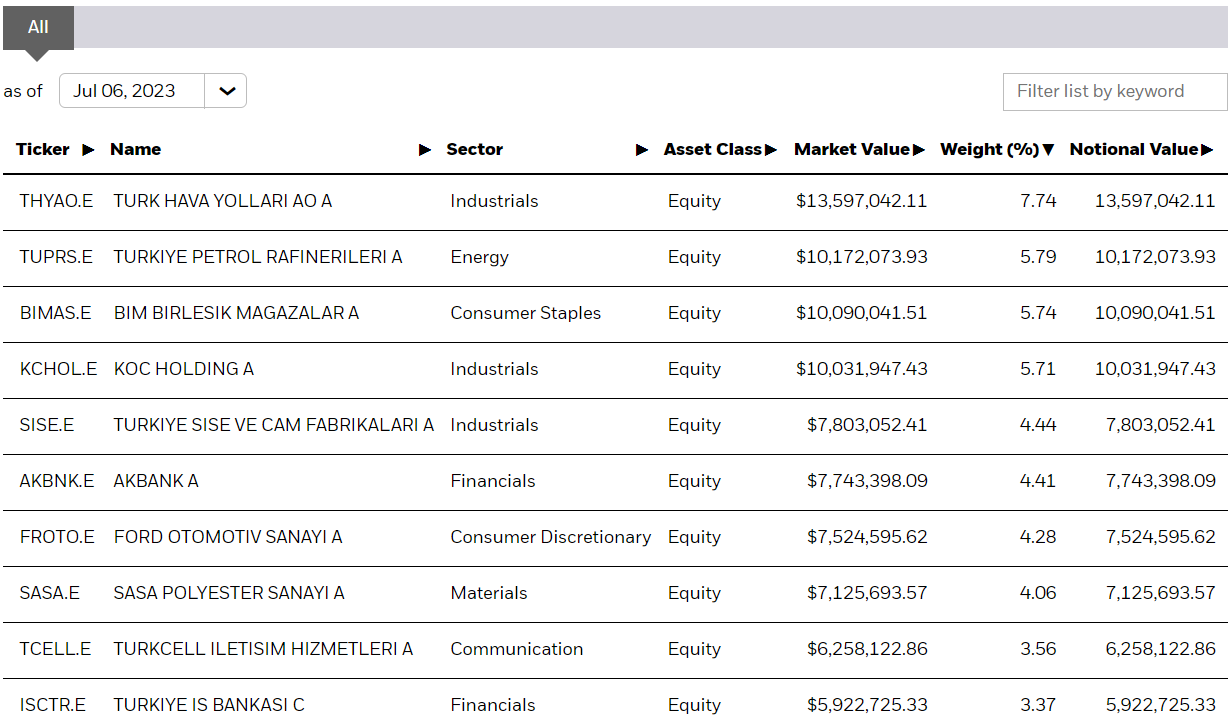
The MSCI Turkey Investable Market Index ETF. Components,

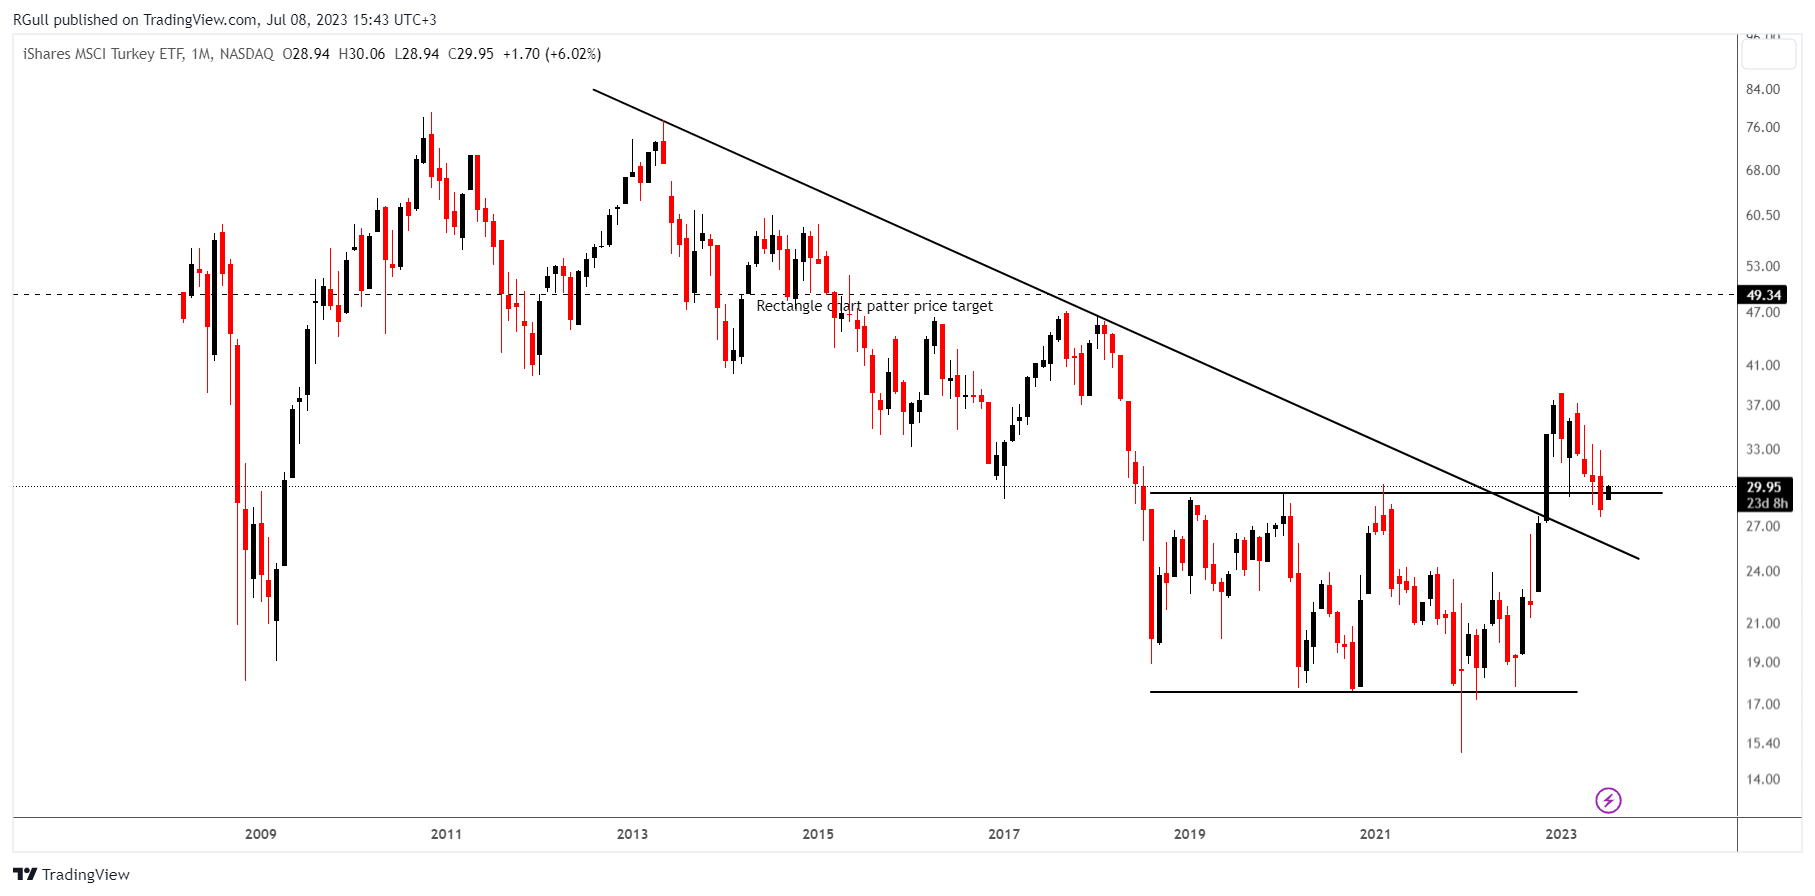
The above monthly chart formed an approximately 4-years-long Rectangle chart pattern as a bullish reversal after a downtrend, with resistance at 29.42 levels.
Nov 2022 bar already broke up and it confirmed. Now the chart allows for being long while the price is pulled back to the resistance of the chart pattern.
Turkey’s transition period to orthodox policies might be painful in terms of the exchange rate since the “capital controls” are being withdrawn. Domestically the stock market is considered a hedging instrument against exchange rate depreciation, especially the exporter companies.
Also with the upcoming normalization path, foreign investors might be willing to invest as long as they can hedge themselves against currency risks with the proper derivatives instruments.
This breakout could potentially result in a chart pattern target of 49.34 levels.
JPM - Long Idea
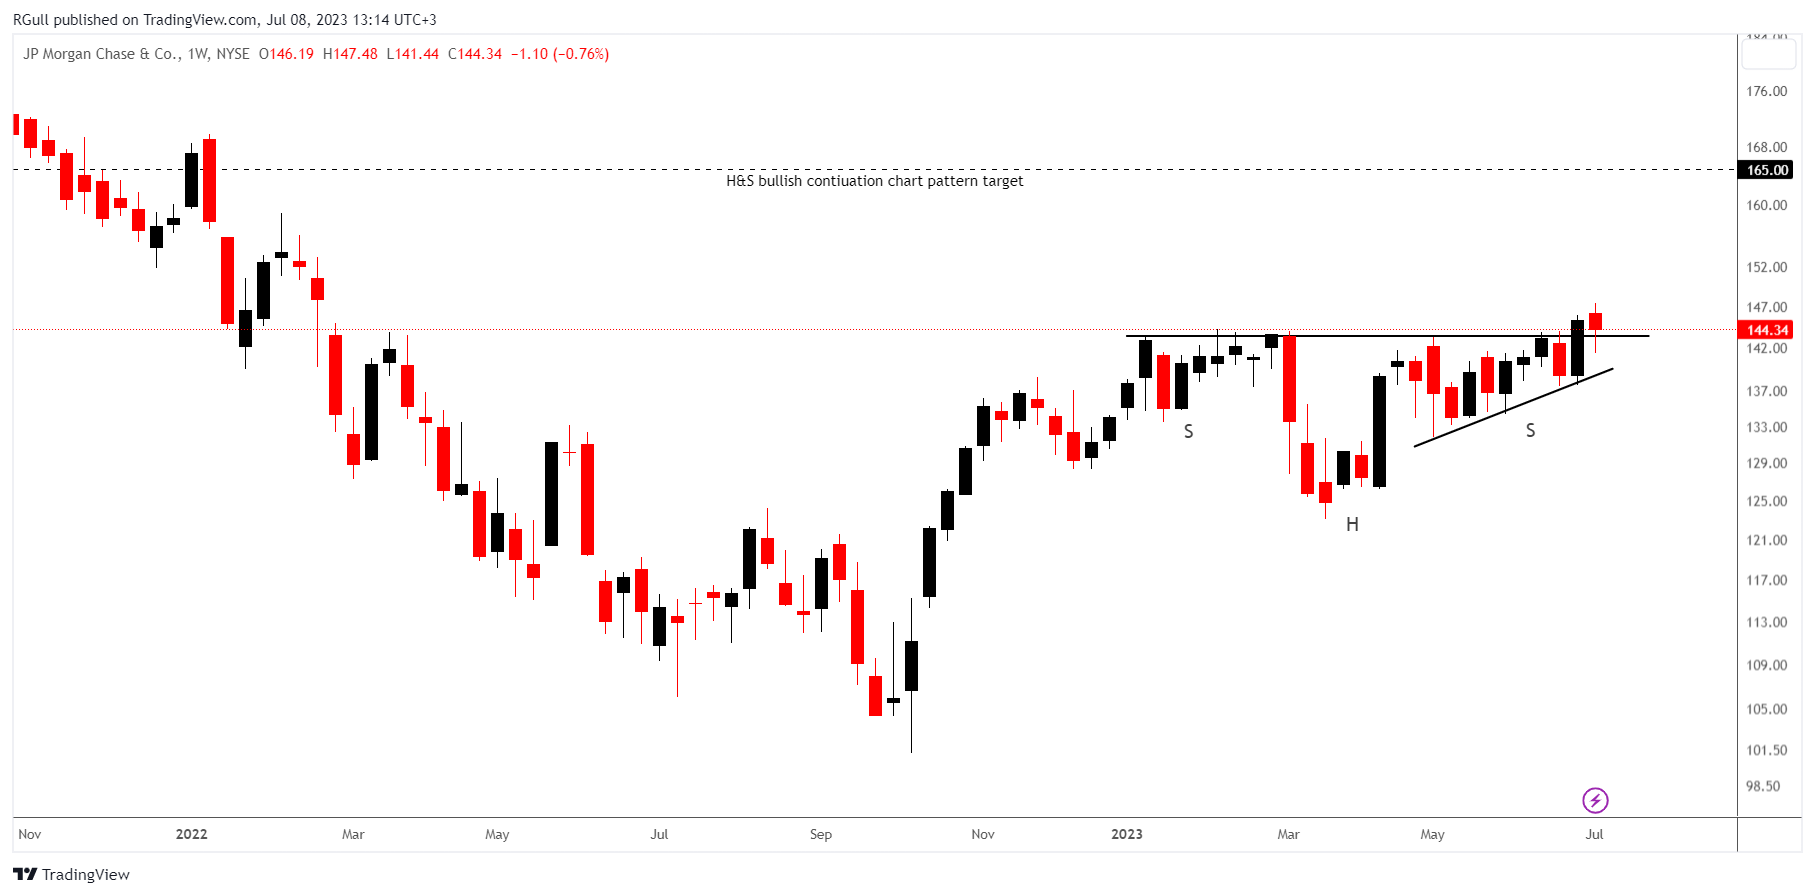
JPMorgan Chase & Co is a financial services firm and a banking institution. It is engaged in investment banking, commercial banking, treasury and securities services, asset management, retail financial services, and credit card businesses.
The above weekly chart formed an approximately 5-month-long H&S chart pattern as a bullish continuation after an uptrend, with resistance at 143.5 levels.
A daily close above 147.8 levels would validate the breakout from the 1-year-long Rectangle chart pattern.
This breakout could potentially result in a chart pattern target of 165 levels.
The breakout might not be that powerful if you strictly apply the 3% breakout rule. It might act as a fake breakout. That is why depending on your risk aversion maybe waiting for a better daily close fits better for you.
If you believe a sector rotation might take place in US equities, JPM long idea would be in line with this mindset.
Since the beginning of 2023, the financial sector has lagged compared to the big “FAANG” or our new rhetoric “Magnificent 7”.
So if you believe that we are close to the end of the tightening cycle and the recession would be light, expecting a catch-up from lagged sectors is sensible.
The value and growth stocks narrative might be changing in the upcoming years as tech products become a need rather than a luxury. Having a Netflix membership has become as important as having cleaning supplies.
In general, we would expect the consumer staples sector to outperform the consumer discretionary sector in a tightening cycle but it happened vice versa in the mid of the longest and most aggressive tightening period of history.
SEIC - Long Idea
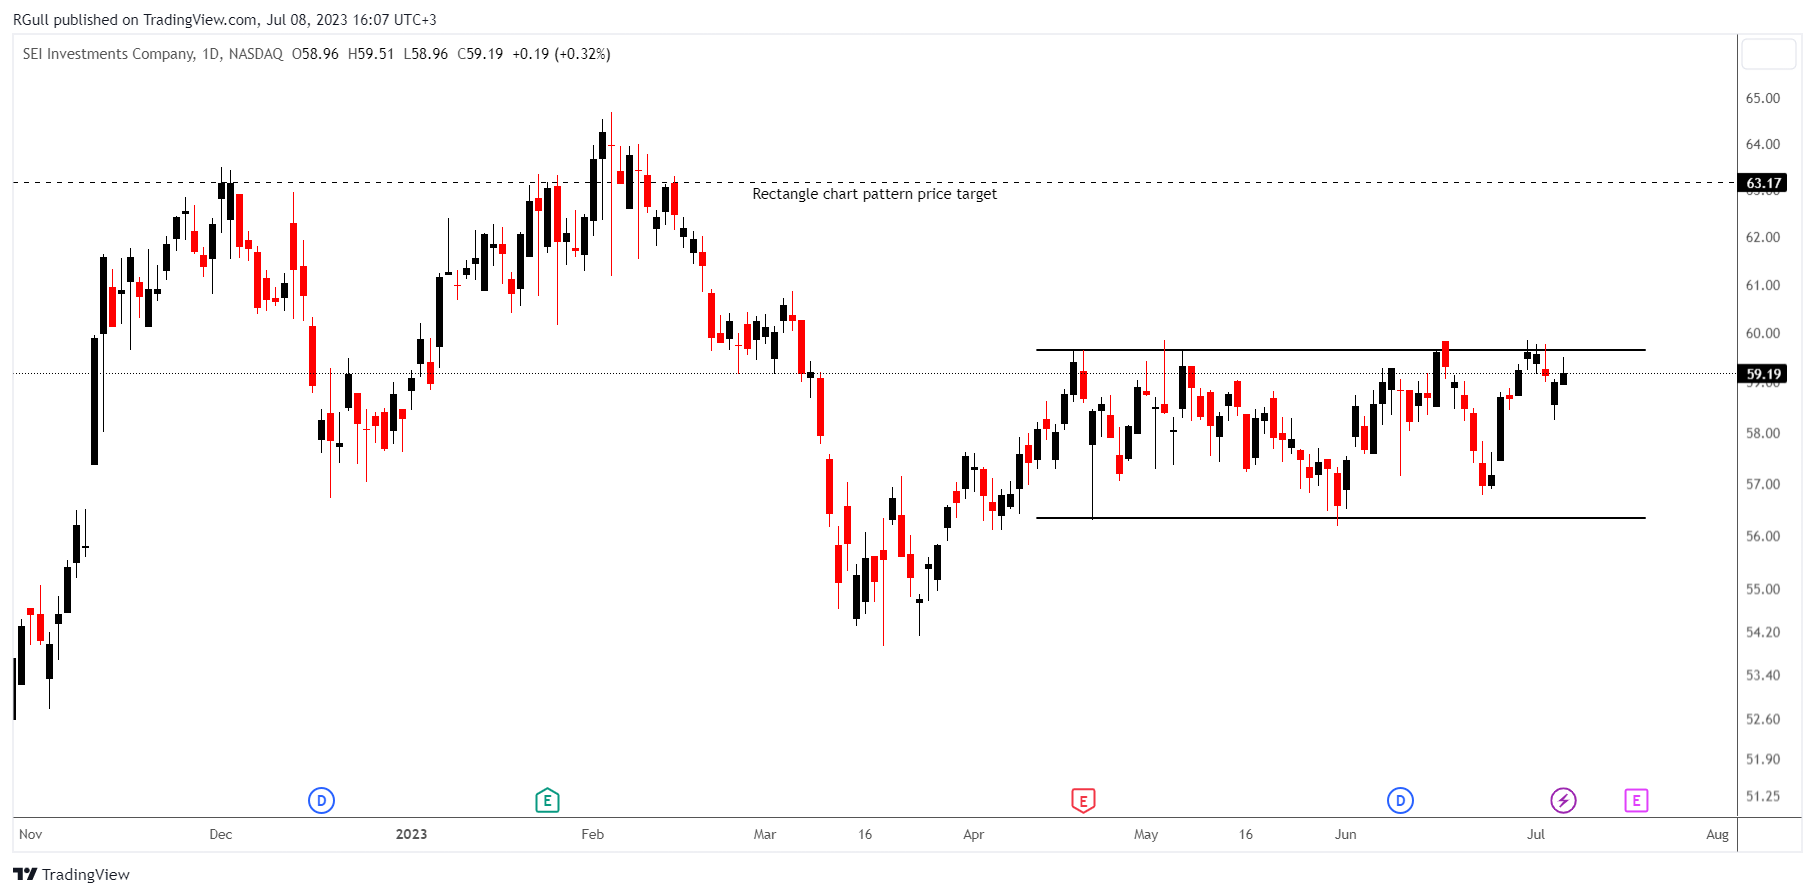
SEI Investments Co is an asset management firm. It caters to financial advisors and investors with investment management activities.
The same rationale applies to SEIC as to JPM since both of them are in the financial sector.
The above daily chart formed an approximately 3-month-long Rectangle chart pattern as a bullish continuation after an uptrend, with resistance at 59.65 levels.
TRIN - Long Idea
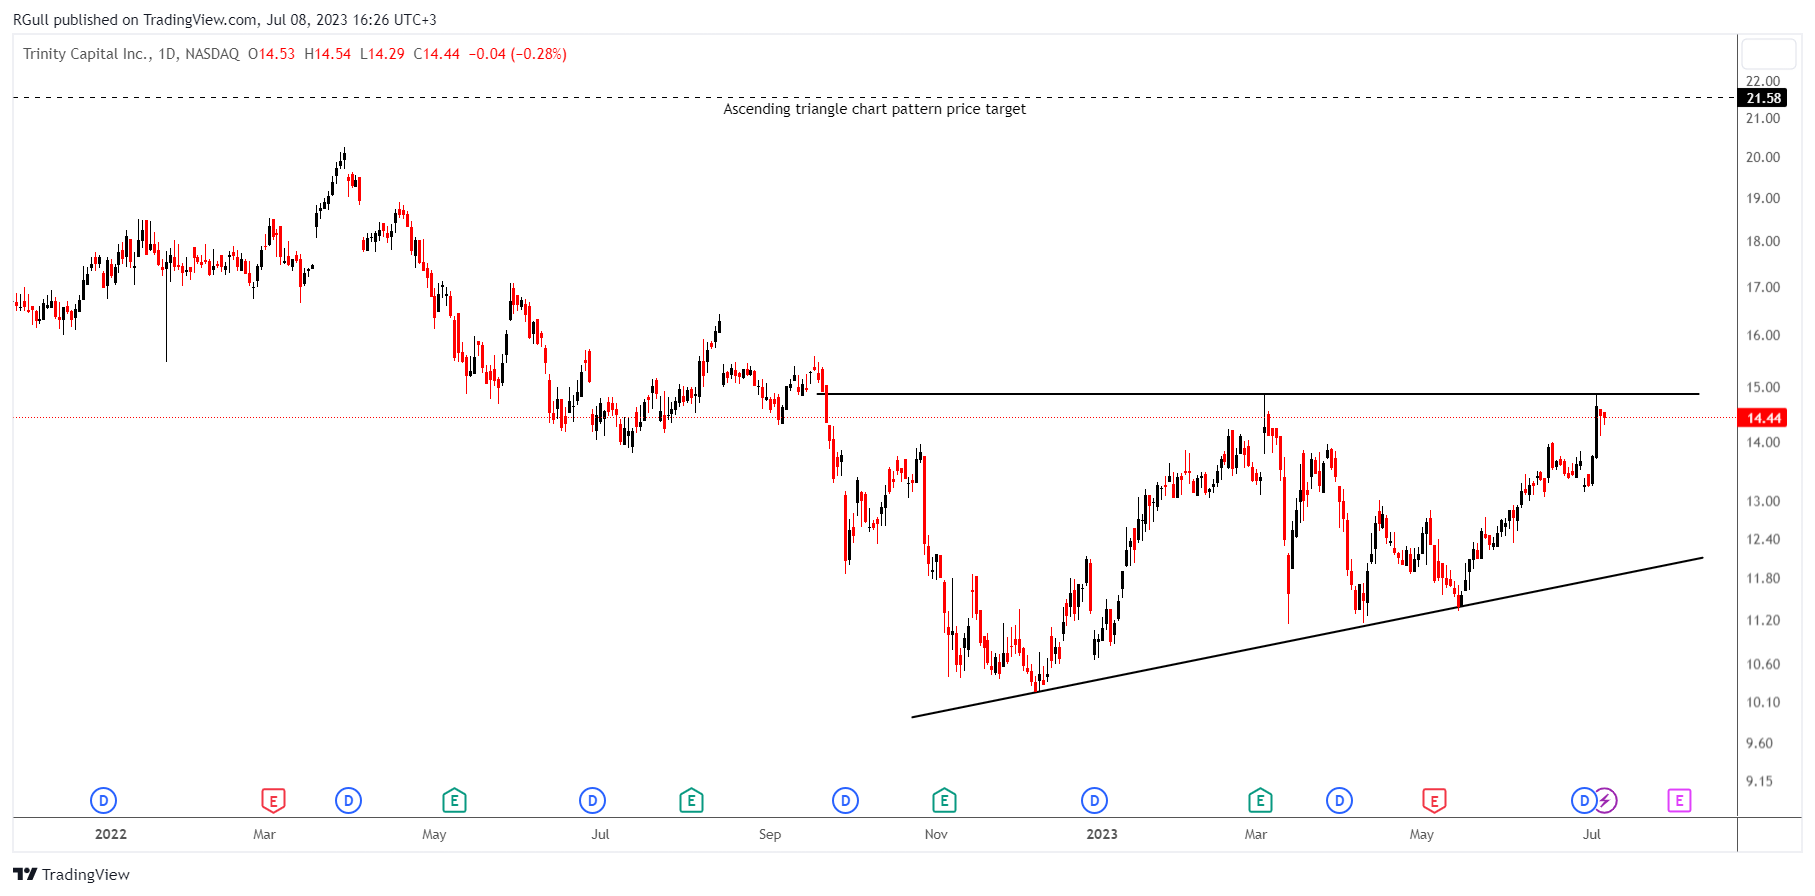
Trinity, an internally managed specialty lending company that has elected to be regulated as a BDC under the Investment Company Act of 1940, is a leading provider of debt and equipment financing to growth-stage companies, including venture-backed companies and companies with institutional equity investors.
The above weekly chart formed an approximately 7-month-long Ascending triangle chart pattern as a bullish reversal after a downtrend, with resistance at 14.87 levels.
A daily close above 15.31 levels would validate the breakout from the 7-month-long Ascending triangle chart pattern.
This breakout could potentially result in a chart pattern target of 21.58 levels.
Another candidate from the finance sector.
AVAXUSDT- Long Idea
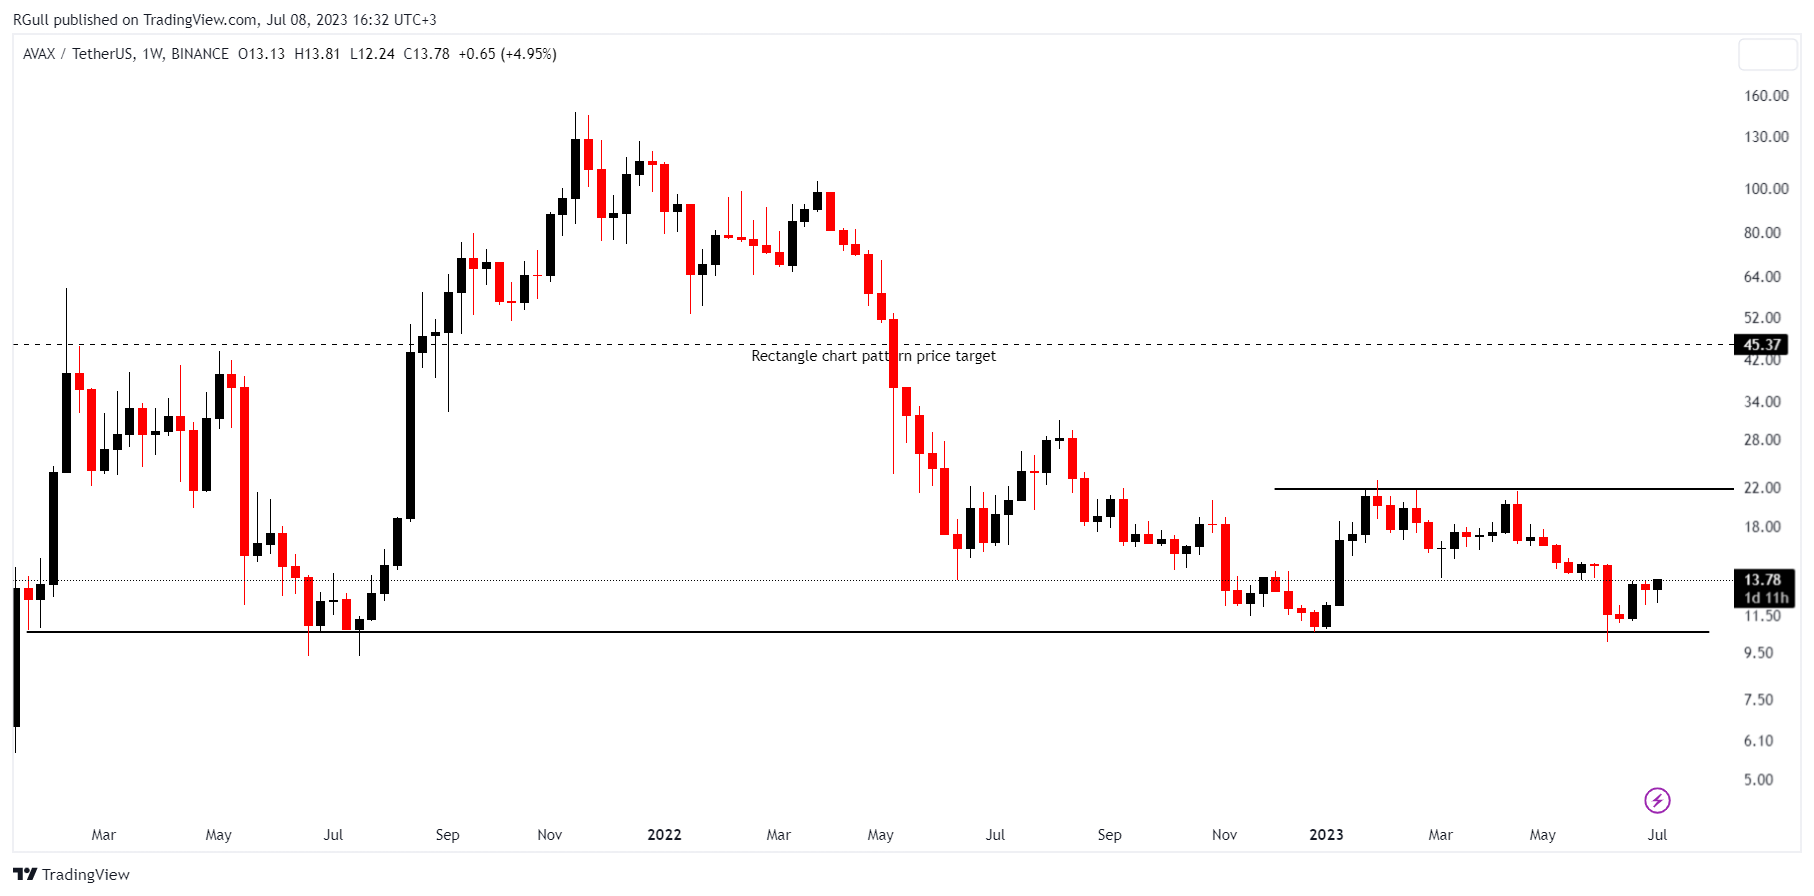
The above weekly chart formed an approximately 6-month-long Rectangle chart pattern as a bullish reversal after a downtrend, with resistance at 21.72 levels.
A daily close above 22.37 levels would validate the breakout from the 6-month-long Rectangle chart pattern.
This breakout could potentially result in a chart pattern target of 45.37 levels.
AVAX has been one of the most hit during the most aggressive times of the bear market. Therefore we might expect AVAX to outperform the market in case of a bull market. I think 10.56 support is a very crucial level to monitor. At the same time, it could be a sensible level for position building.
SOLUSDT- Long Idea
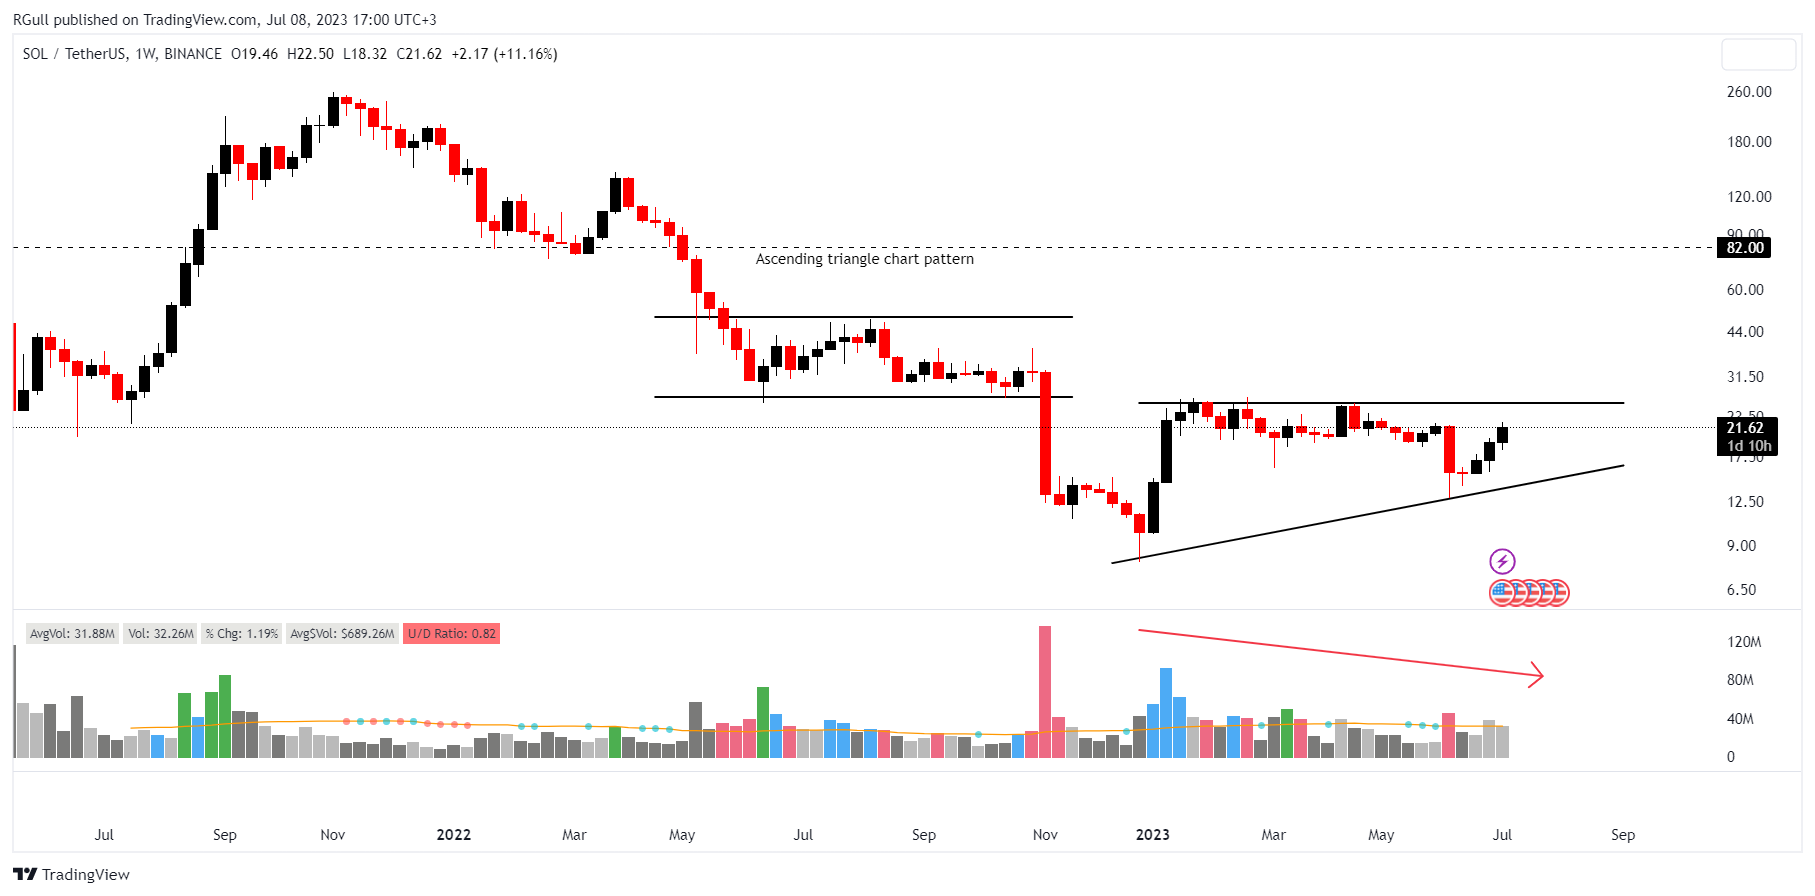
The above weekly chart formed an approximately 6-month-long Ascending triangle chart pattern as a bullish reversal after a downtrend, with resistance at 25.95 levels.
A daily close above 26,72 levels would validate the breakout from the 6-month-long Ascending triangle chart pattern.
This breakout could potentially result in a chart pattern target of 82 levels.
I would like to see more volume contraction(marked by an arrow in the graph) as we get closer to the end of the base. That would indicate that the lesser supply coming to the market.
SOLANA has also been one of the most hit during the most aggressive times of the bear market. Therefore we might expect SOLANA to outperform the market in case of a bull market as well.
Follow-ups
GBPUSD - Long Idea
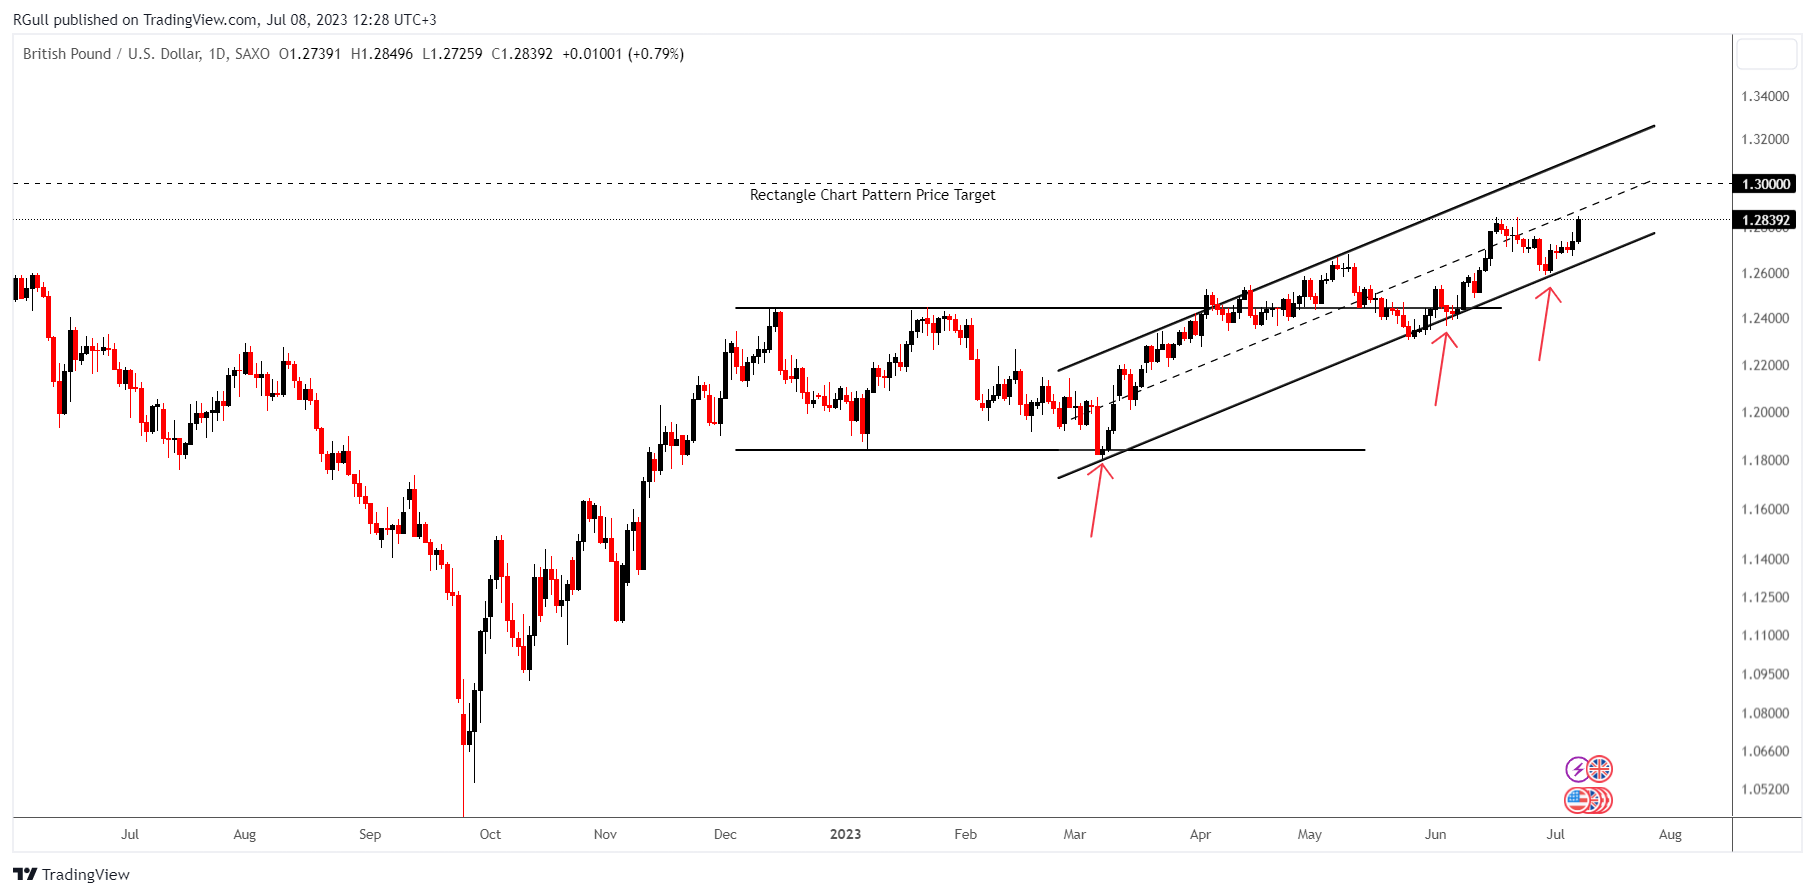
You can click on the GBPUSD ticker above to access the first report explaining the RATIONALE behind the trade idea.
If we compare central banks in general, although it is said that the FED may raise 2 more interest rates, the tightening path in the UK and Europe seems longer. Both in terms of data and rhetoric. That is why any occasion that comes technically pro-GBP or EUR against USD might still be a sensible trade idea.
In addition to the rectangle chart pattern, you can see the higher lows acting as a noticeable resistance. The breakout of the mid-channel would also be the breakout of the previous high.
HPQ - Long Idea

You can click on the HPQ ticker above to access the first report explaining the RATIONALE behind the trade idea.
Since the weekly close is at the resistance of the ascending triangle chart pattern, it is worth keeping an eye on it and moving it from the watchlist to the focus list.
NXPI - Long Ide
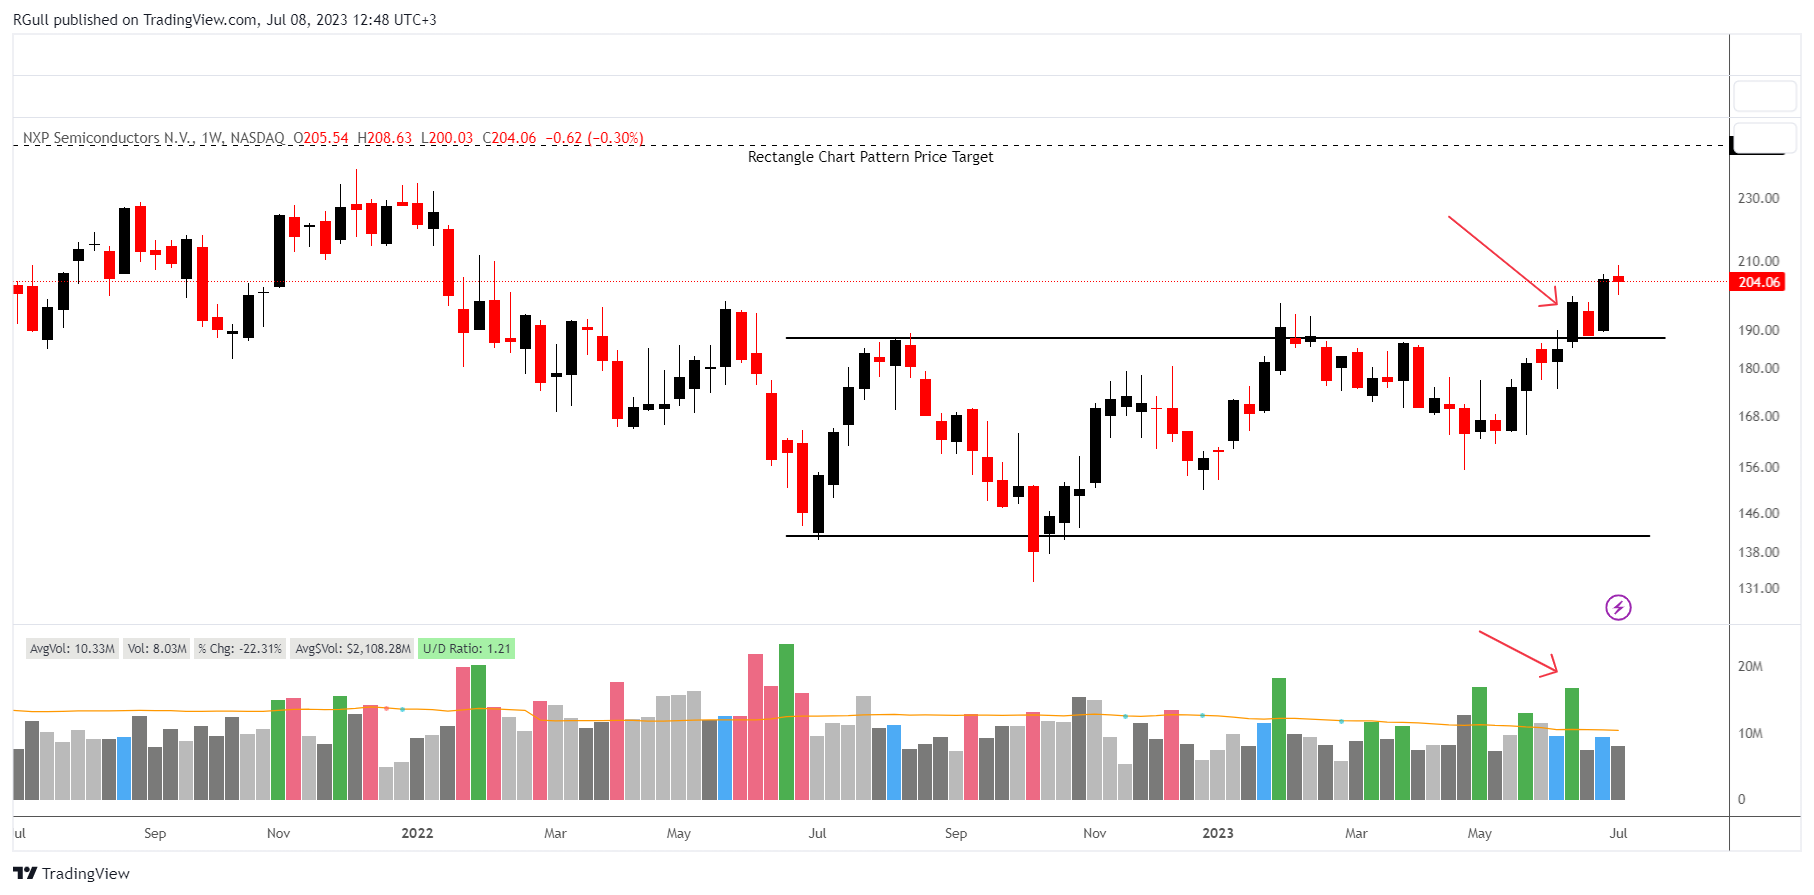
You can click on the NXPI ticker above to access the first report explaining the RATIONALE behind the trade idea.
I liked the way it broke out the rectangle chart pattern since it came with a considerable volume. I always try to trace the institutional entries on equities and the high volume following the low volume is one way to catch it.
You can see in the above graph that the weekly bar of 12/06 which is also the breakout bar comes with higher than average volume.
BTCUSDT - Long Idea
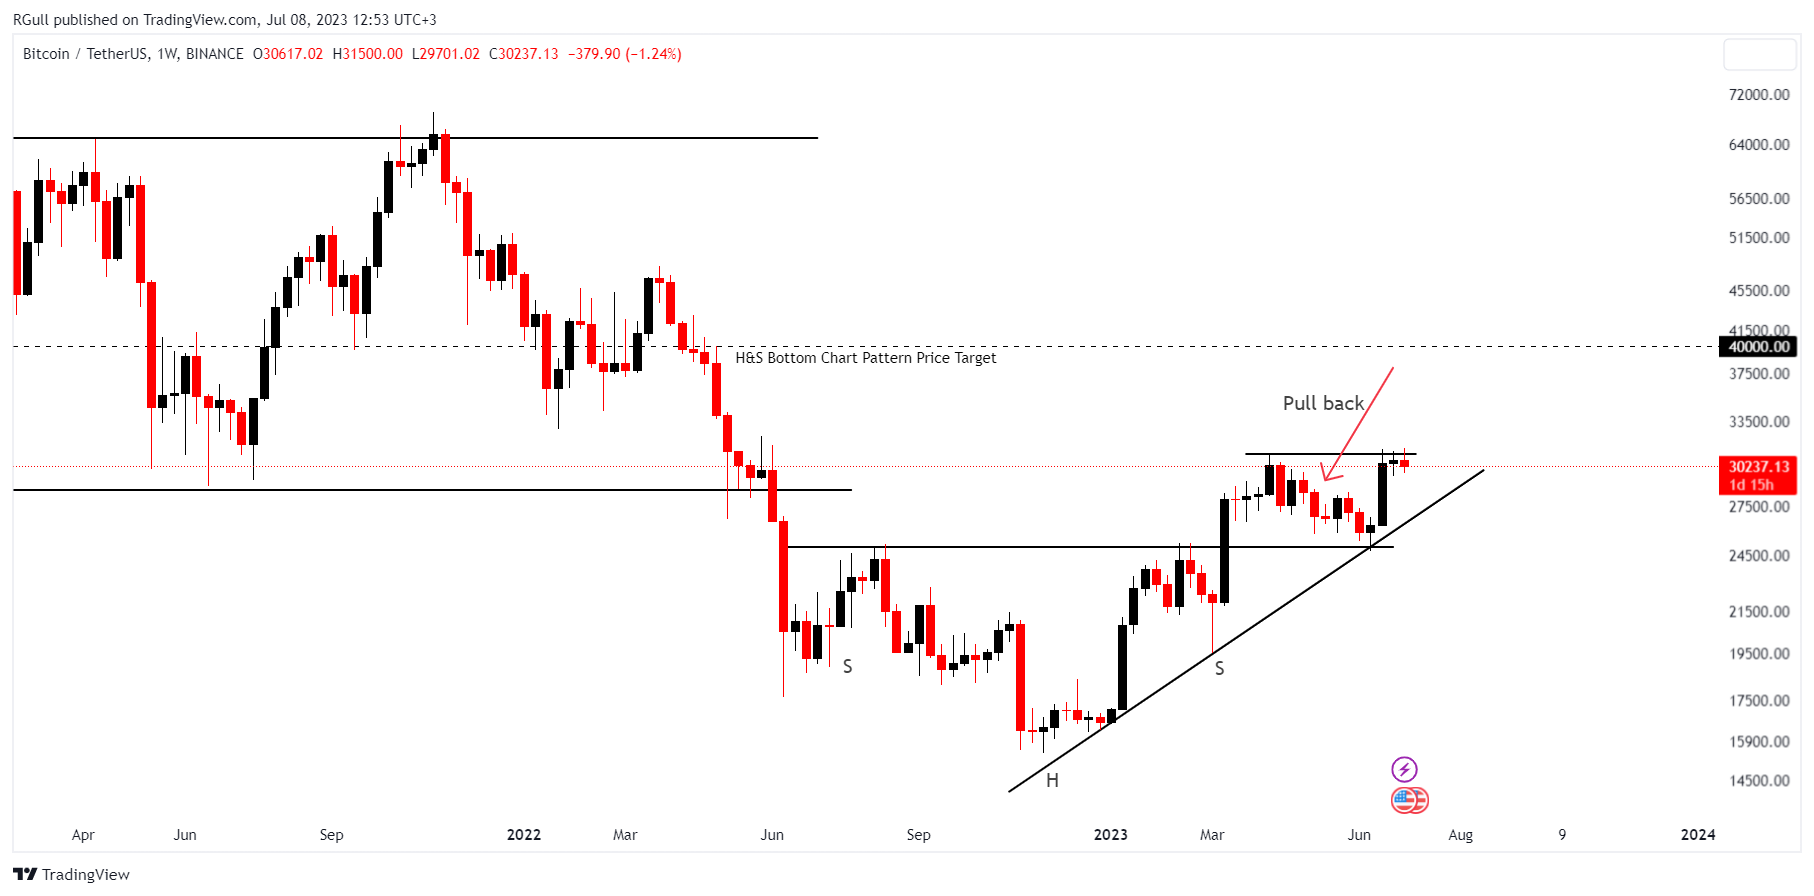
You can click on the BTCUSDT ticker above to access the first report explaining the RATIONALE behind the trade idea.
BTCUSDT signal was given two times, one at the breakout of the H&S bottom chart pattern and the second one at the resistance of the chart pattern when the price pulled back.
Apart from the H&S chart patterns’ resistance the higher lows have also provided buying opportunities.
Only the average hourly earnings data that we received on 07/07 seems concerning to me for the risky assets since it is still signaling wage inflation. FED has mentioned a couple of times that they will be so cautious about wage-price spiral risks. Considering their plan to hike rates two more times, trading with a proper risk management plan in cryptos is very crucial. Please do not forget that STOP-LOSS is our friend !!