

TRADE IDEAS
New setups
EURGBP - Long Idea
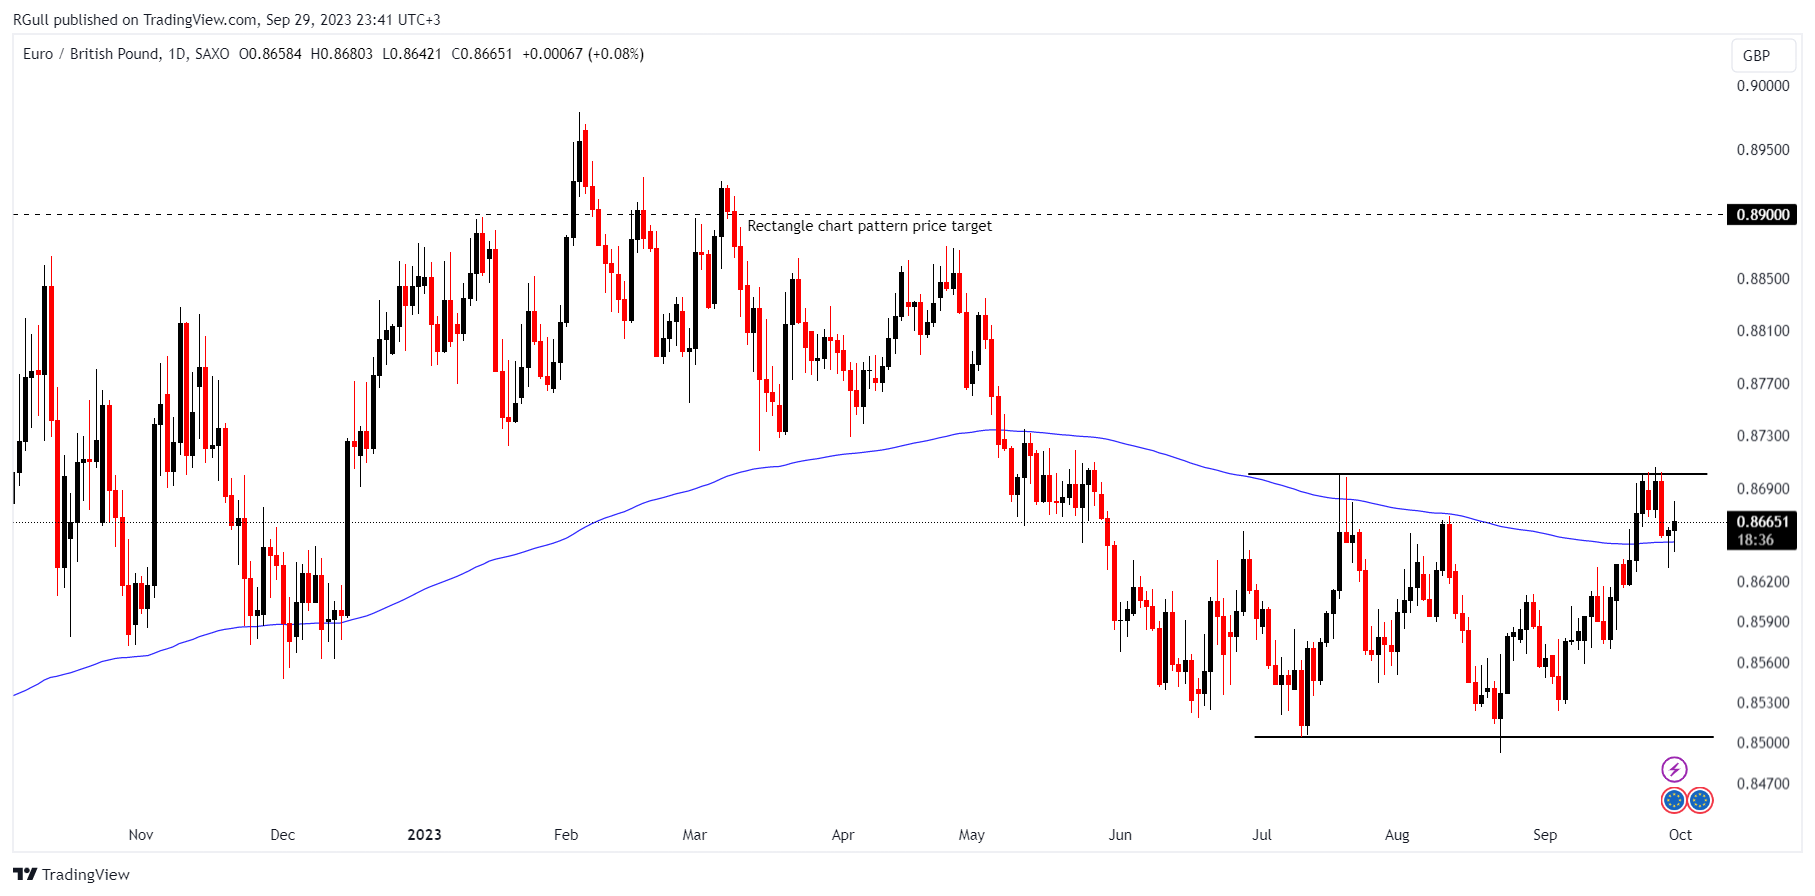
The above daily chart formed an approximately 3-month-long Rectangle chart pattern as a bullish reversal after a downtrend, with resistance at 0.87 levels.
Such price action is also a confirmation that the price is holding above the 200-day EMA.
This breakdown could potentially result in a chart pattern target of 0.89 levels.
Quantitative Tightening (QT)
The Bank of England (BOE) plans to reduce its holdings of UK government bonds by £100 billion over the next year.
Higher for Longer Policy
The BOE is inclined to maintain high-interest rates for an extended period rather than pursuing aggressive short-term rate hikes.
Housing Market Impact
Rate hikes implemented by the BOE will gradually affect the UK mortgage market.
Existing mortgage rates have increased from 2% in 2022 to approximately 3% currently.
The pressure from the housing market, coupled with QT and the higher-for-longer approach, is expected to tighten the UK economy. These challenging economic conditions could lead to a deep recession or a significant adverse event.
In summary, the BOE's quantitative tightening, commitment to keeping rates higher for an extended period, and the impact on the housing market are contributing to economic pressures, raising concerns about the potential need for a change in monetary policy in the future.
In an environment where the monetary policy shift is being priced, we would expect to see a weaker GBP.
CADCHF - Long Idea
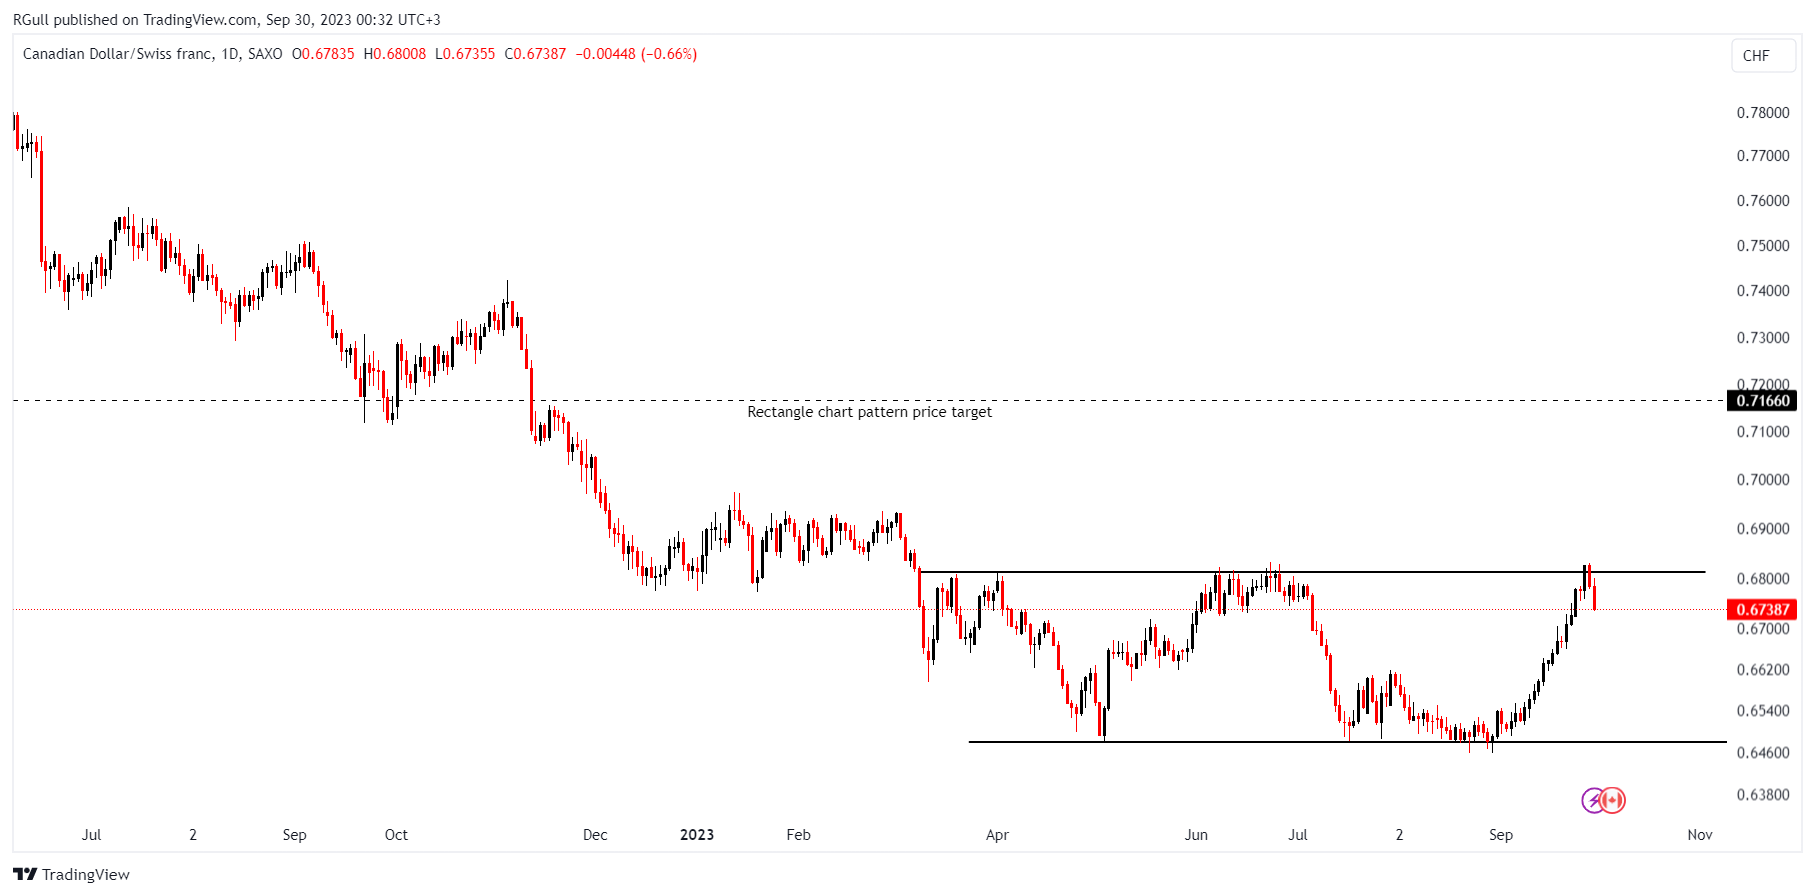
The above daily chart formed an approximately 5-month-long Rectangle chart pattern as a bullish reversal after a downtrend, with resistance at 0.681 levels.
A daily close above 0.688 levels would validate the breakout from the 5-month-long Rectangle chart pattern.
This breakout could potentially result in a chart pattern target of 0.7166 levels.
It’s a well-known phenomenon that the Loonie(CAD) is highly correlated with the oil price due to Canada`s position of being an oil exporter.
The same applies to the relationship between CHF and Gold.
So being a long in CADCHF is as same as asserting that the oil price will overperform the gold price in the near future.
The `OIL /GOLD` ratio is considered a global growth indicator. If the global economy is resilient, the market will demand more oil to spend on production and vice versa.
So CAD/CHF might be considered as a `growth or recession play` with the only exception that the oil price is currently driven by supply-side factors(war, Russia/Saudi Arabia production cut) rather than the demand factors.
The `higher for longer` rhetoric is affecting negatively the gold price so that is a positive sign for this trade but I am wondering if the oil price can go above 100$.
WDC - Long Idea
Western Digital Corp is the global leader in the hard disk drive market. It develops, manufactures, and provides data storage solutions that enable consumers to create, manage, experience, and preserve digital content. Its products include HDDs and SSDs.
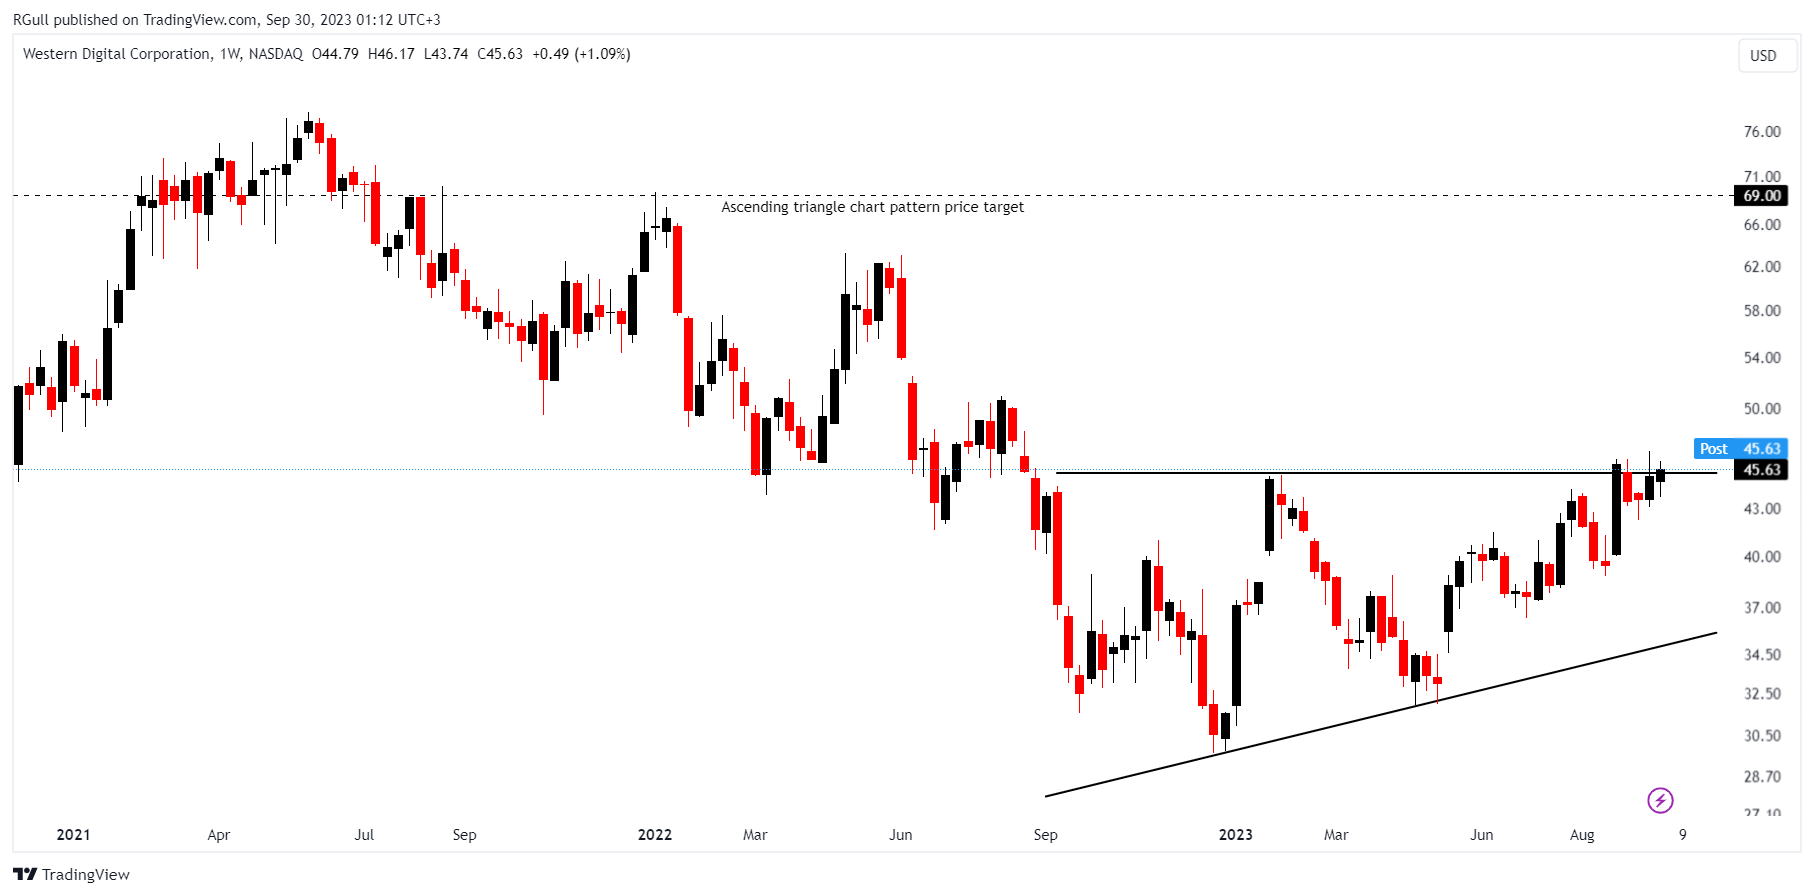
The above weekly chart formed an approximately 9-month-long Ascending triangle chart pattern as a bullish reversal after a downtrend, with resistance at 45.25 levels.
A daily close above 46.6 levels would validate the breakout from the 9-month-long Ascending triangle chart pattern.
This breakout could potentially result in a chart pattern target of 69 levels.
The company`s interest in merging with Kioxia, a Japanese-based firm might be a supportive factor.
The GICS sector classification of the company is `information technology` which generally performs weakly during high-rate environments. However, from a technical perspective, treating each graph by its merit might work better.
KBH- Short Idea
KB Home operates as a homebuilding company in the United States. It builds and sells various homes, including attached and detached single-family residential homes, townhomes, and condominiums primarily for first-time, first-move-up, and active adult homebuyers.
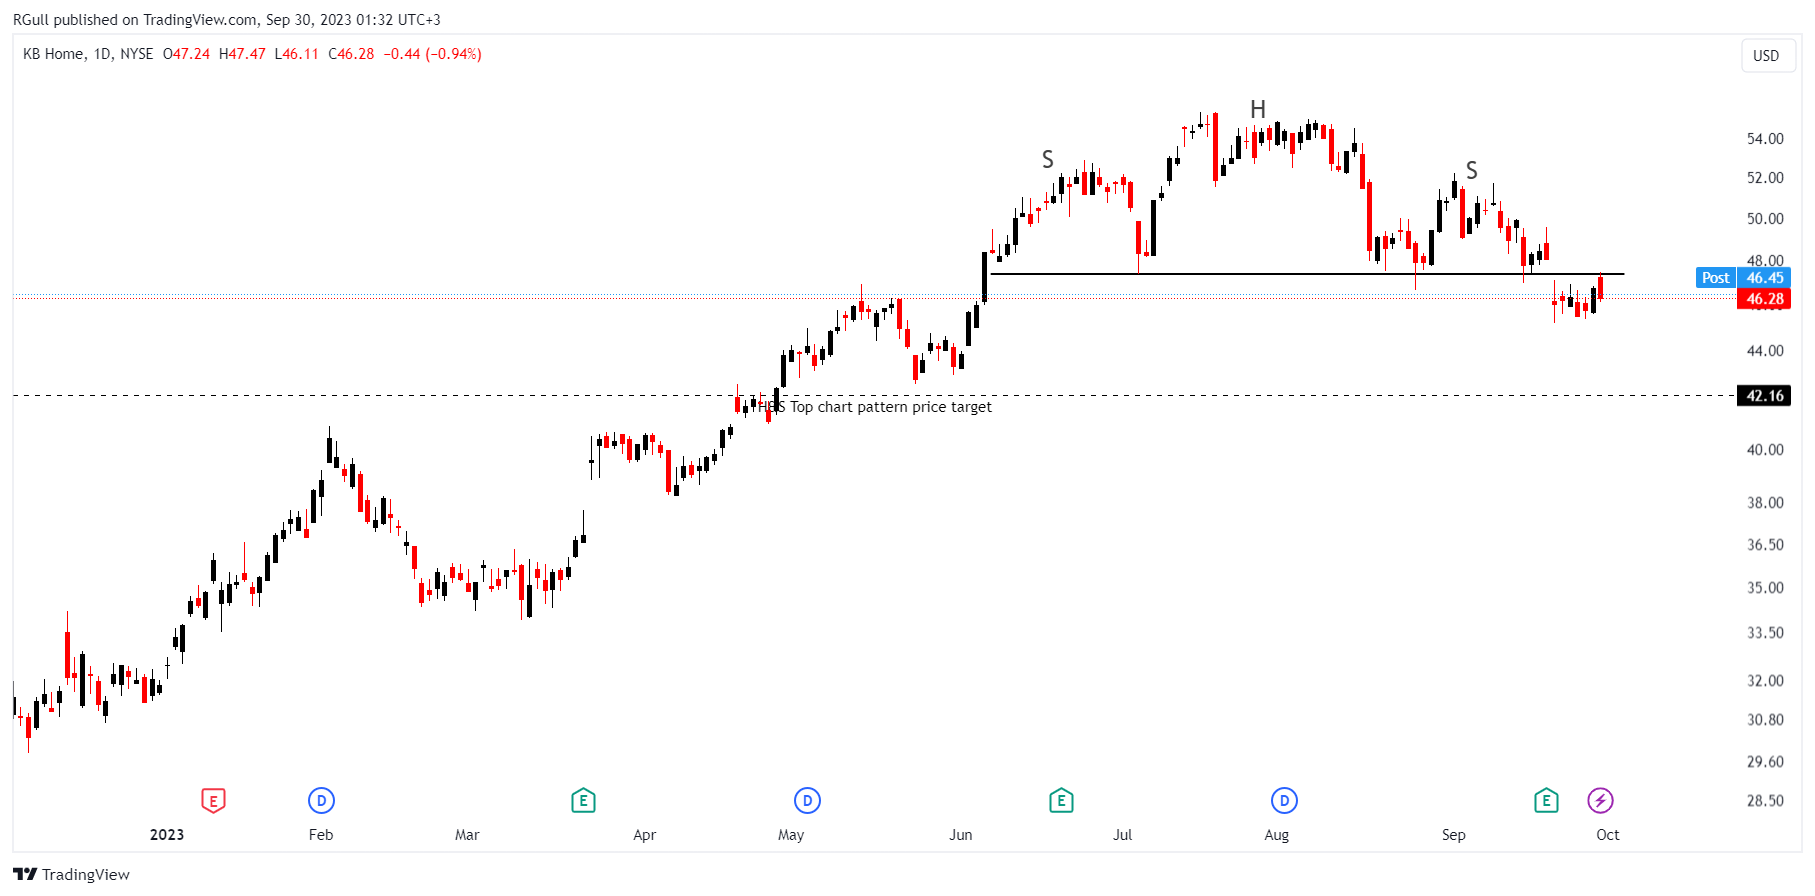
The above daily chart formed an approximately 3-month-long H&S Top chart pattern as a bearish reversal after an uptrend, with support at 47.37 levels.
A daily close below 46 levels validated the breakout from the 3-month-long H&S Top chart pattern then the price pulled back to the old support and the new resistance.
This breakout could potentially result in a chart pattern target of 42.15 levels.
The housing construction sector surprisingly has been one of the top-performing segments in the stock market in 2023 because of the increased mortgage rates, which have caused a shortage of available houses for sale and a growing demand for new construction.
Nonetheless, the Federal Reserve's possible inclination to implement more aggressive interest rate increases could eventually have an adverse effect on the housing construction industry.
GE- Long/Short Idea
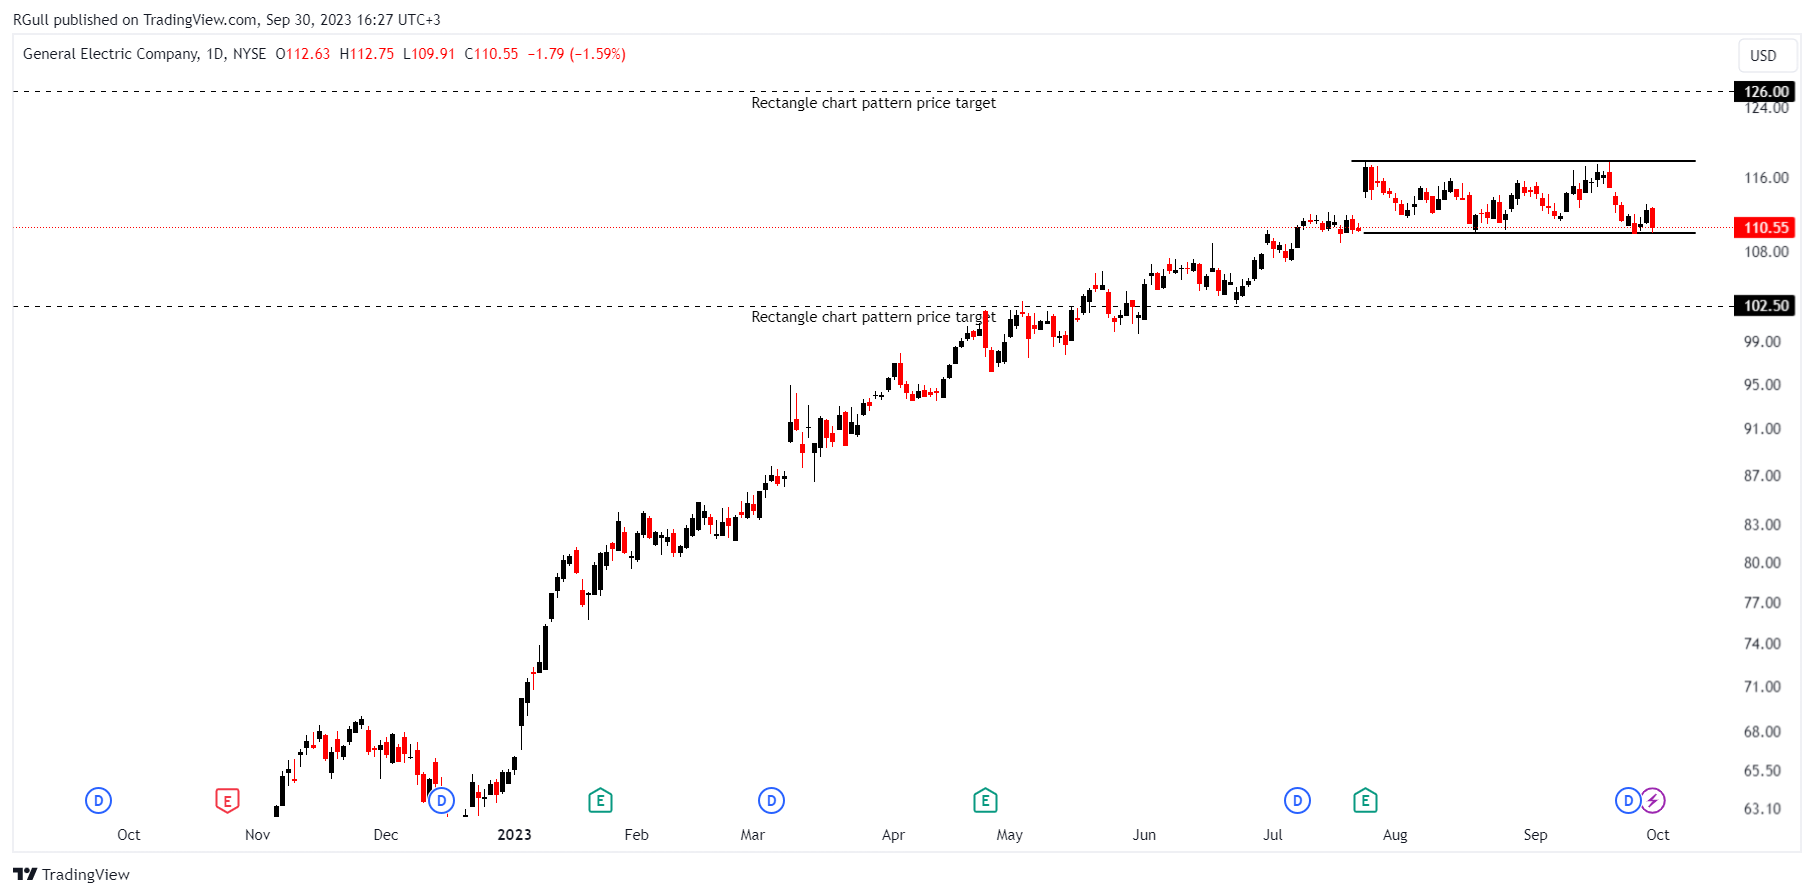
General Electric Co. is a digital industrial company. It operates in various segments, including power and water, oil and gas, energy management, aviation, healthcare, transportation, appliances and lighting, and more.
The GICS sector classification of the company is `industrials` which generally performs weakly during high-rate environments.
The above weekly chart formed an approximately 2-month-long Rectangle chart pattern, with resistance at 117.75 and support at 109.9 levels.
This breakdown could potentially result in a chart pattern target of 102.5 levels. If it breaks out, it could potentially result in a chart pattern target of 126 levels.
SOLUSDT - Long Idea
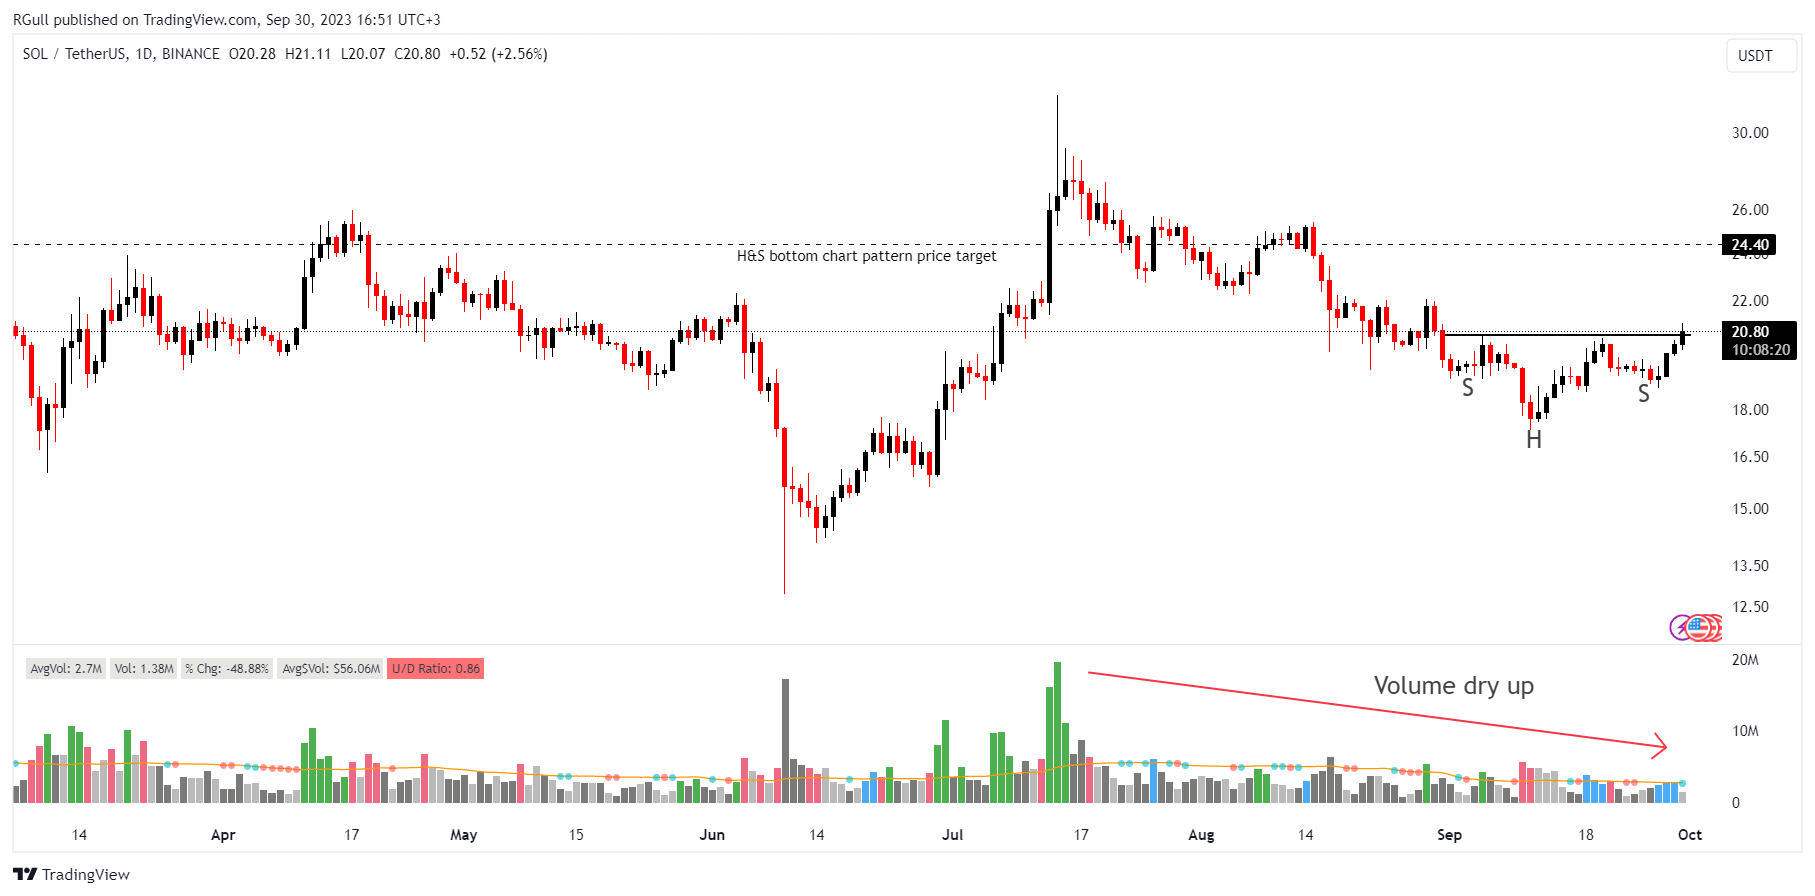
The above daily chart formed an approximately 1-month-long H&S bottom chart pattern as a bullish reversal after a downtrend, with resistance at 20.65 levels.
I generally prefer minimum 2 month month-long chart patterns but the volume dry-up in SOLUSDT caught my attention because volume tends to be cyclical and breakout with a high volume after a low volume works well.
A daily close above 21.25 levels would validate the breakout from the H&S bottom chart pattern.
This breakout could potentially result in a chart pattern target of 24.4 levels.
Follow-ups
FDAX1! - Short Idea
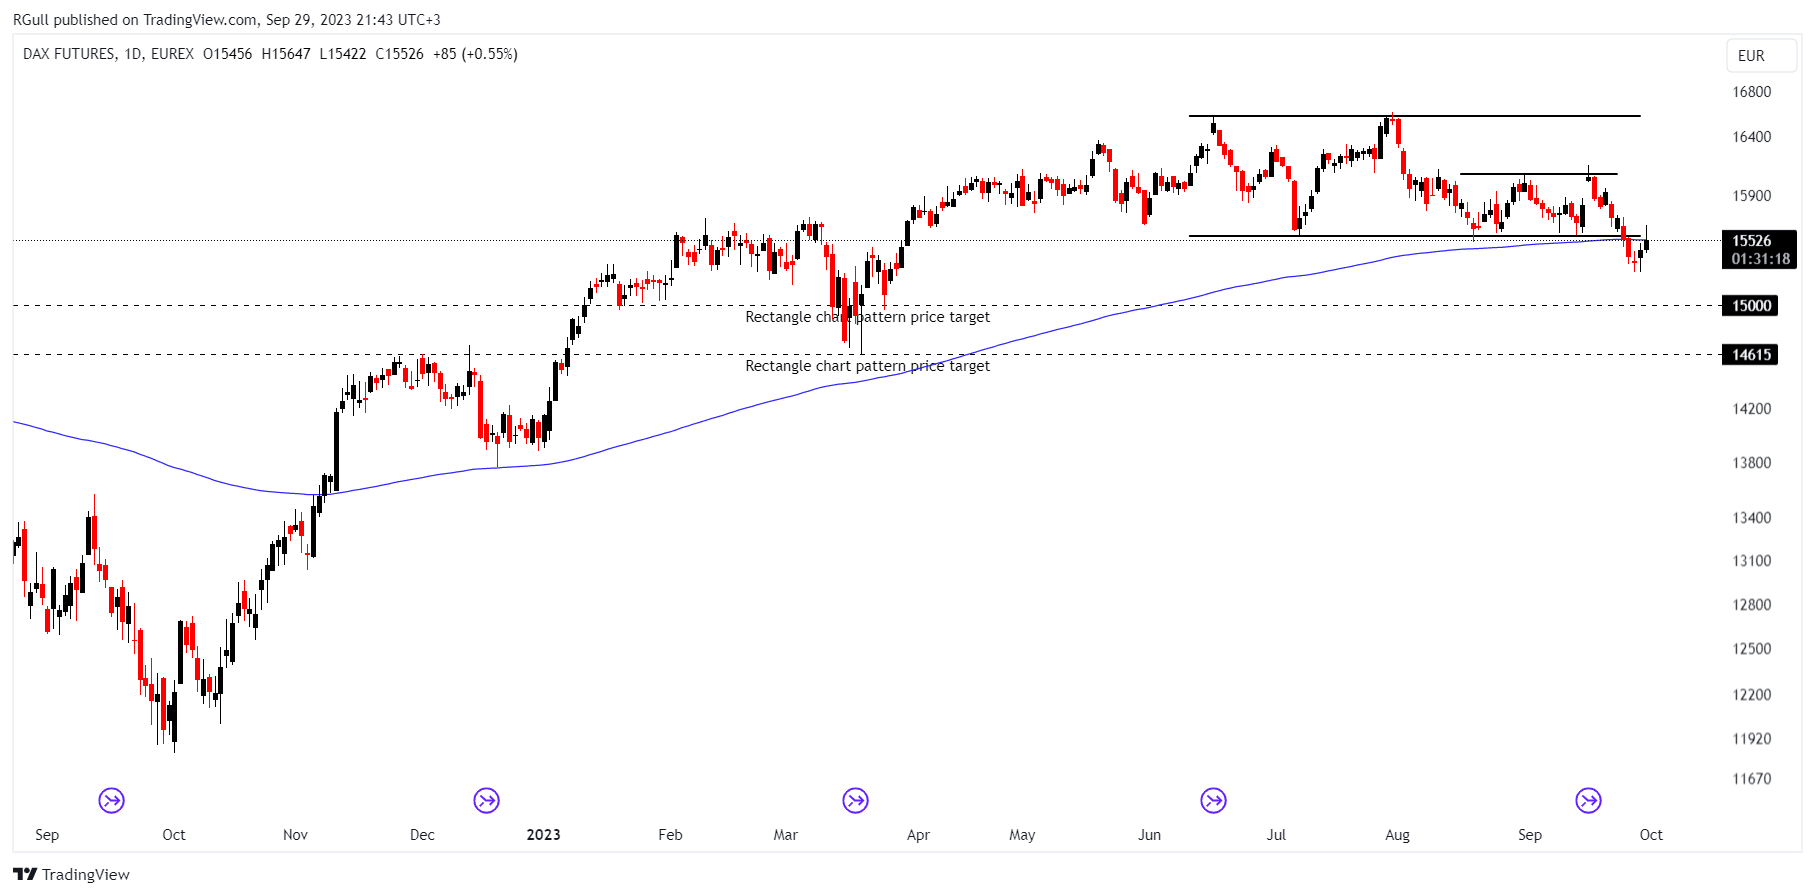
You can click on the FDAX1! ticker above to access the first report explaining the RATIONALE behind the trade idea.
The above daily chart formed an approximately 3-month-long Rectangle chart pattern as a bearish reversal after an uptrend, with support at 15560 levels.
A daily close below 15400 levels would validate the breakdown from the 3-month-long Rectangle chart pattern. The price broke down below the 200-day EMA which is my filter for entering short positions.
This breakdown could potentially result in a chart pattern target of 14615 levels.
Considering the stagflation structure of the euro area, being short at DAX seems sensible. 30/08 German CPI data would be influential on this trade idea.
Since the rising oil prices increase the cost of production, we may see further risks to Euro area growth.
Despite the ECB`s recent comments on reaching the restrictive level of rates, FED seemed cautious about stopping the rate hikes. Since then we have seen a negative pricing global indices.
ETHUSDT - Long Idea
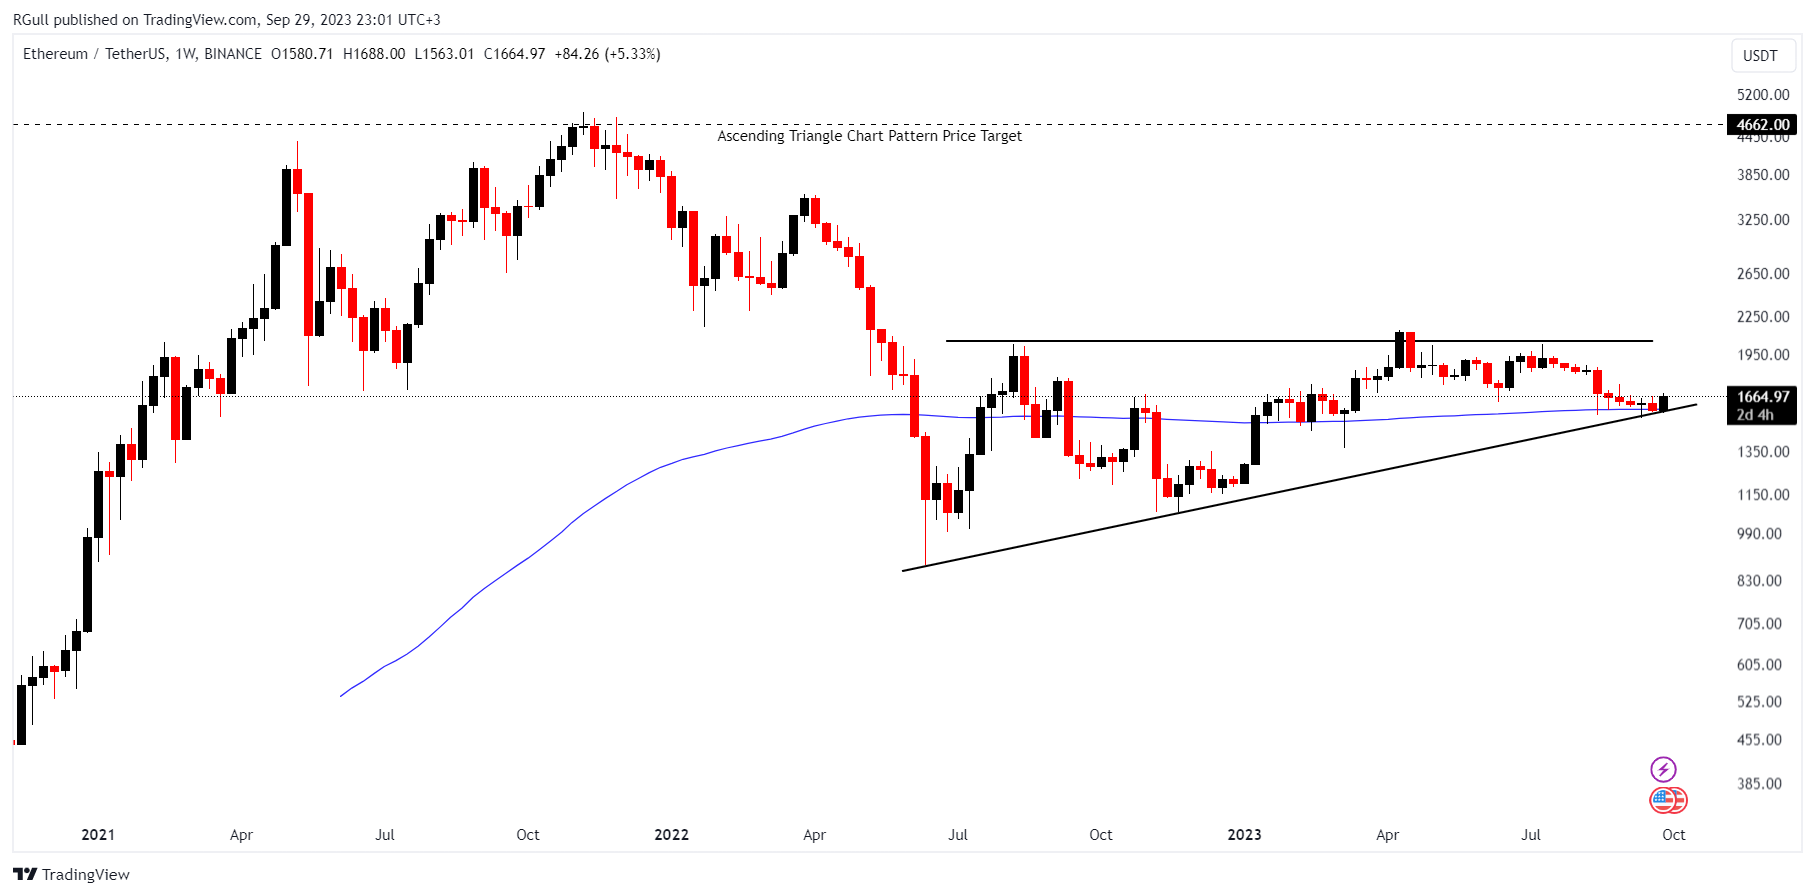
You can click on the ETHUSDT ticker above to access the first report explaining the RATIONALE behind the trade idea.
The above weekly chart formed an approximately 14-month-long Ascending triangle chart pattern as a bullish reversal after a downtrend, with resistance at 2250 levels.
A daily close above 2110 levels would validate the breakout from the 14-month-long Ascending triangle chart pattern.
ETHUSDT is trying to hold at its higher low. I'd like to see a bullish weekly candle to be convinced on the resume of the price action.
TLT- Short Idea
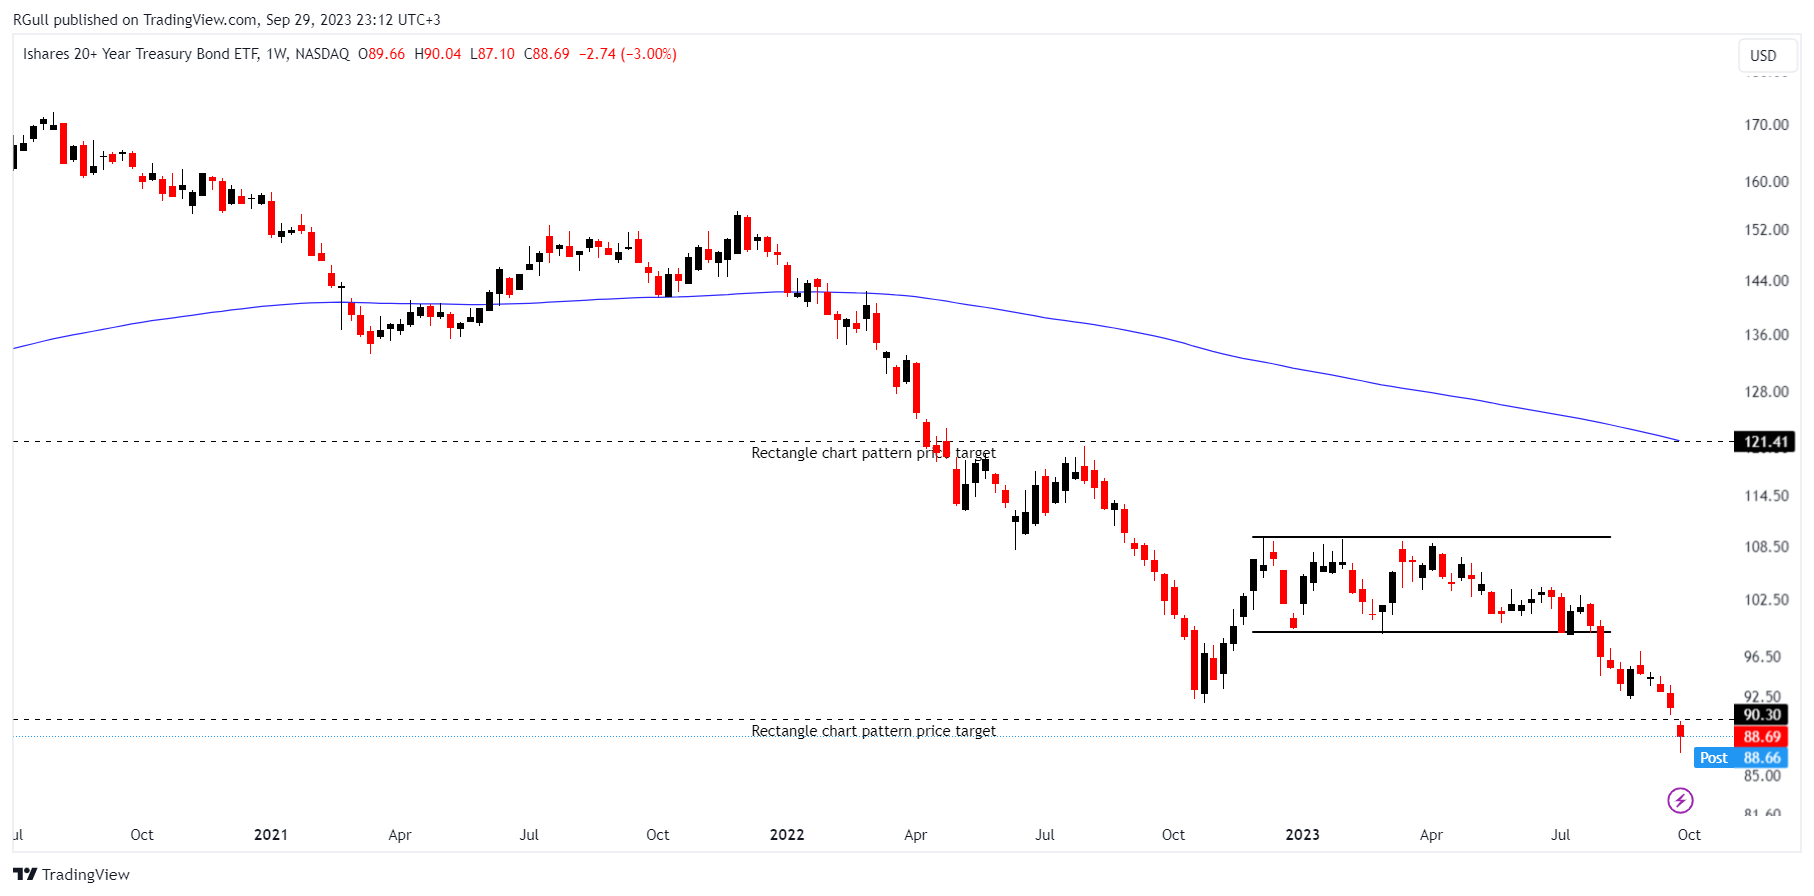
You can click on the TLT ticker above to access the first report explaining the RATIONALE behind the trade idea.
It reached its price target after the hawkish tone of the FED in the last meeting.
In October 2022, when the FED put the intention of a slowdown on rate hikes, TLT had bottomed. Now, It is traded below that level, indicating FED's success in tightening the financial conditions when you look at it yearly basis.
The main question is where does the money flow during the tightening financial conditions while there is a sell-off in the long-term bonds? We should pay attention to the US10Y02Y movement, especially after the last FED meeting. Yield curve inversion has started to backward.
Financial conditions have tightened since last October ->Tightening is associated with a `flight to safety` -> But they are selling long-term bonds, what kind of `flight to safety` is this?->Because they are buying short-term bonds and the yield curve starts to normalize.