

TRADE IDEAS
New setups
EURUSD - Long Idea
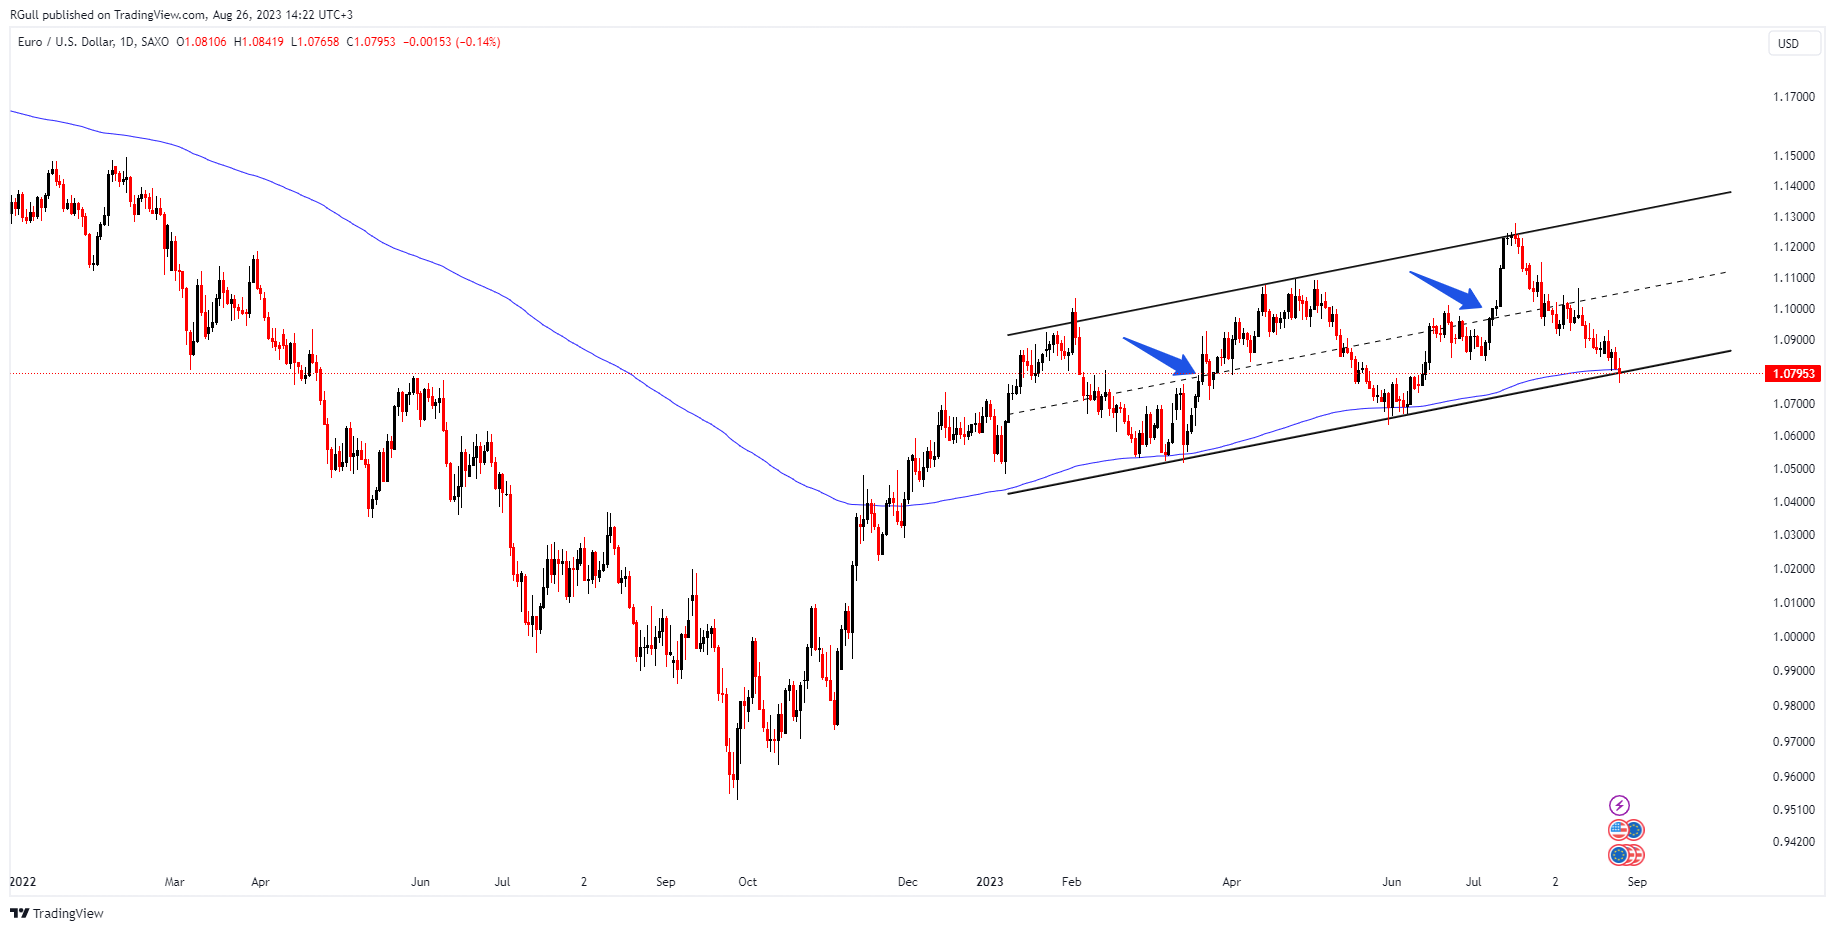
The above daily chart formed an approximately 7-month-long channel with a valid mid-channel line as it is spotted with blue arrows.
Technically, observing that the mid-channel line works either as a resistance or support is an important checkmark for the validity of a channel.
Both the 200-day EMA and the next “higher low” of the channel are around at same 1.08 levels. Seeing a rejection from here wouldn’t surprise me.
The main reason for me putting the EURUSD trade idea here is to show that sometimes the macro side and technical side contradict. With the below macro conditions, you may not prefer to be long on this trade but technically it seems a good point to be long on Euro. In such a case, your general trading plan should be involved in decision-making.
On Friday, Jay Powell’s speech gave nothing but uncertainty. We didn’t get any hints about the timeline of pausing rate hikes, how long the rates are going to hold at that level, the restrictive level of rates, etc.
He mentioned that inflation risks are still on the table in terms of service, and shelter sections. On the growth and labor market side, he emphasized the recent real rate increases and real wage increases. He finalized that they will decide to tighten further or hold the policy rate constant according to further data. Overall nothing new came up from the speech.
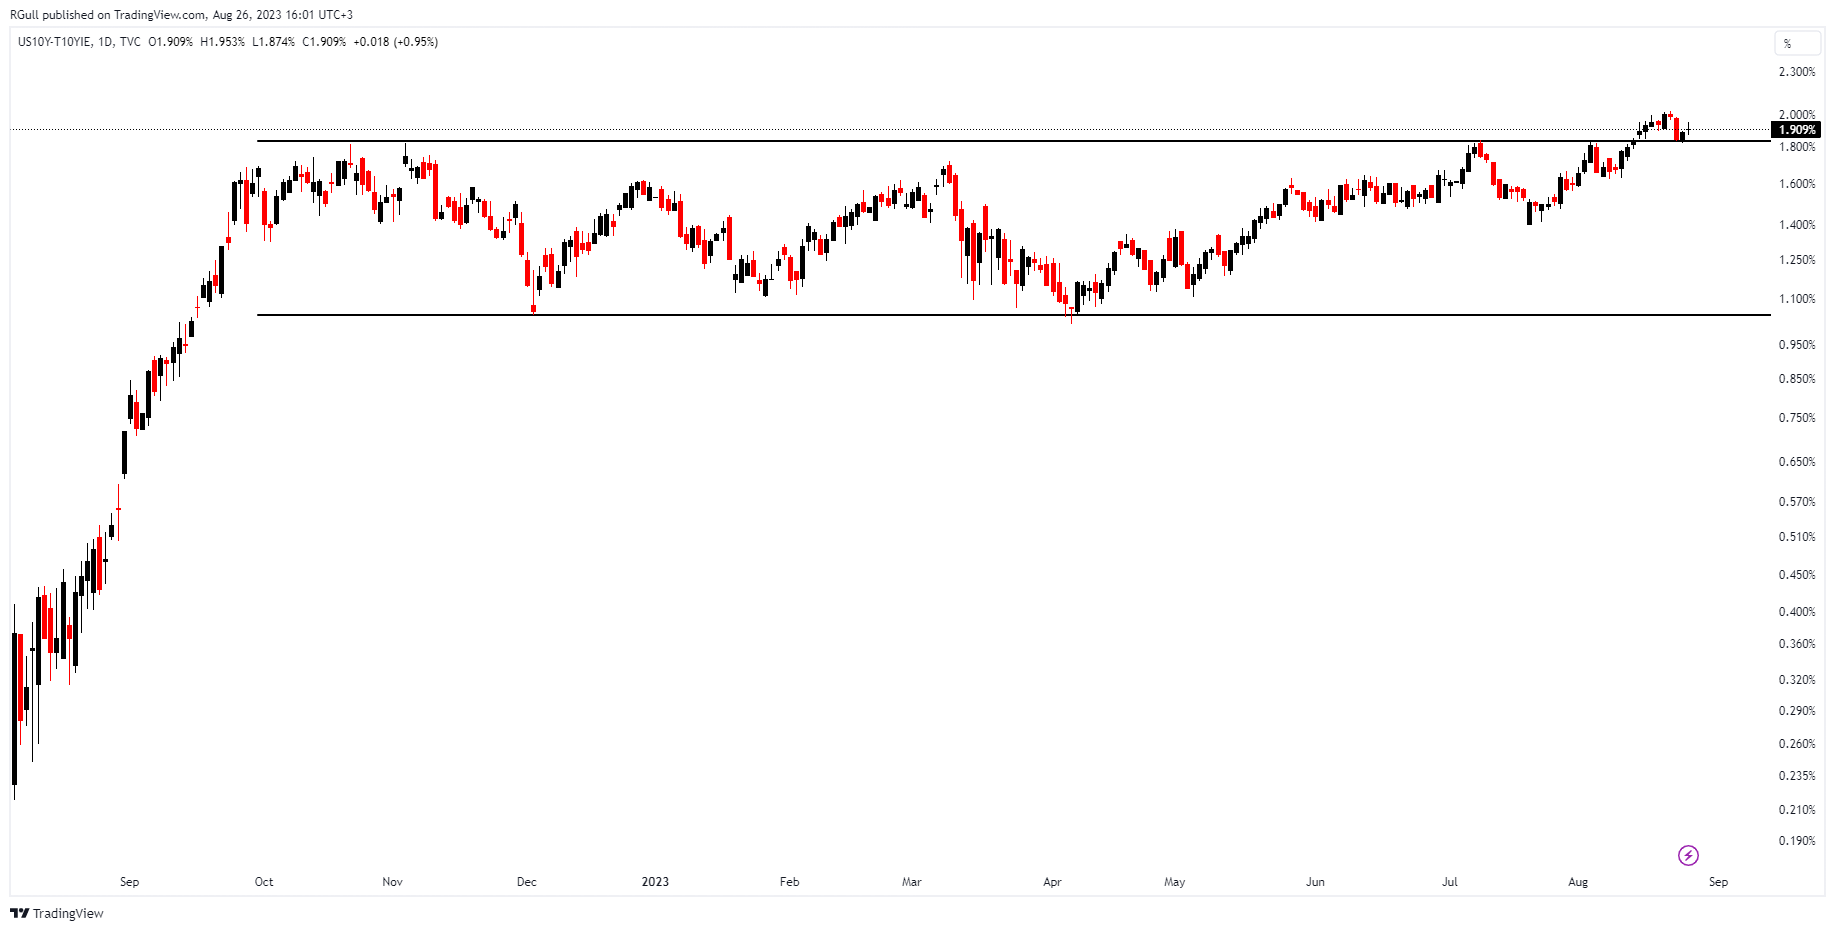
Jay Powell's Jackson Hole SpeechBefore the Jackson Hole, the main structure was the negative impact of increasing real rates plus normalizing the yield curve on risky assets until NVIDIA earnings. You can reach the RATIONALE’s analysis of the current structure from the link below.
MARKET UPDATEConsidering the contrasting economic data between the United States and the European Union(economic slowdown became obvious), there is no indication of a reversal at this point. ECB’s sentiment could tilt the likelihood towards a 'no hike' decision at the September rates meeting if further disappointing data emerges. ECB officials will be looking for reasons to ease off on rate hikes and will be hoping for core inflation to show encouraging signs of easing.
ES1!- Long/Short Idea
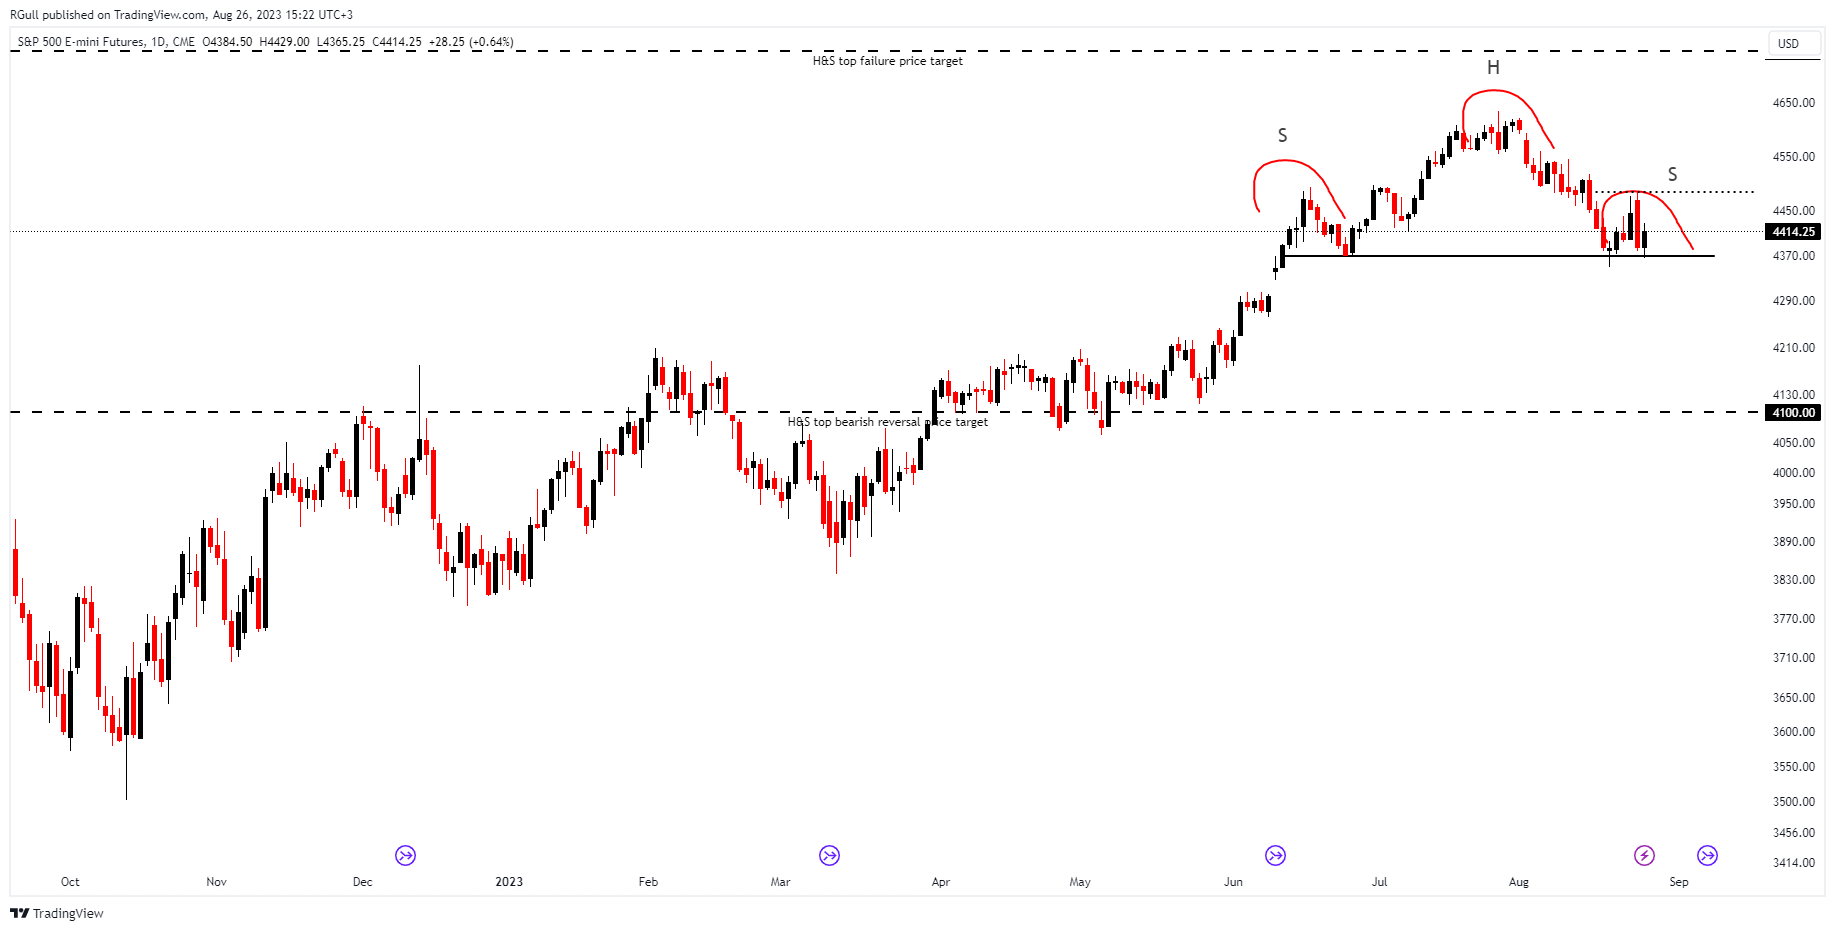
The above daily chart formed an approximately 3-month-long H&S Top chart pattern and it might act as a bearish reversal after an uptrend or failure.
For a bearish reversal scenario, the 4370 neckline level would be crucial and for the failure scenario, the 4485 level should be watched closely as it acts as a resistance on the right shoulder of the chart pattern.
Amid the macro uncertainty, having two-way trades on your watchlist would help you to take action in both directions.
FDAX1!- Short Idea
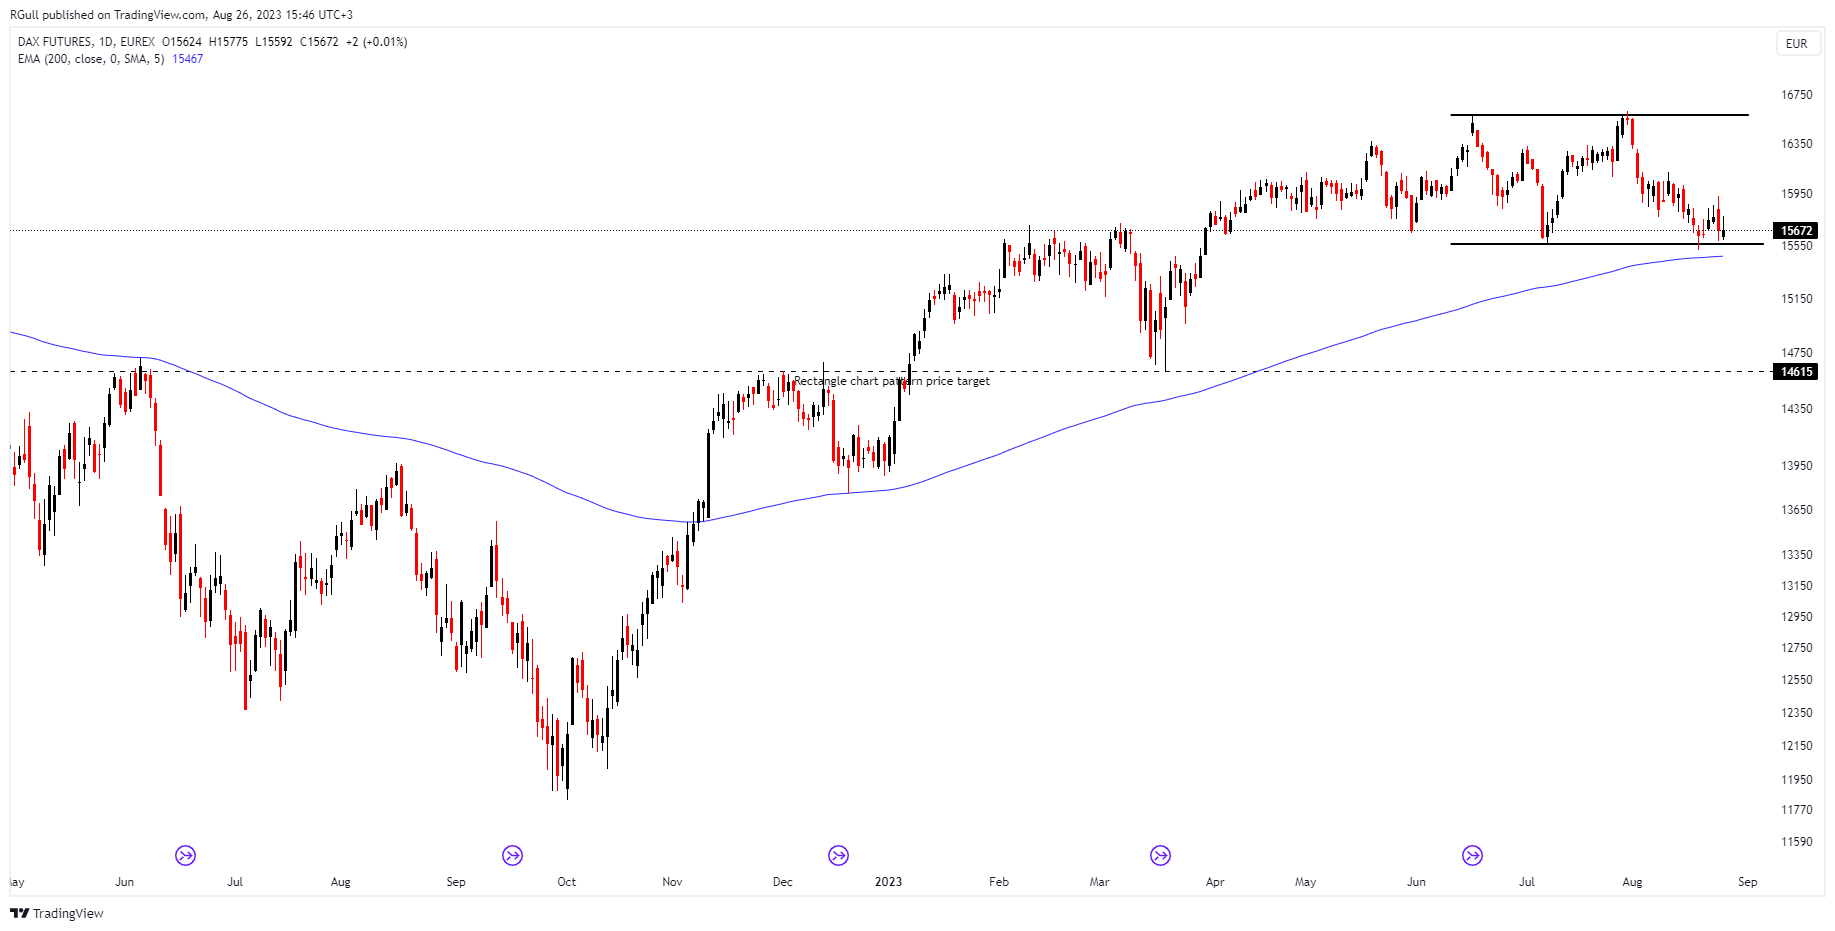
The above daily chart formed an approximately 3-month-long Rectangle chart pattern as a bearish reversal after an uptrend, with support at 15560 levels.
A daily close below 15400 levels would validate the breakdown from the 3-month-long Rectangle chart pattern. Such a price action would be also a breakdown of a 200-day EMA which is my filter for entering short positions.
This breakdown could potentially result in a chart pattern target of 14615 levels.
Considering the stagflation structure of the euro area, being short at DAX seems sensible. 30/08 German CPI data would be influential on this trade idea.
LINKUSDT- Long/Short Idea
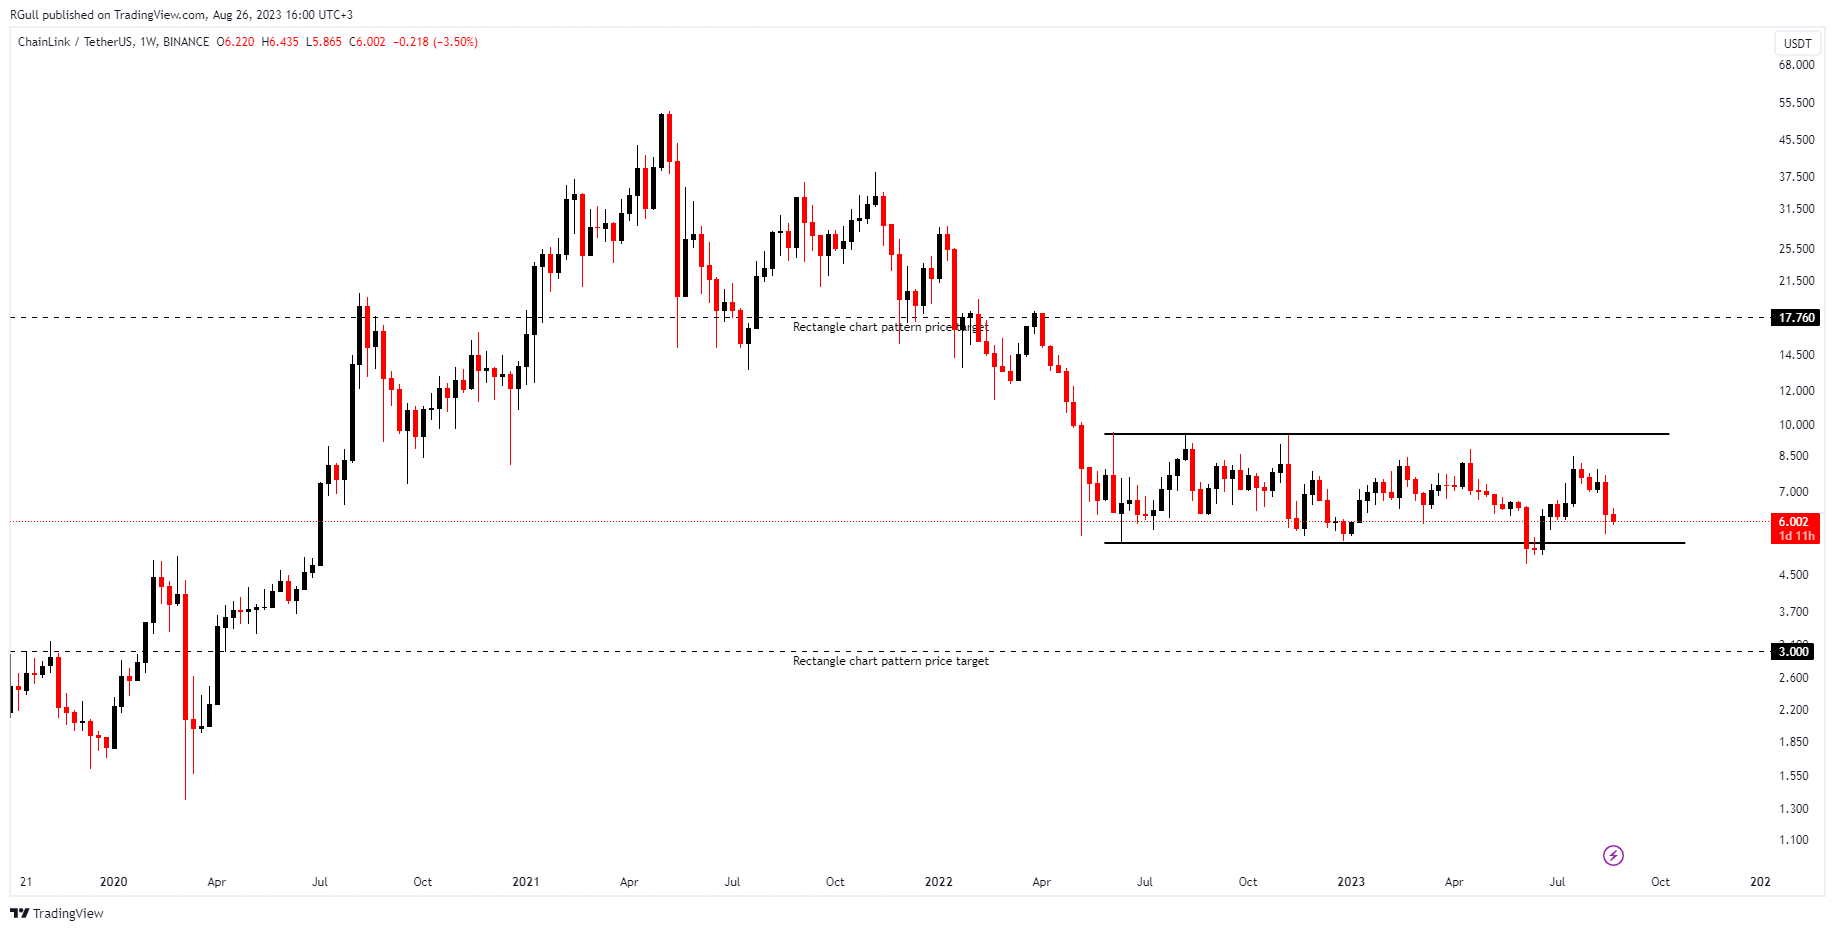
The above weekly chart formed an approximately 14-month-long Rectangle chart pattern, with support at the 5.3 level and resistance at the 9.5 level.
A daily close above 9.7 levels would validate the breakout from the 14-month-long Rectangle chart pattern and conversely, a daily close below 5.18 levels would validate the breakdown from the 14-month-long Rectangle chart pattern.
This breakdown could potentially result in a chart pattern target of 14615 levels.
The real rates would be influential on the direction of the crypto market. As we see further increases, I would expect the “short” scenario to happen.

ETHUSDT- Long Idea
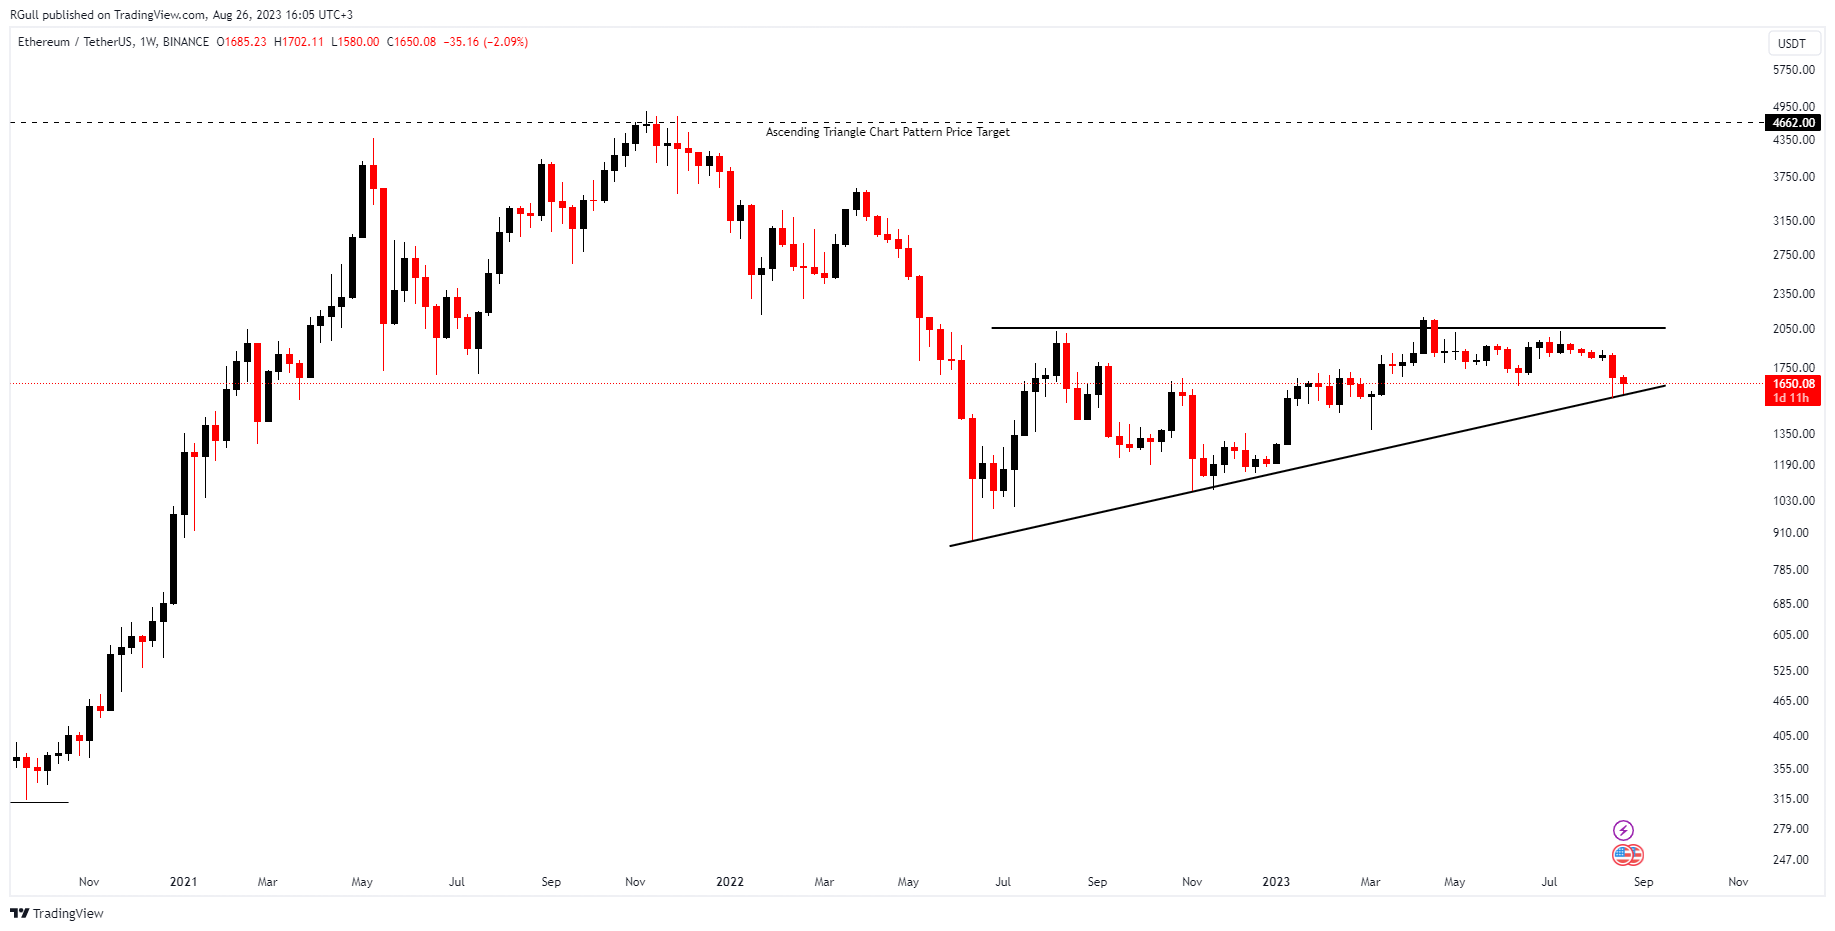
The above weekly chart formed an approximately 14-month-long Ascending triangle chart pattern as a bullish reversal after a downtrend, with resistance at 2250 levels.
A daily close above 2110 levels would validate the breakout from the 14-month-long Ascending triangle chart pattern.
This breakout could potentially result in a chart pattern target of 4660 levels.
BR- Long Idea
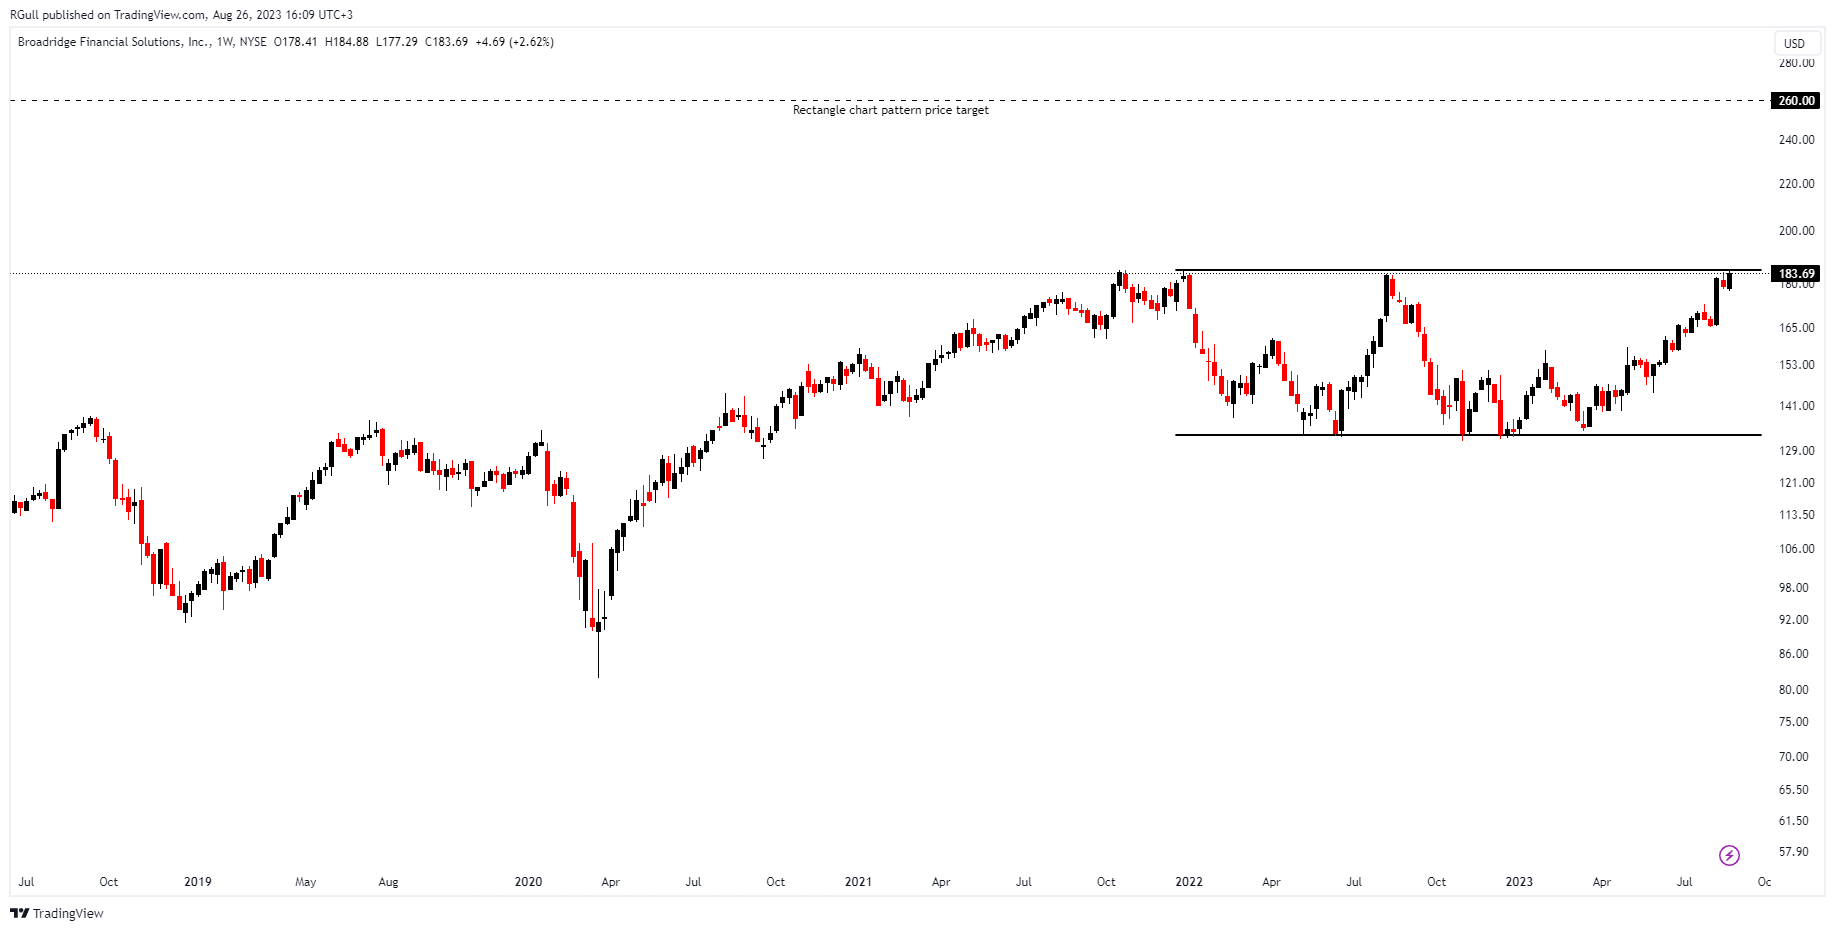
Broadridge Financial Solutions Inc. offers communication and technology-driven services to banks, broker-dealers, and corporate issuers. Their offerings encompass investor and customer communications, securities processing, as well as data and analytics solutions.
The above weekly chart formed an approximately 20-month-long Rectangle chart pattern as a bullish continuation after an uptrend, with resistance at 185 levels.
A daily close above 190 levels would validate the breakout from the 20-month-long Rectangle chart pattern and that would be a breakout to an all-time high.
This breakout could potentially result in a chart pattern target of 260 levels.
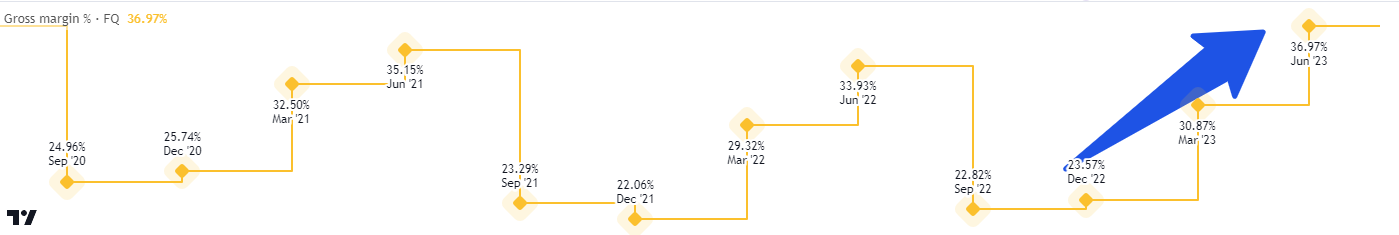
Gross margin(profit margin) acceleration YoY in Quarterly Earnings is another plus.

Follow-ups
TUR - Long Idea
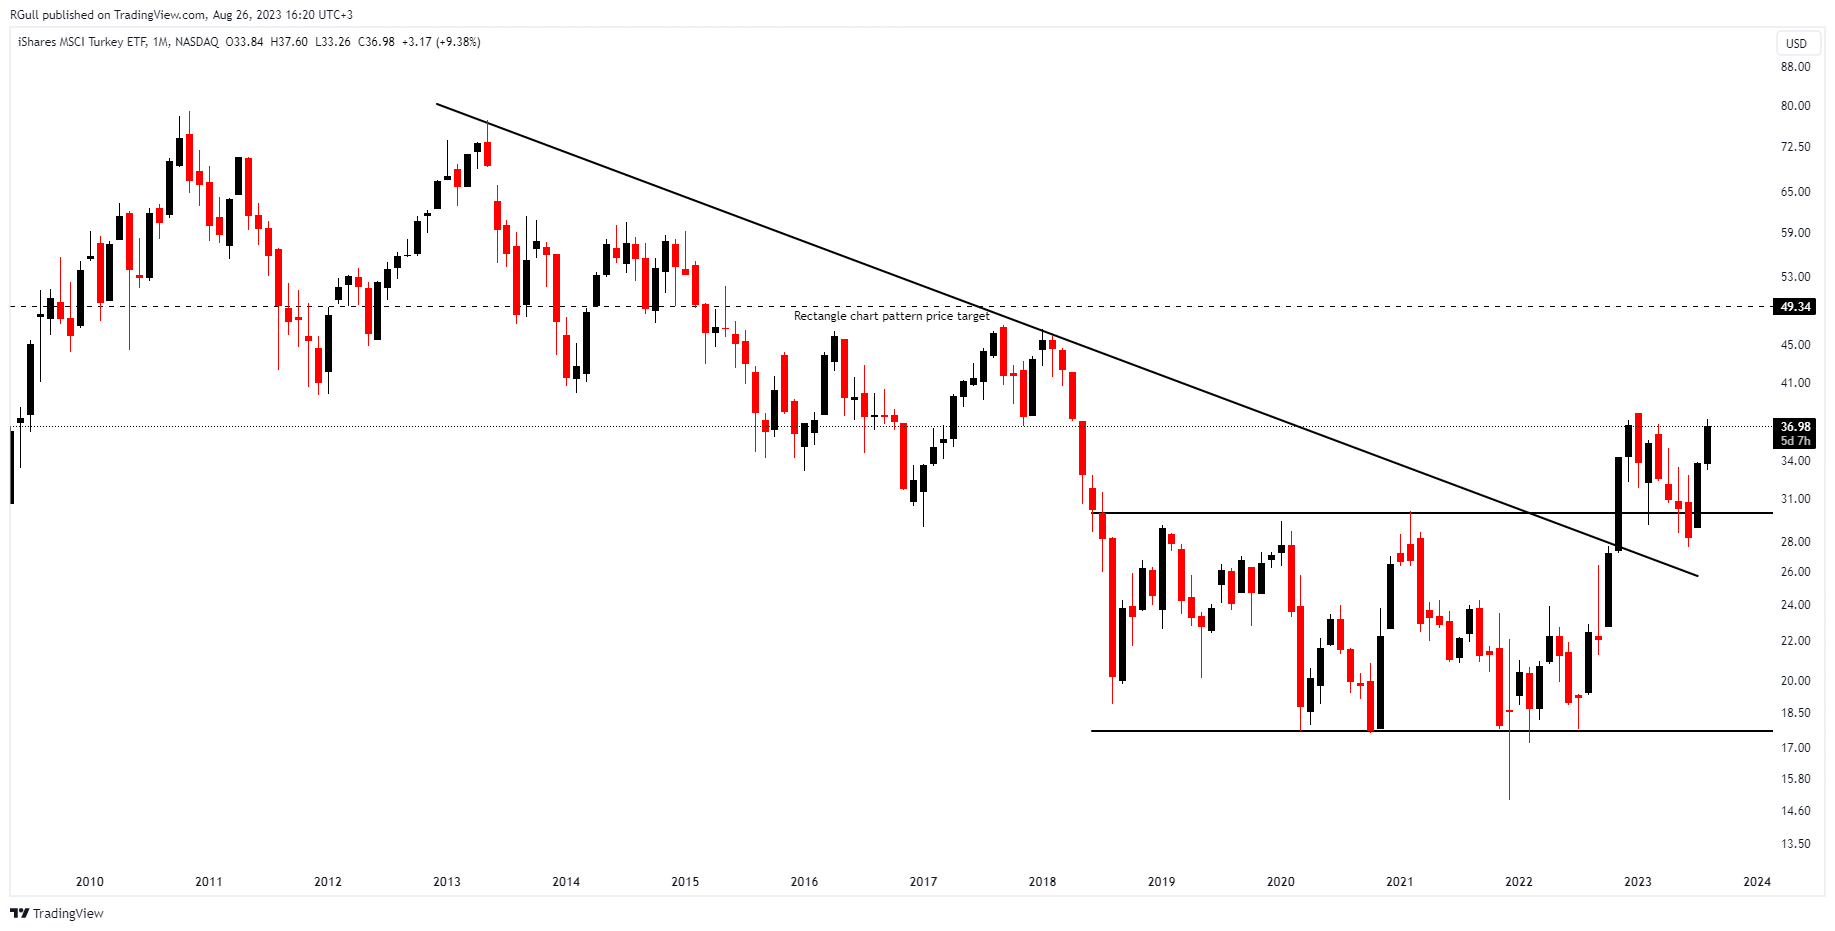
You can click on the TUR ticker above to access the first report explaining the RATIONALE behind the trade idea.
The price found support at the 29.4 level and rebounded. Technically, we expect to see a further increase, especially after a strong bullish monthly bar.
The Central Bank of Turkey announced a 750 bp rate increase this week. It is a sign of getting back to orthodox policies. Thus it might lead foreign investors to consider the Turkish stock market as an investment opportunity. For foreign inflow, diligent hedging instruments are the number one priority. They don’t want to be hit by rate depreciation while they are investing in the stock market.
However, without a foreign inflow, domestic investors might be attracted by the current profit that they hold and take some profit and invest in sovereign bonds as an alternative instrument with the given rate increase. That would have a negative impact on the stock market.
TLT - Long/Short Idea
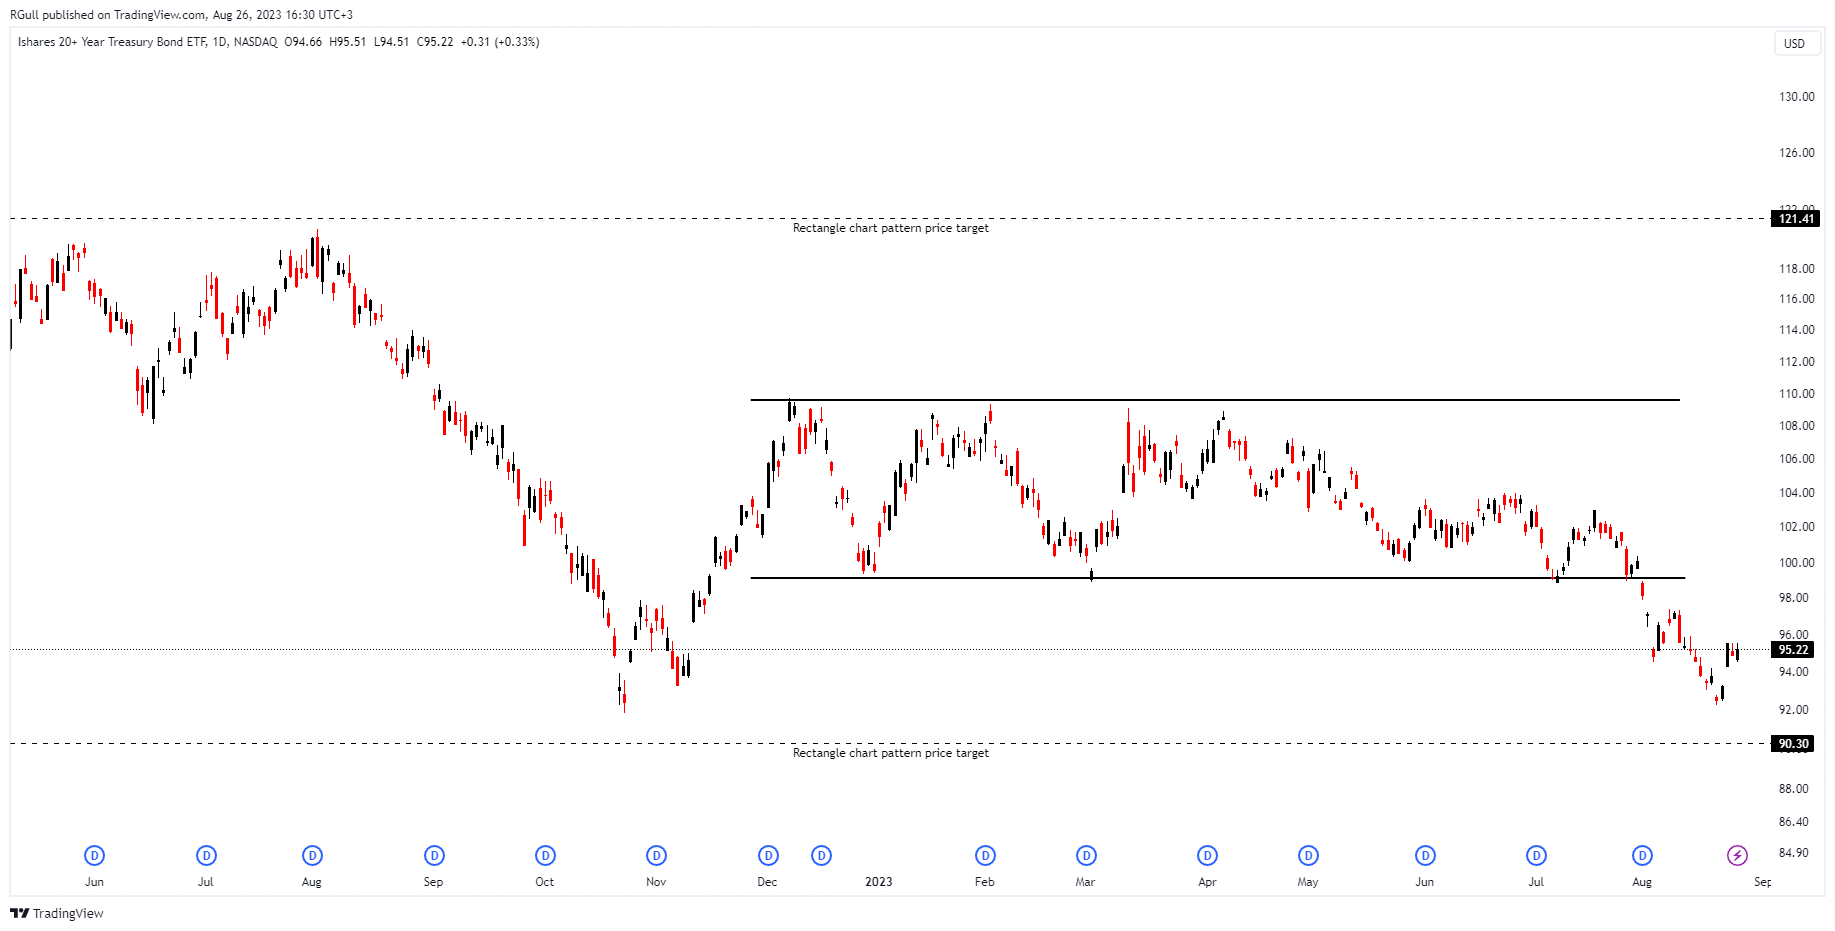
You can click on the TLT ticker above to access the first report explaining the RATIONALE behind the trade idea.
24/08 RATIONALE Market Update report explains the structure behind the above price action of long-term yields.