

TRADE IDEAS
New setups
NQ1! - Short Idea
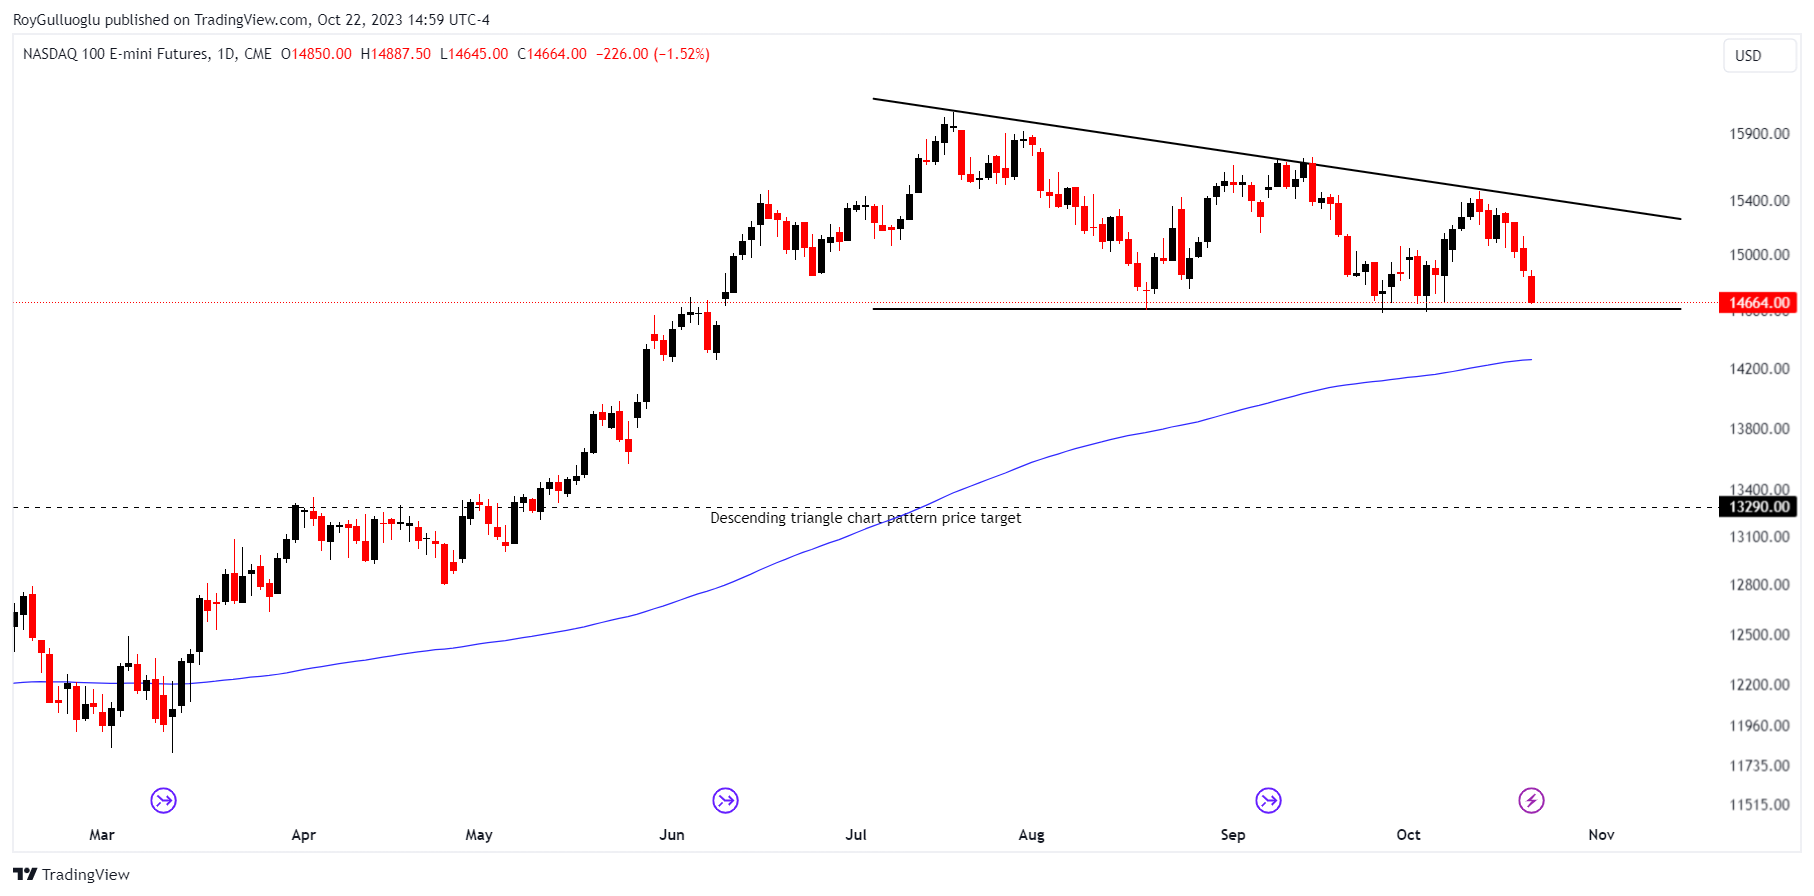
The above daily chart formed an approximately 2-month-long descending triangle chart pattern as a bearish reversal after an uptrend.
Within this pattern, the horizontal boundary at 14610 levels acts as strong support.
A daily close below 14350 levels would validate the breakout from the 2-month-long descending triangle chart pattern.
The potential price target, based on this chart pattern, is 13290 levels.
MA - Short Idea
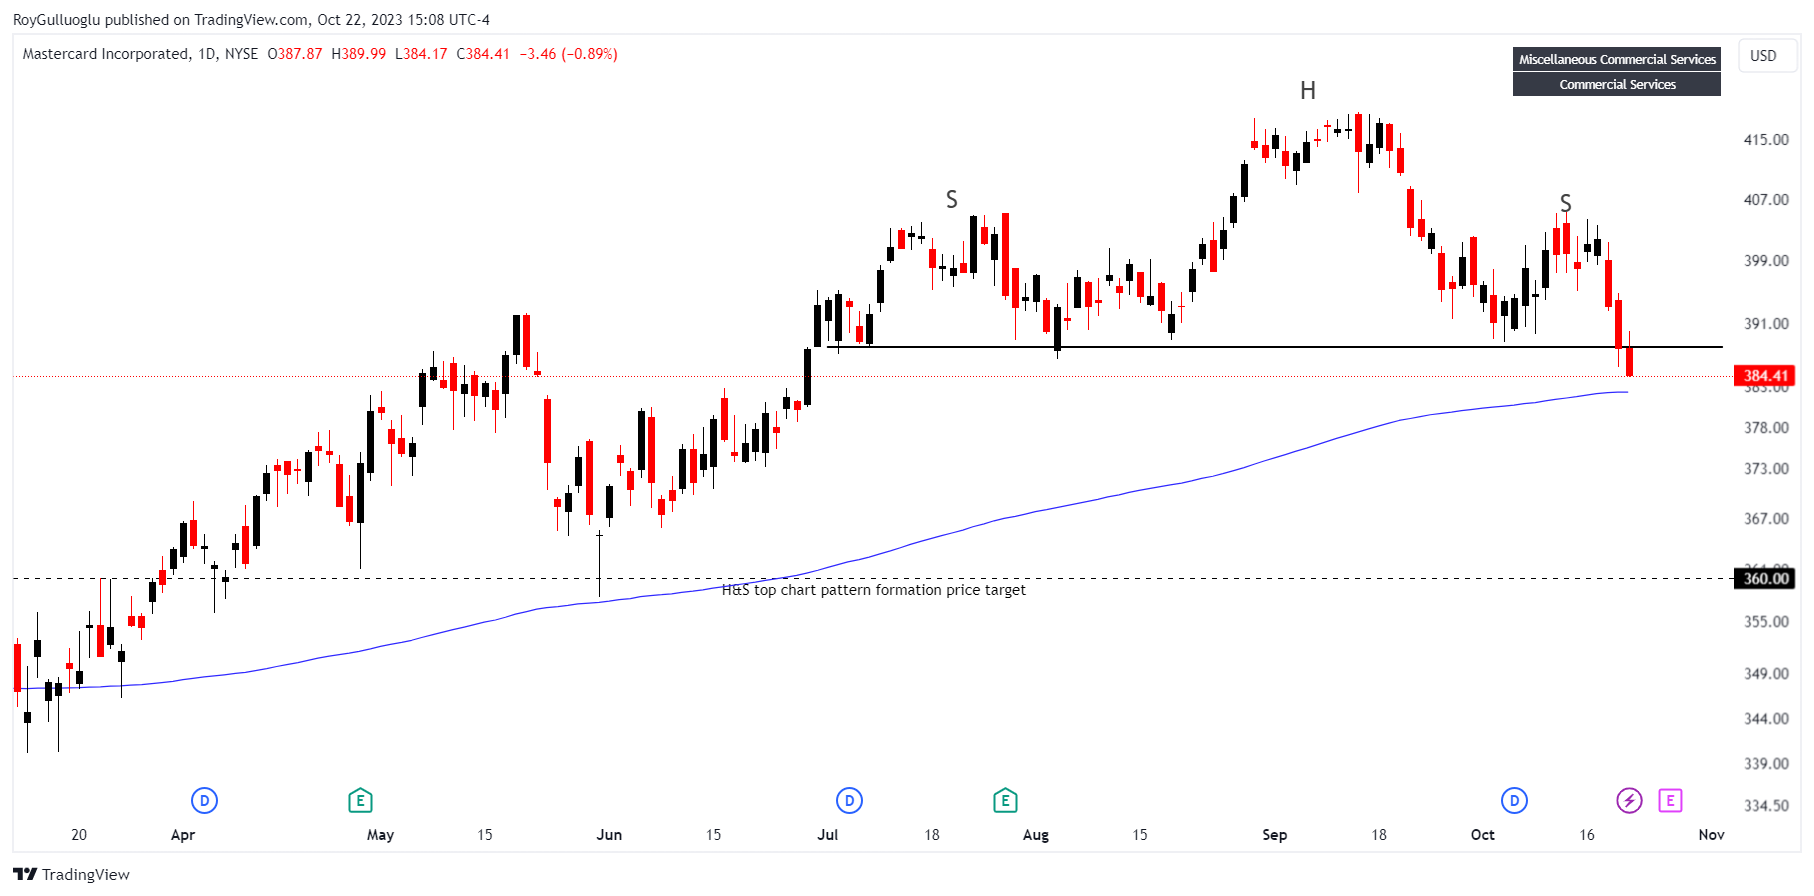
Mastercard Inc. is a tech firm that earns money through fees tied to card transaction volumes and processing numbers on its network.
The above daily chart formed an approximately 3-month-long H&S top chart pattern as a bearish reversal after an uptrend.
Within this pattern, the horizontal boundary at 388 levels acted as strong support.
A daily close below 381.5 levels would validate the breakout from the 3-month-long H&S top chart pattern. That would be also a breakdown below the 200-day EMA which I use as a trend filter.
The potential price target, based on this chart pattern, is 360 levels.
MA, classified under the "financial services" sector, falls under the “Large Cap - Income” stock category.
We would expect the income stocks to perform relatively better but large caps to do worse assuming the US is in the recession phase of the economic cycle.
Considering the sensitivity of the financial stocks to the rates, I will be monitoring the upcoming demand for especially long-term US treasuries to evaluate the MA trade idea. I believe recently neither CPI nor geopolitical risks have been the major driver of the market. The low demand on 30-year US treasuries auctions had been much more influential on prices.
MMC - Short Idea
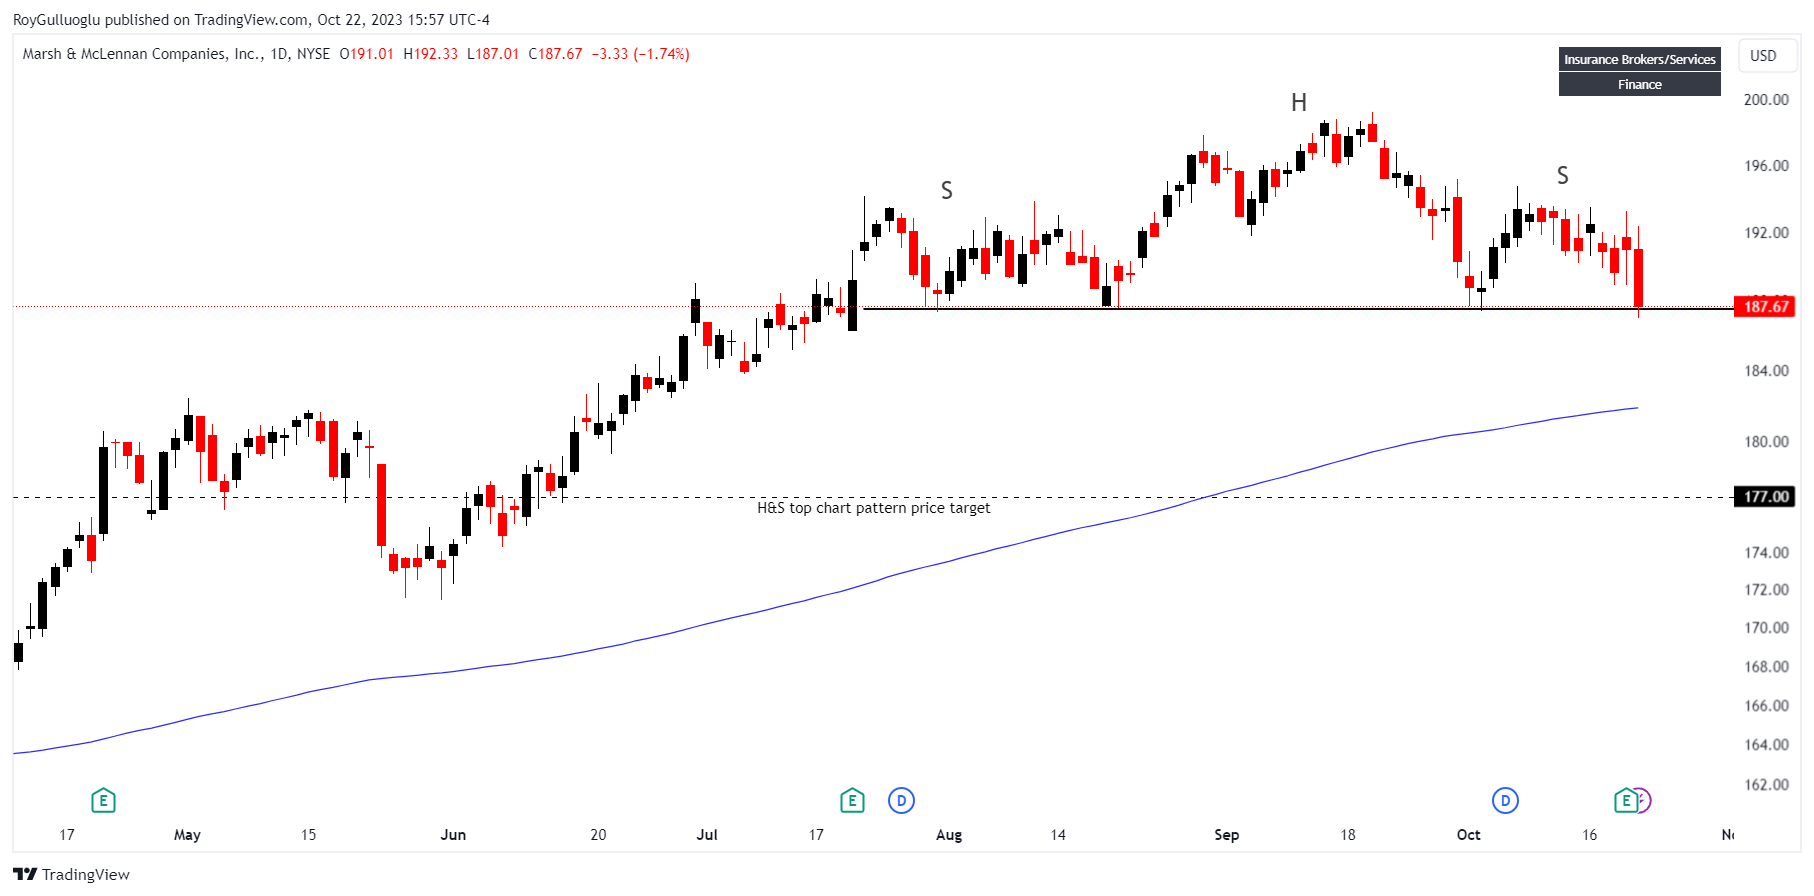
Marsh & McLennan Companies Inc. is a professional services company specializing in offering guidance and solutions in risk management, strategic planning, and human resources.
The above daily chart formed an approximately 2-month-long H&S top chart pattern as a bearish reversal after an uptrend.
Within this pattern, the horizontal boundary at 187.5 levels acted as strong support.
A daily close below 184.85 levels would validate the breakout from the 2-month-long H&S top chart pattern.
The potential price target, based on this chart pattern, is 177 levels.
MMC, classified under the "financial services" sector, falls under the “Large Cap - Income” stock category.
MLTX - Long/Short Idea
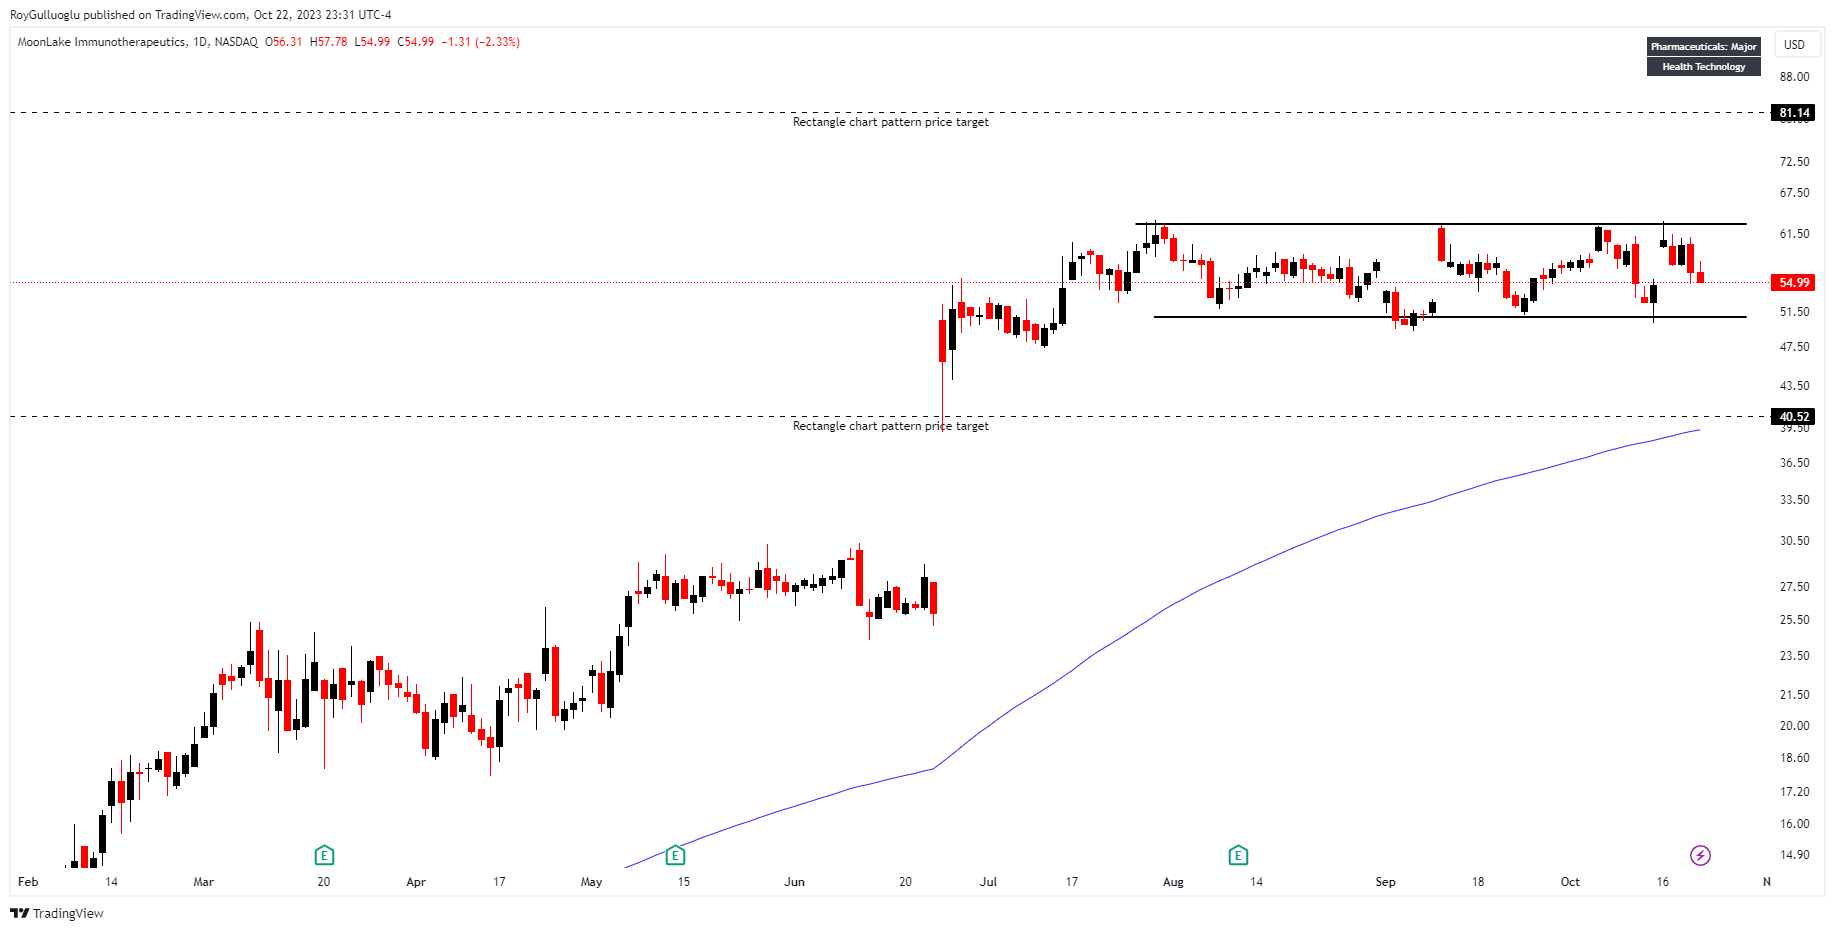
MoonLake Immunotherapeutics is a clinical-stage biopharmaceutical firm dedicated to harnessing Nanobody technology for the advancement of advanced treatments for immunological conditions, such as inflammatory skin and joint diseases.
The above daily chart formed an approximately 2-month-long rectangle chart pattern which has a resistance at 62.88 levels and support at 50.77 levels.
A daily close either below 49.25 levels or above 64.76 levels would validate the breakout from the 2-month-long rectangle chart pattern.
MLTX, classified under the "healthcare care" sector, falls under the “Mid Cap - Value” stock category.
Follow-ups
GBPCHF - Short Idea
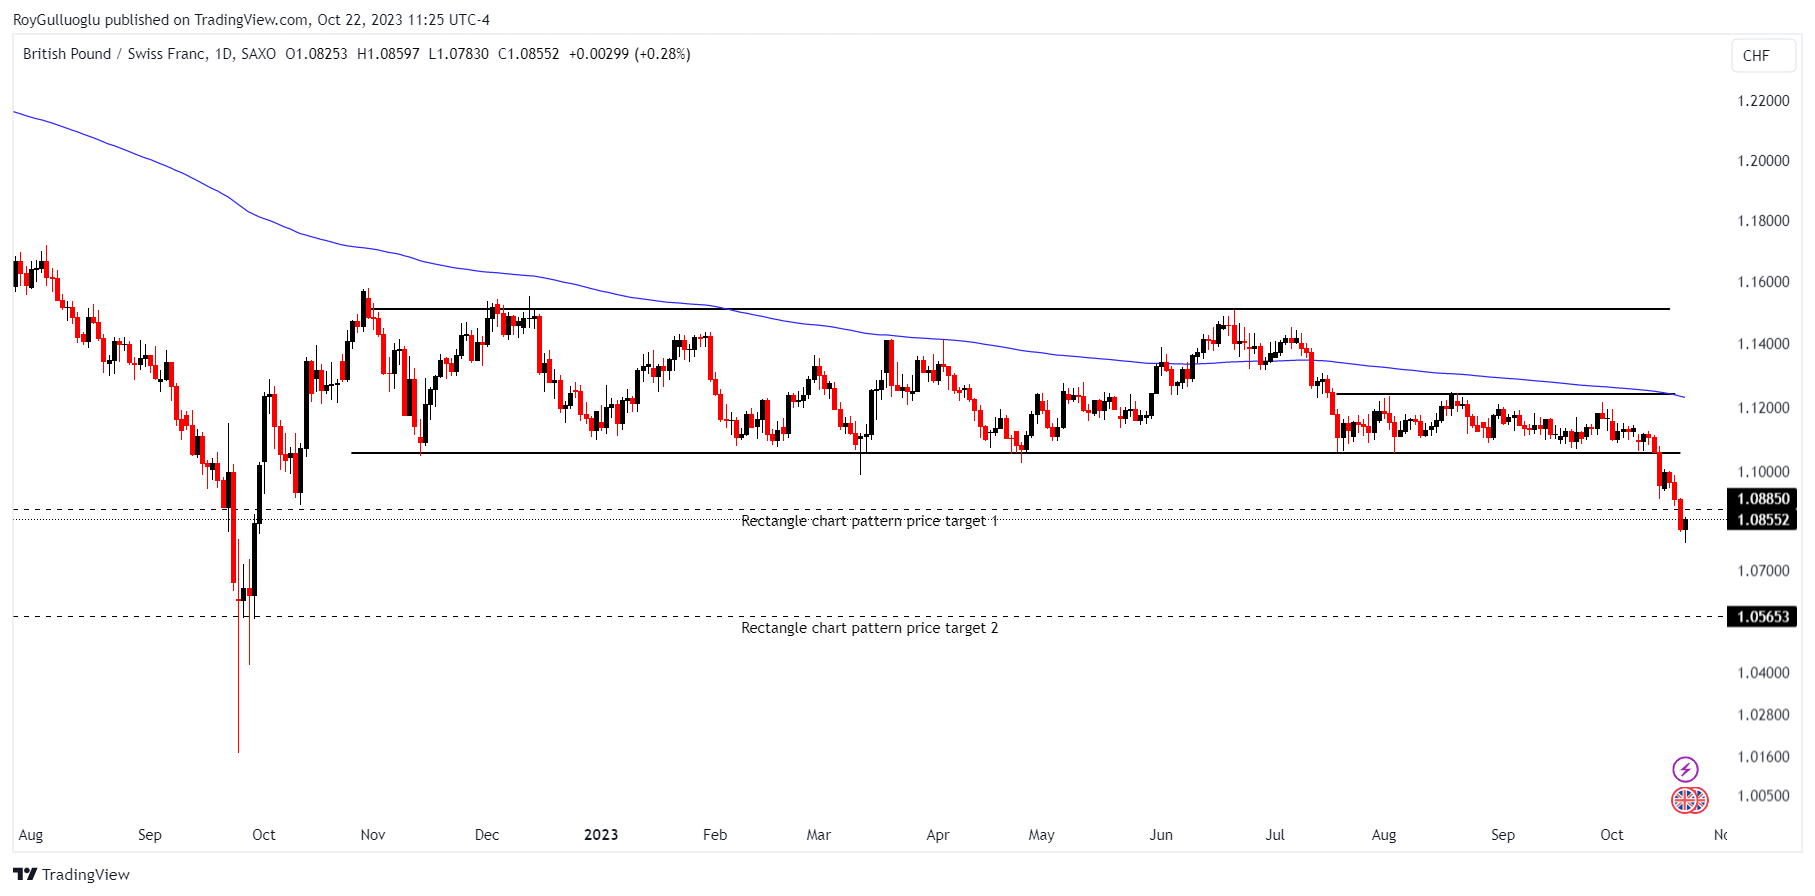
You can click on the GBPCHF ticker above to access the first report explaining the RATIONALE behind the trade idea.
Price reached the 2-month-long rectangle chart pattern target of 1.0885.
FDAX1! - Short Idea
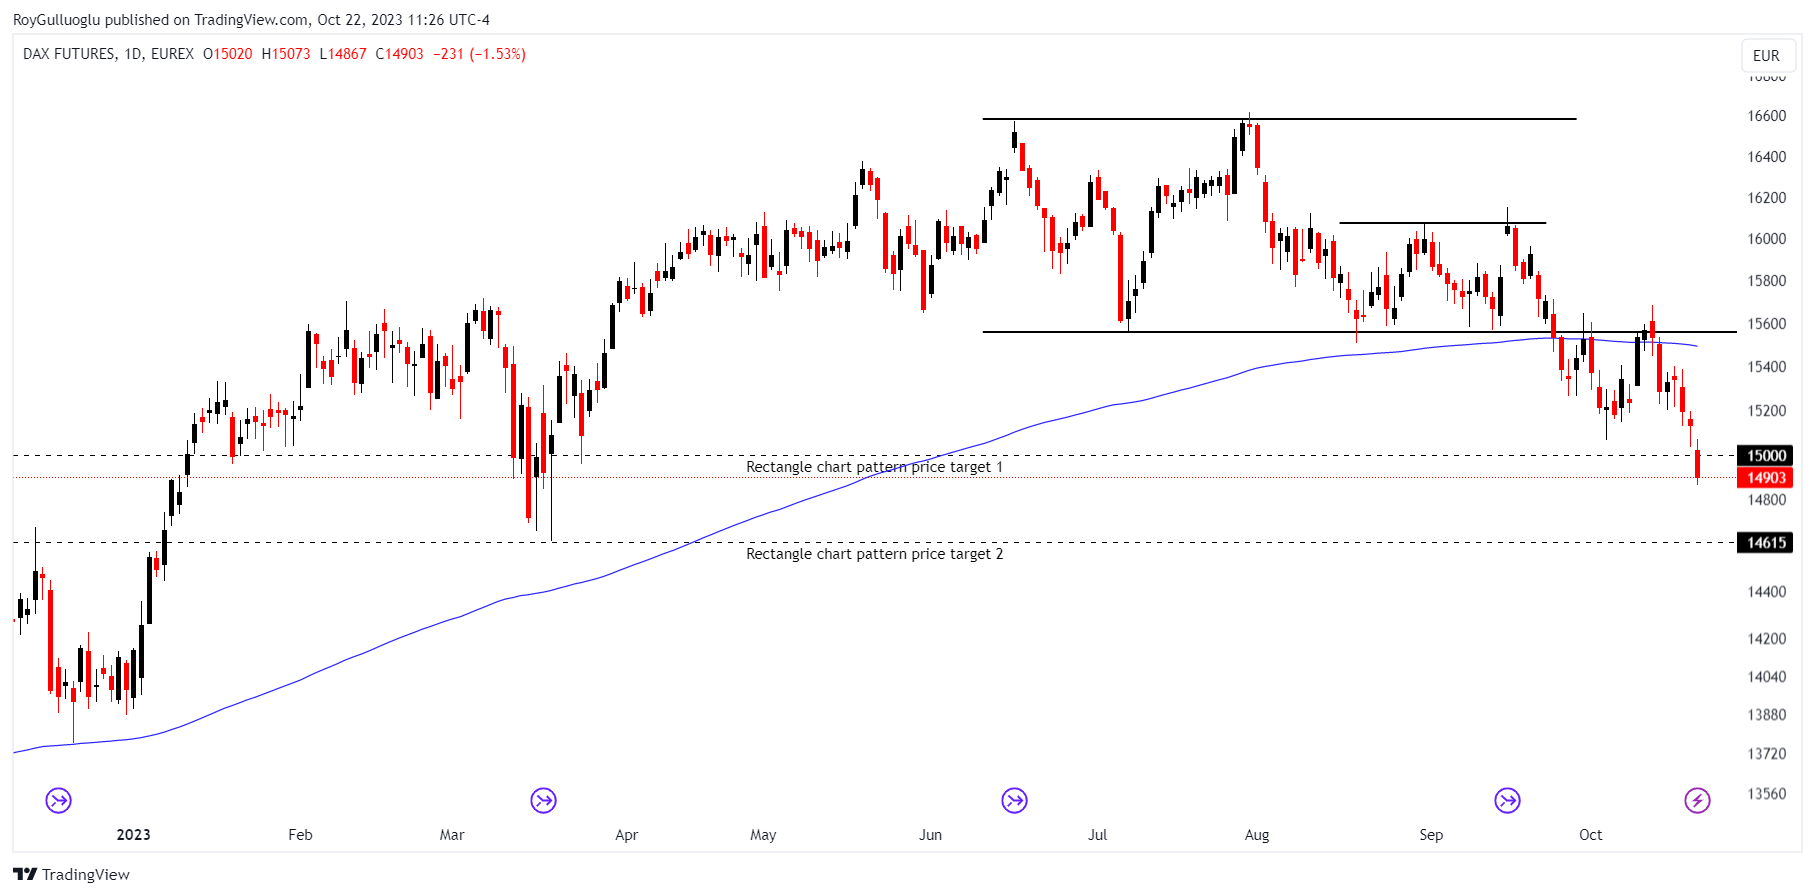
You can click on the FDAX1! ticker above to access the first report explaining the RATIONALE behind the trade idea.
Price reached the first rectangle chart pattern target of 15000.
KBH - Short Idea
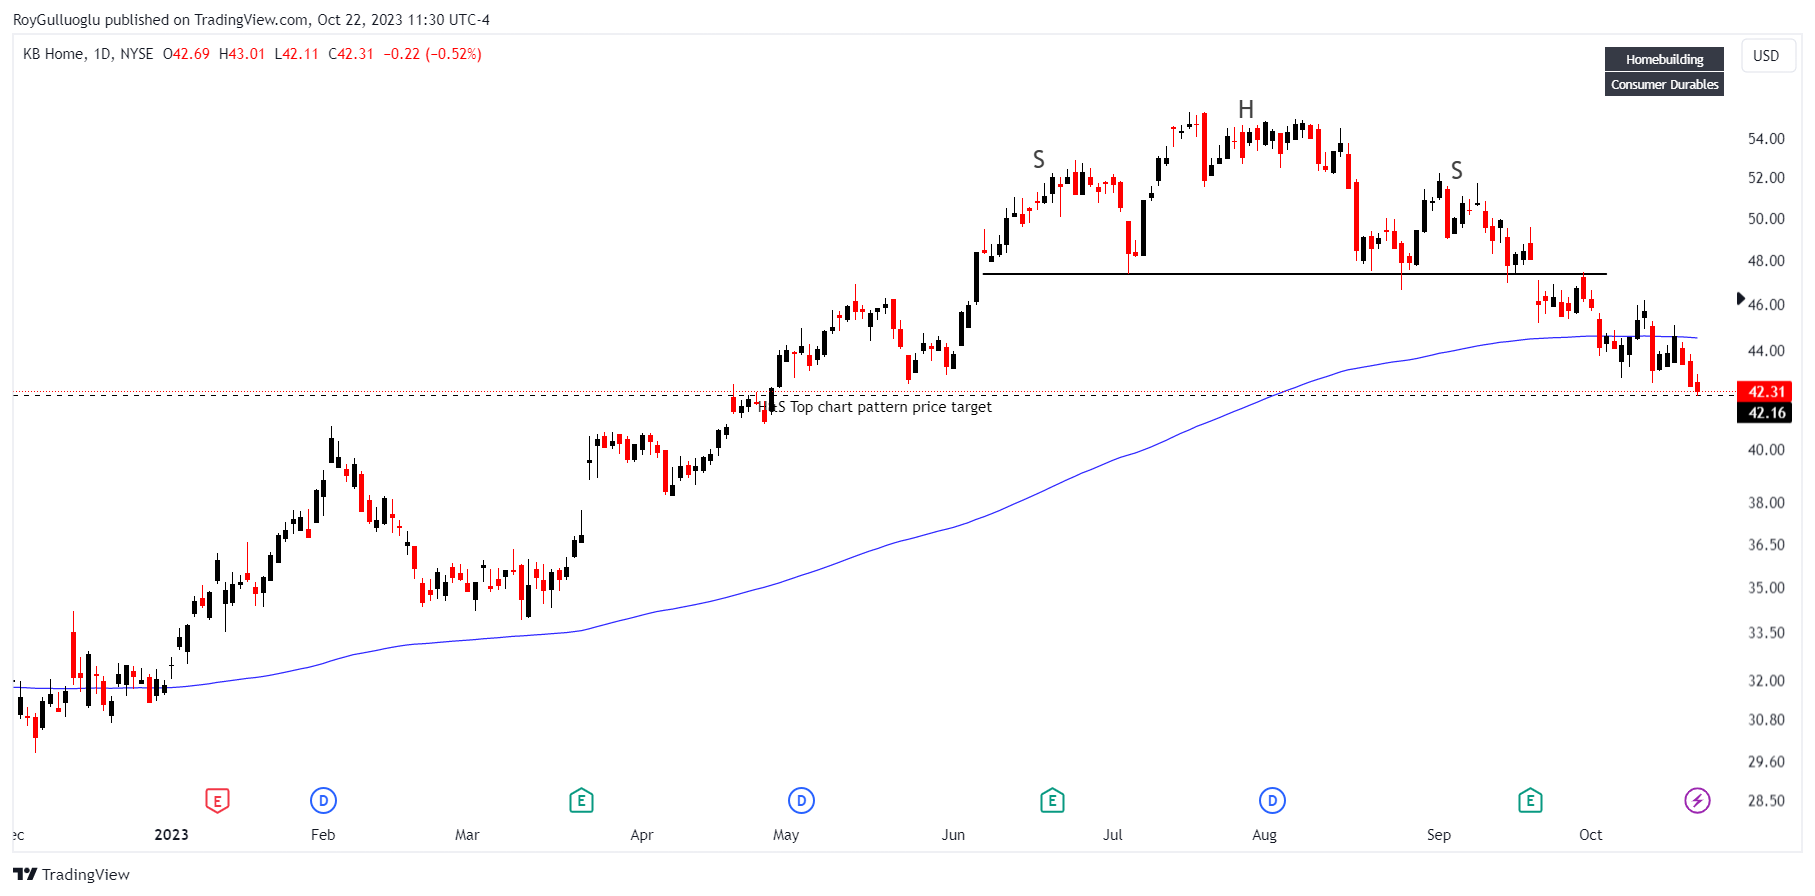
You can click on the KBH ticker above to access the first report explaining the RATIONALE behind the trade idea.
Price reached the 3-month-long H&S top chart pattern target of 42.16
EG - Long Idea
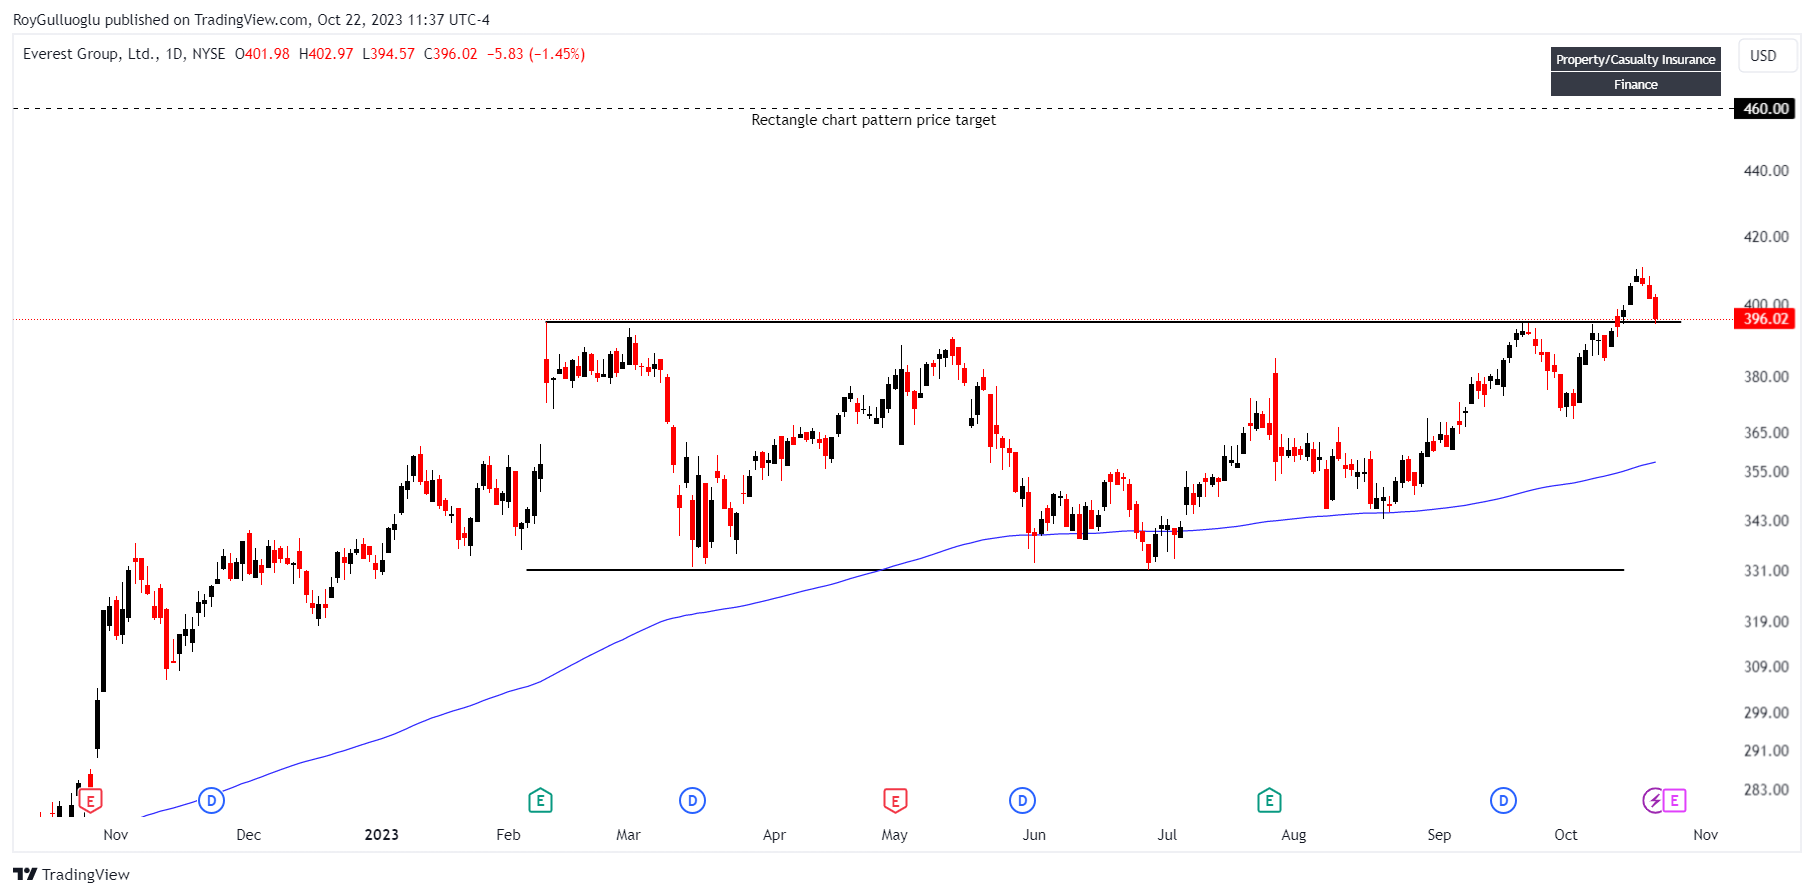
You can click on the EG ticker above to access the first report explaining the RATIONALE behind the trade idea.
A daily close above 399 levels validated the breakout from the 5-month-long rectangle chart pattern.
The price pulled back to the resistance of the rectangle chart pattern.
BTCUSDT - Long Idea
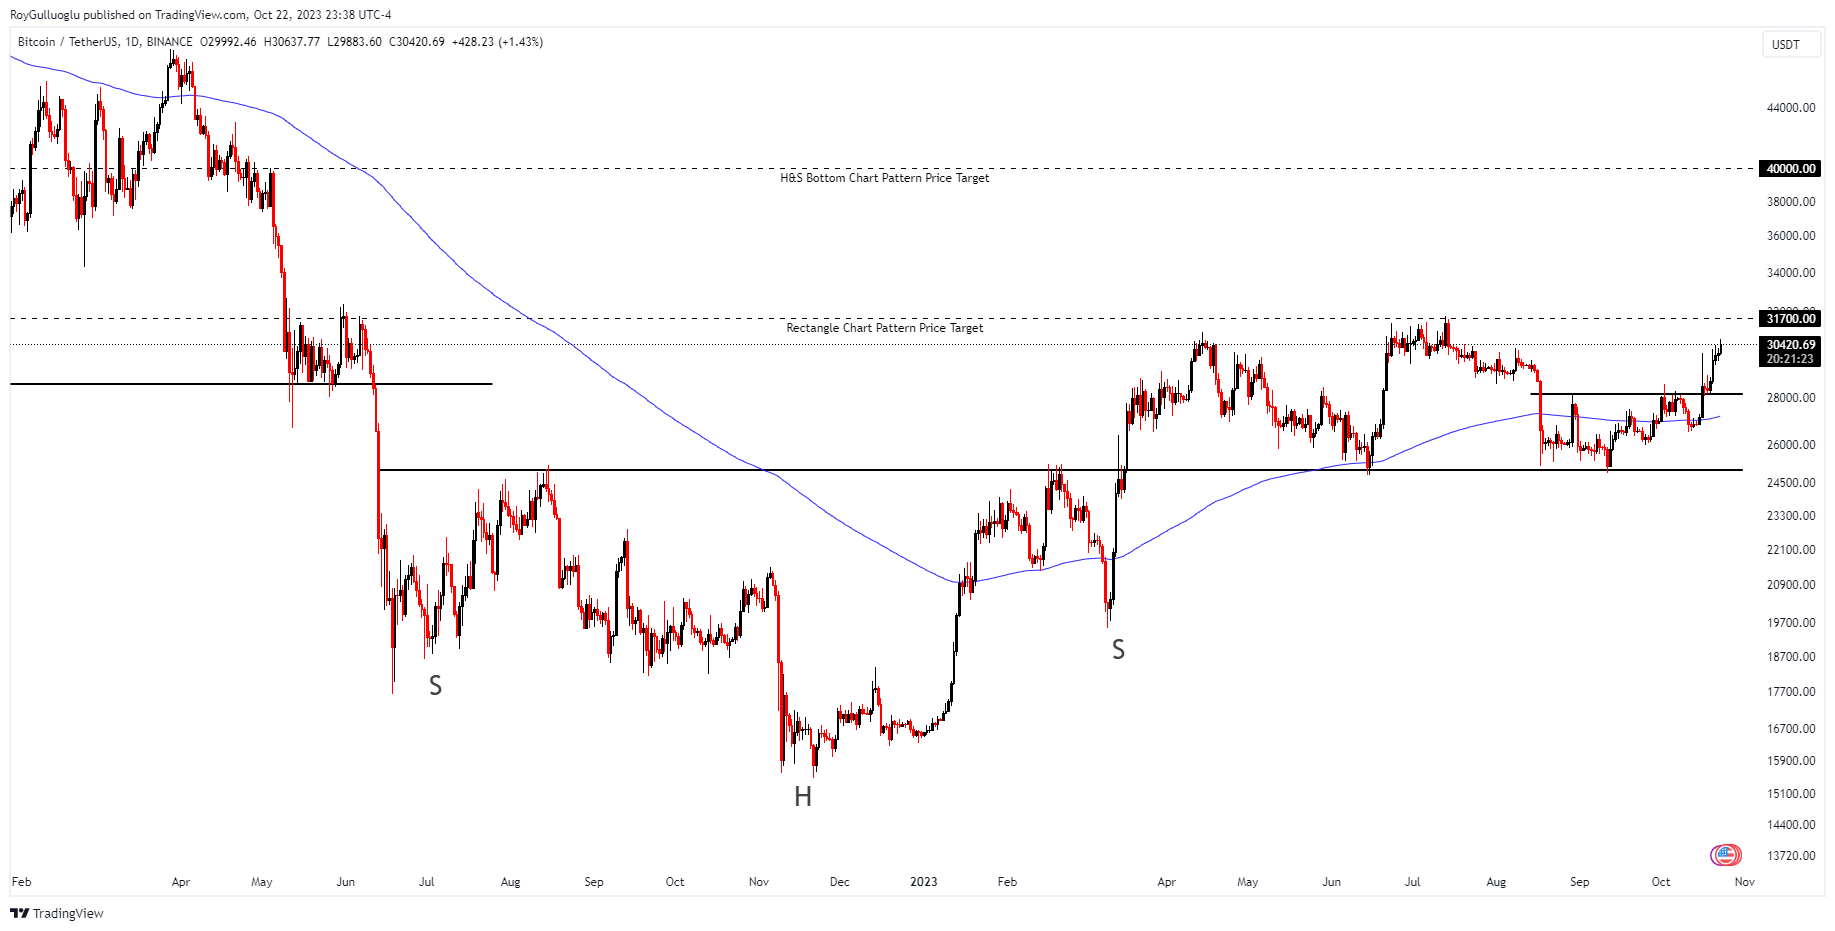
You can click on the BTCUSDT ticker above to access the first report explaining the RATIONALE behind the trade idea.
A daily close above 28800 levels validated the breakout from the 2-month-long rectangle chart pattern.
MNDY - Short Idea
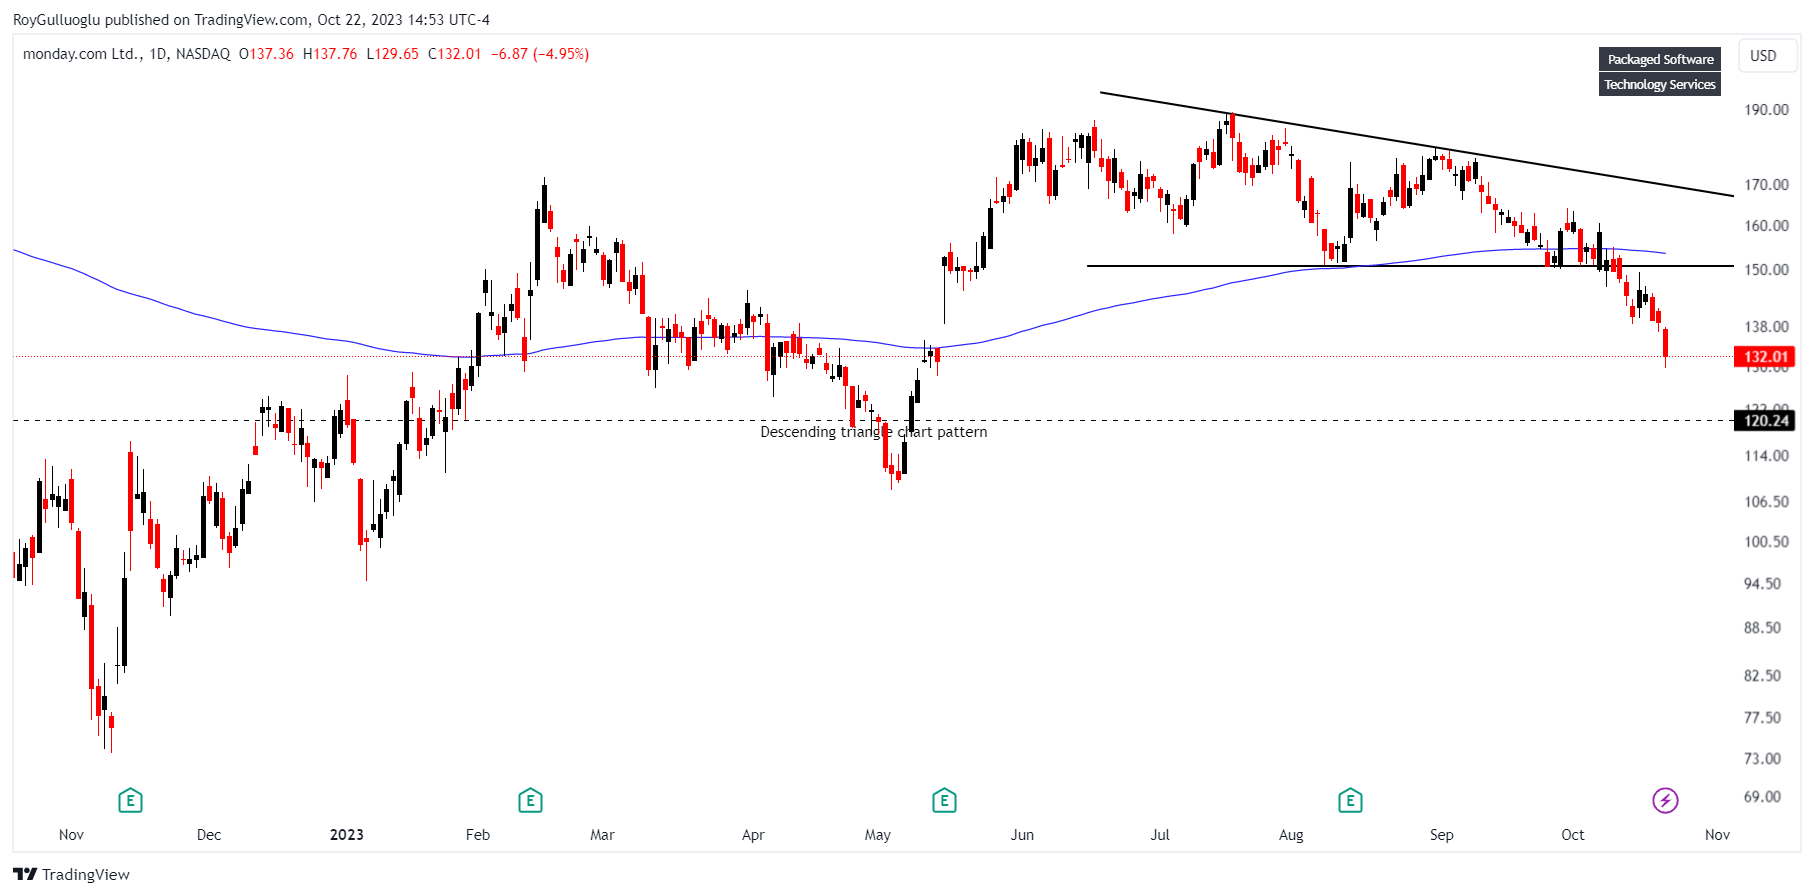
You can click on the MNDY ticker above to access the first report explaining the RATIONALE behind the trade idea.
A daily close below 144.5 levels and 200 EMA validated the breakout from the 2-month-long rectangle chart pattern.
The price pulled back toward the support level of the given chart pattern and then continued to the bearish movement.