

TRADE IDEAS
New setups
TEAM - Long Idea
Atlassian Corporation PLC is a holding company engaged in designing, developing, licensing, and maintaining software and the provisioning of software hosting services to help teams organize their work.
The GICS sector classification of the company is `information technology` which generally performs weakly during high-rate environments. However, as we saw on the Friday close, equities might act insensitive to rates.
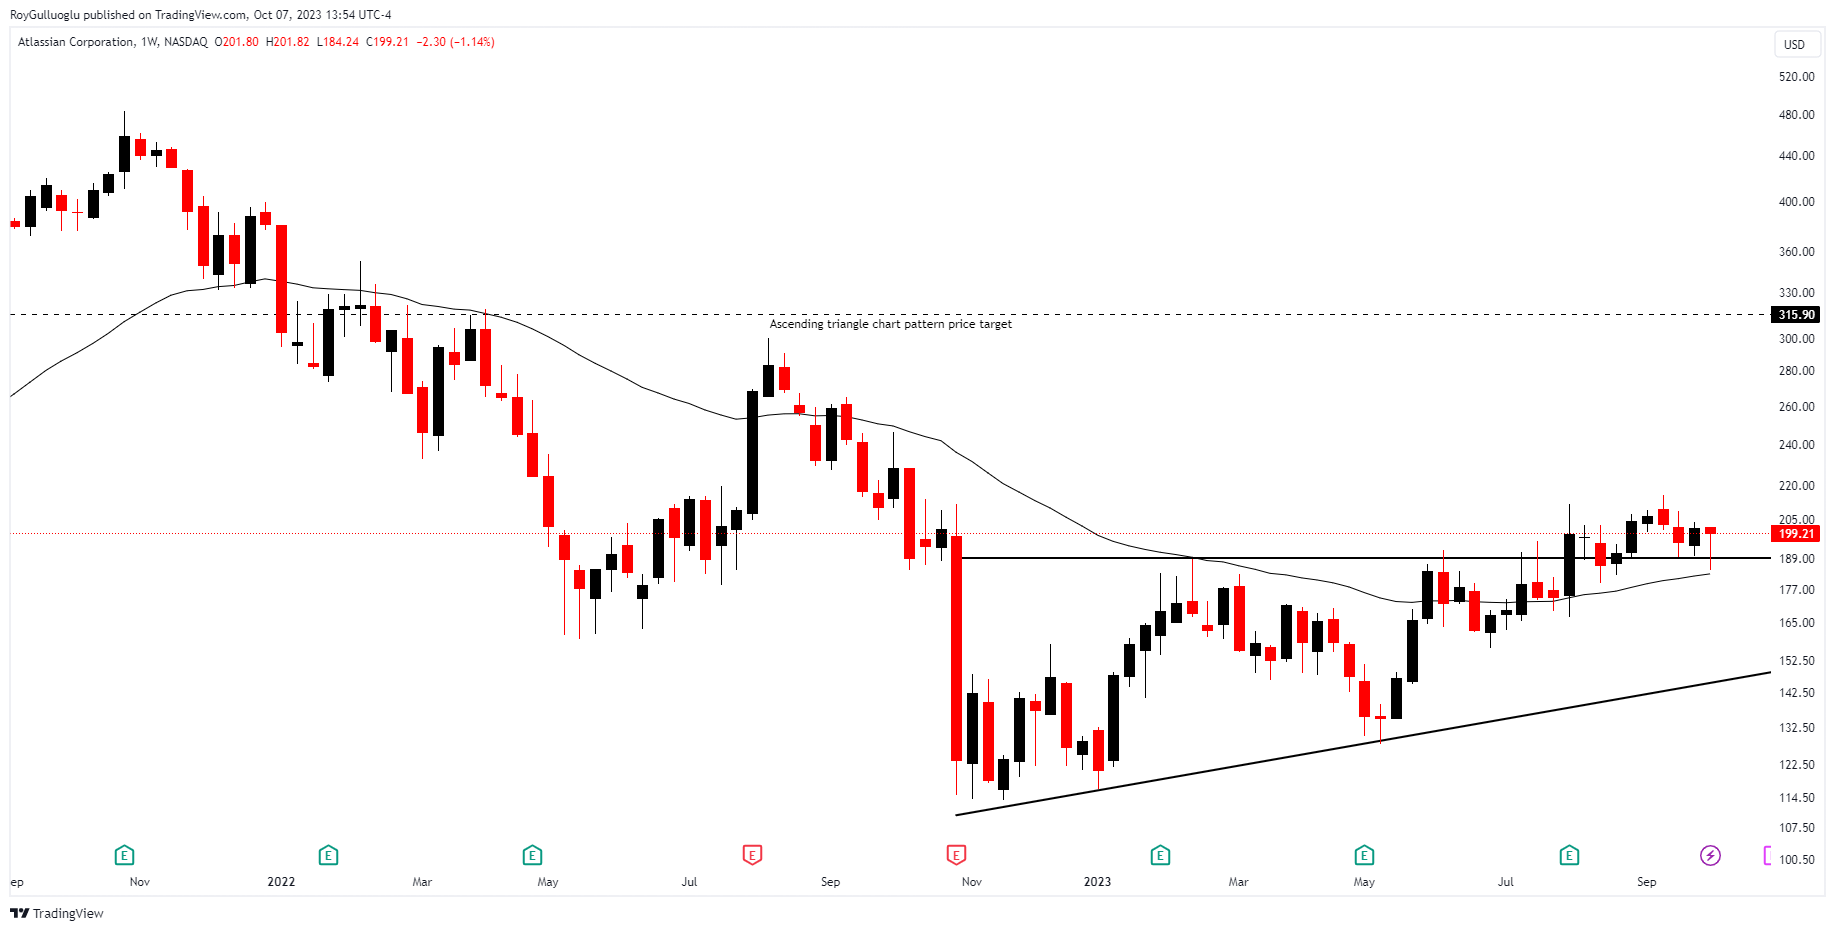
The above weekly chart formed an approximately 9-month-long Ascending triangle chart pattern as a bullish reversal after a downtrend, with resistance at 189.1$ levels.
A daily close above 195$ level has already validated the breakout from the 9-month-long Ascending triangle chart pattern.
The price pulled back to its 40-week moving average and the support level of 189.1$ level. This might provide an opportunity to enter a position.
This breakout could potentially result in a chart pattern target of 315.9$ levels.
ALKT - Long Idea
Alkami Technology, Inc. offers a cloud-based digital banking platform to serve banks and credit unions in the United States. The company's platform allows financial institutions to onboard and engage new users, accelerate revenues, and enhance operational efficiency, with the support of a proprietary, cloud-based, multi-tenant architecture.
The GICS sector classification of the company is `information technology`.
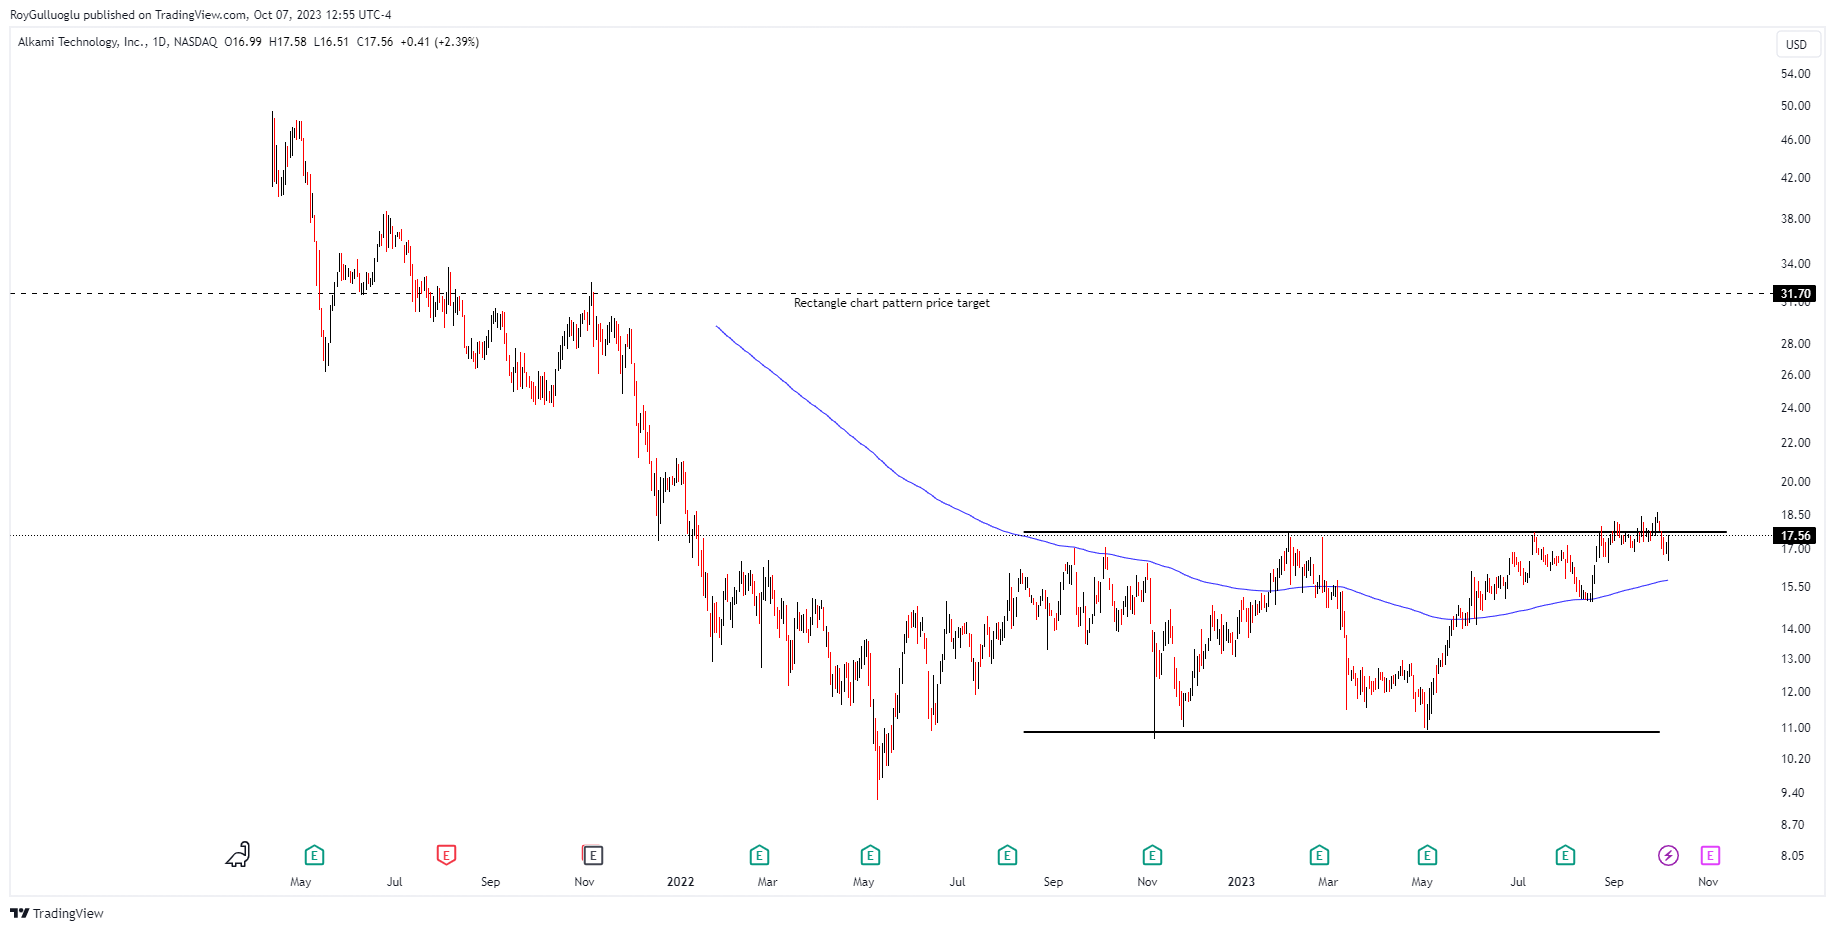
The above daily chart formed an approximately 10-month-long Rectangle chart pattern as a bullish reversal after a downtrend, with resistance at 17.69$ levels.
A daily close above 17.75$ levels would validate the breakout from the 10-month-long Rectangle chart pattern.
This breakout could potentially result in a chart pattern target of 31.7$ levels.
EG- Long Idea
Everest Group is a research firm focused on strategic IT, business services, engineering services, and sourcing.
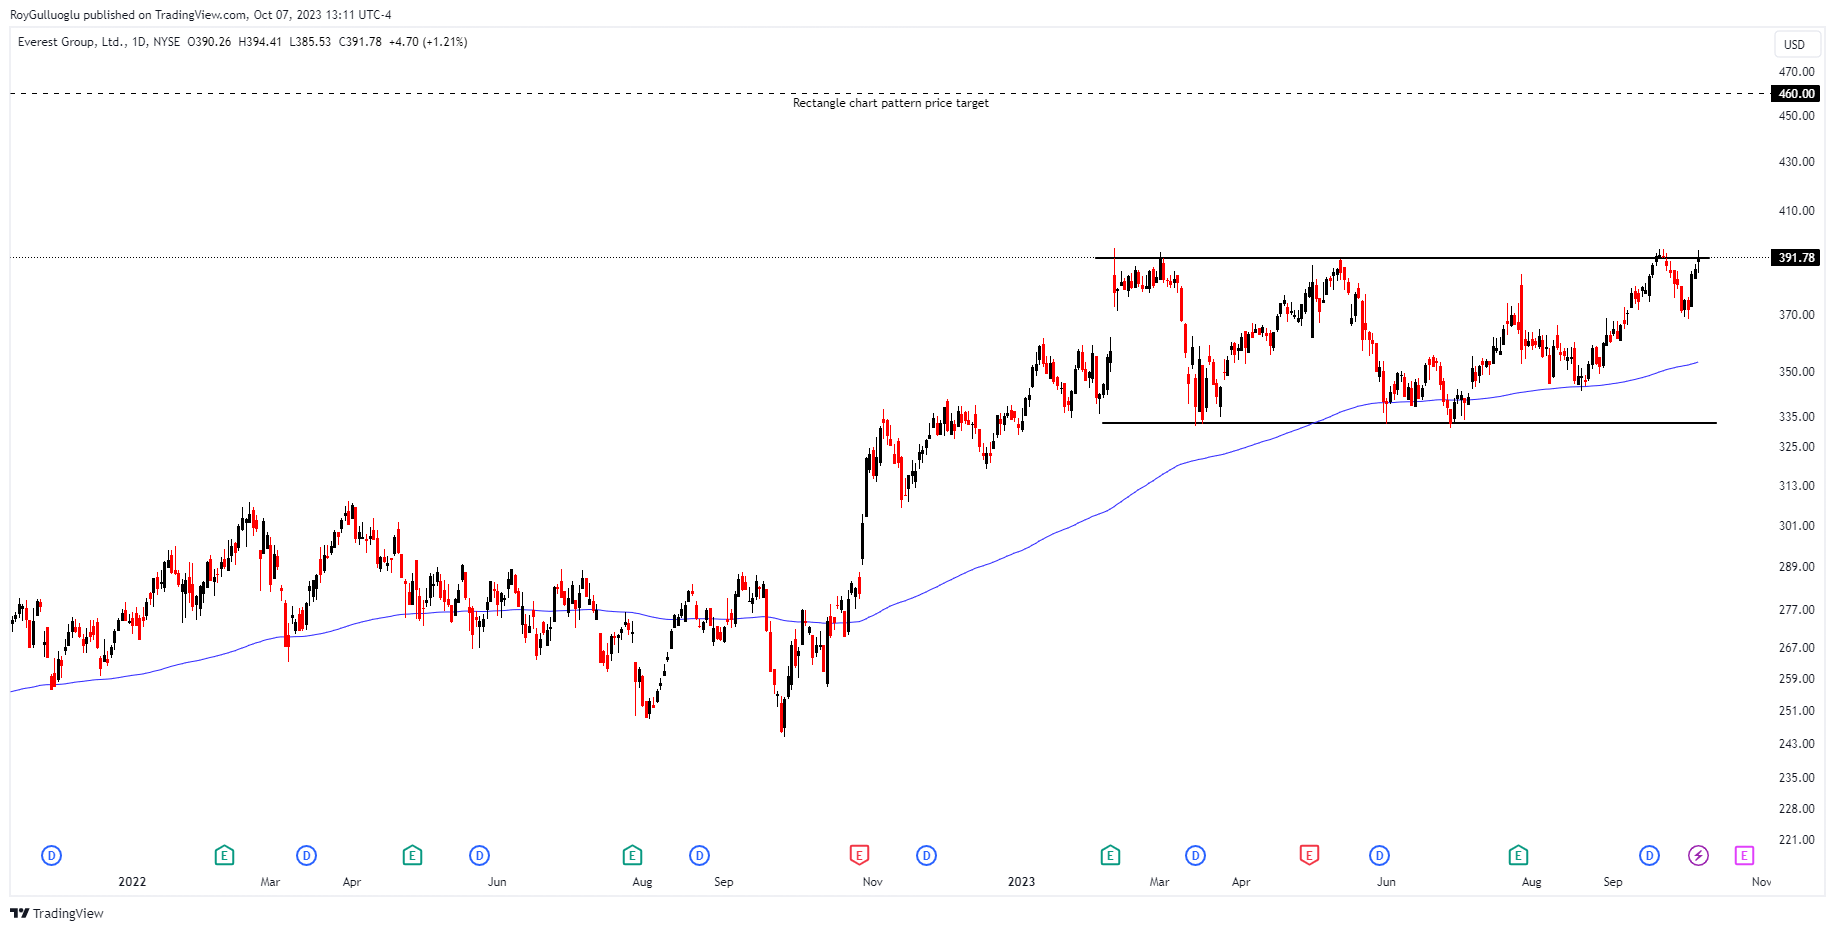
The above daily chart formed an approximately 5-month-long Rectangle chart pattern as a bullish continuation after an uptrend, with resistance at 391.21$ levels.
A daily close above 399$ levels would validate the breakout from the 5-month-long Rectangle chart pattern.
This breakout could potentially result in a chart pattern target of 460$ levels.
AEFES- Long Idea
Anadolu Efes, together with its subsidiaries, engages in the production, bottling, marketing, distribution, and sale of beer, malt, and non-alcoholic beverages. It operates in three segments: Turkey Beer, International Beer, and Soft Drinks.
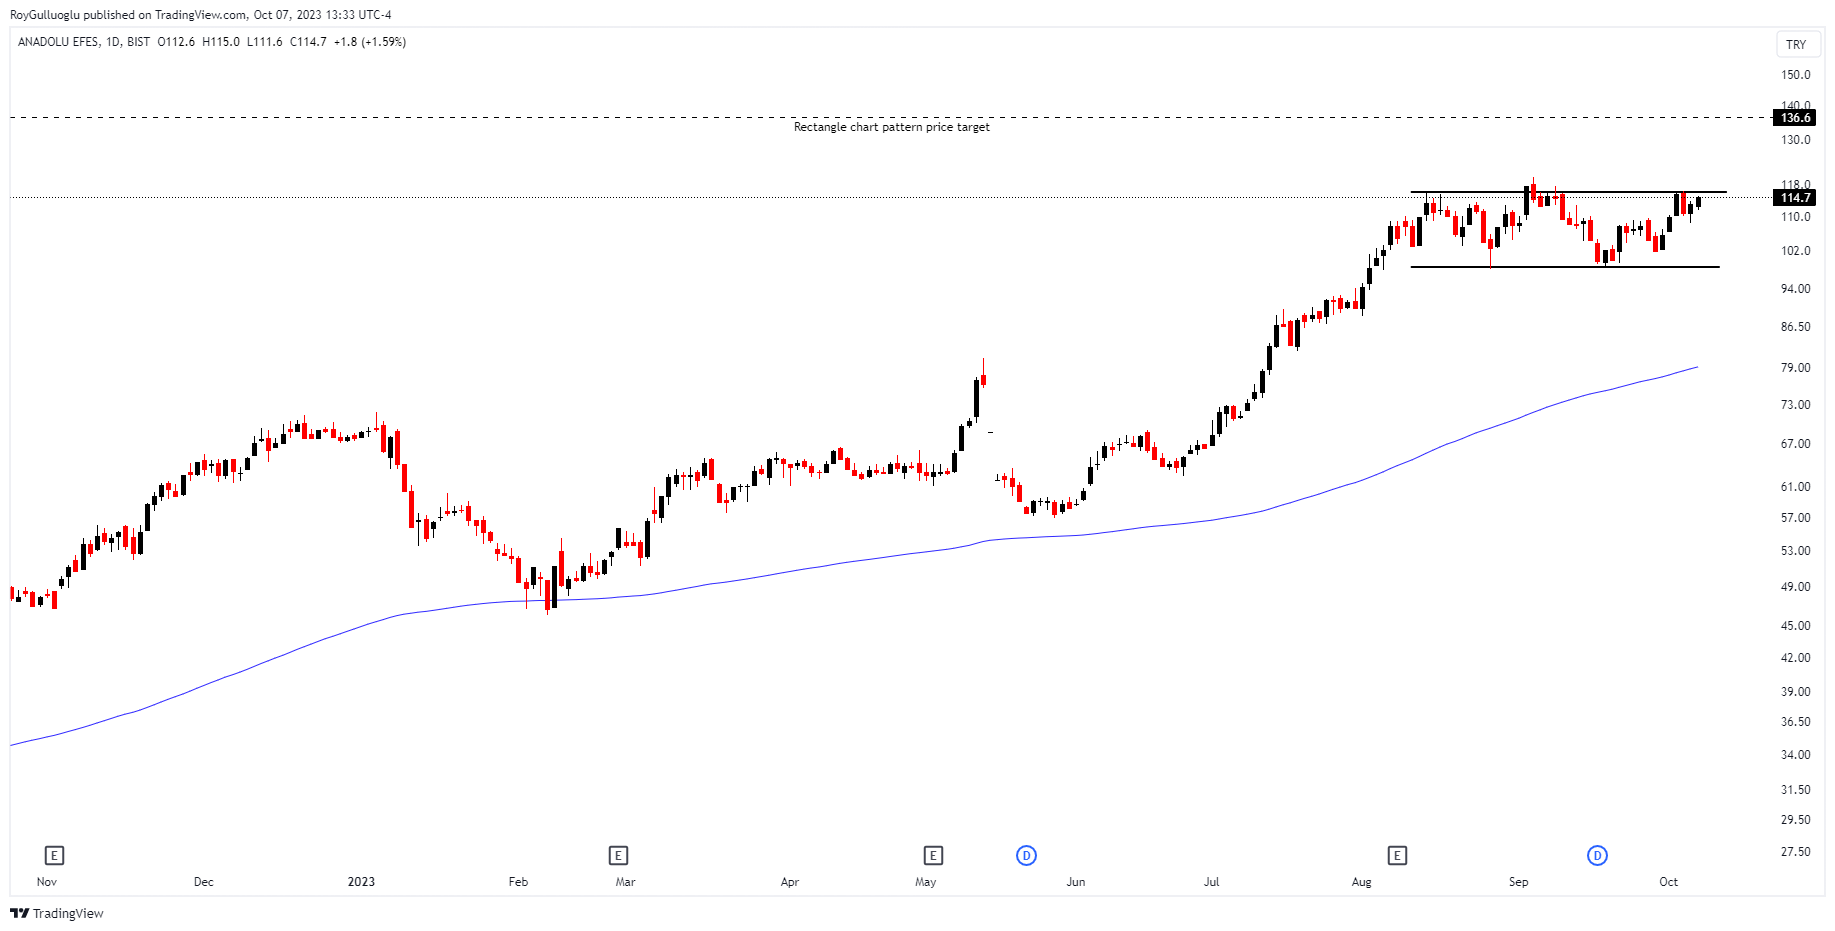
The above daily chart formed an approximately 2-month-long Rectangle chart pattern as a bullish continuation after an uptrend, with resistance at 116.1 TRY levels.
A daily close above 121.34 TRY levels would validate the breakout from the 2-month-long Rectangle chart pattern.
This breakout could potentially result in a chart pattern target of 136.6 TRY levels.
TOASO - Long Idea
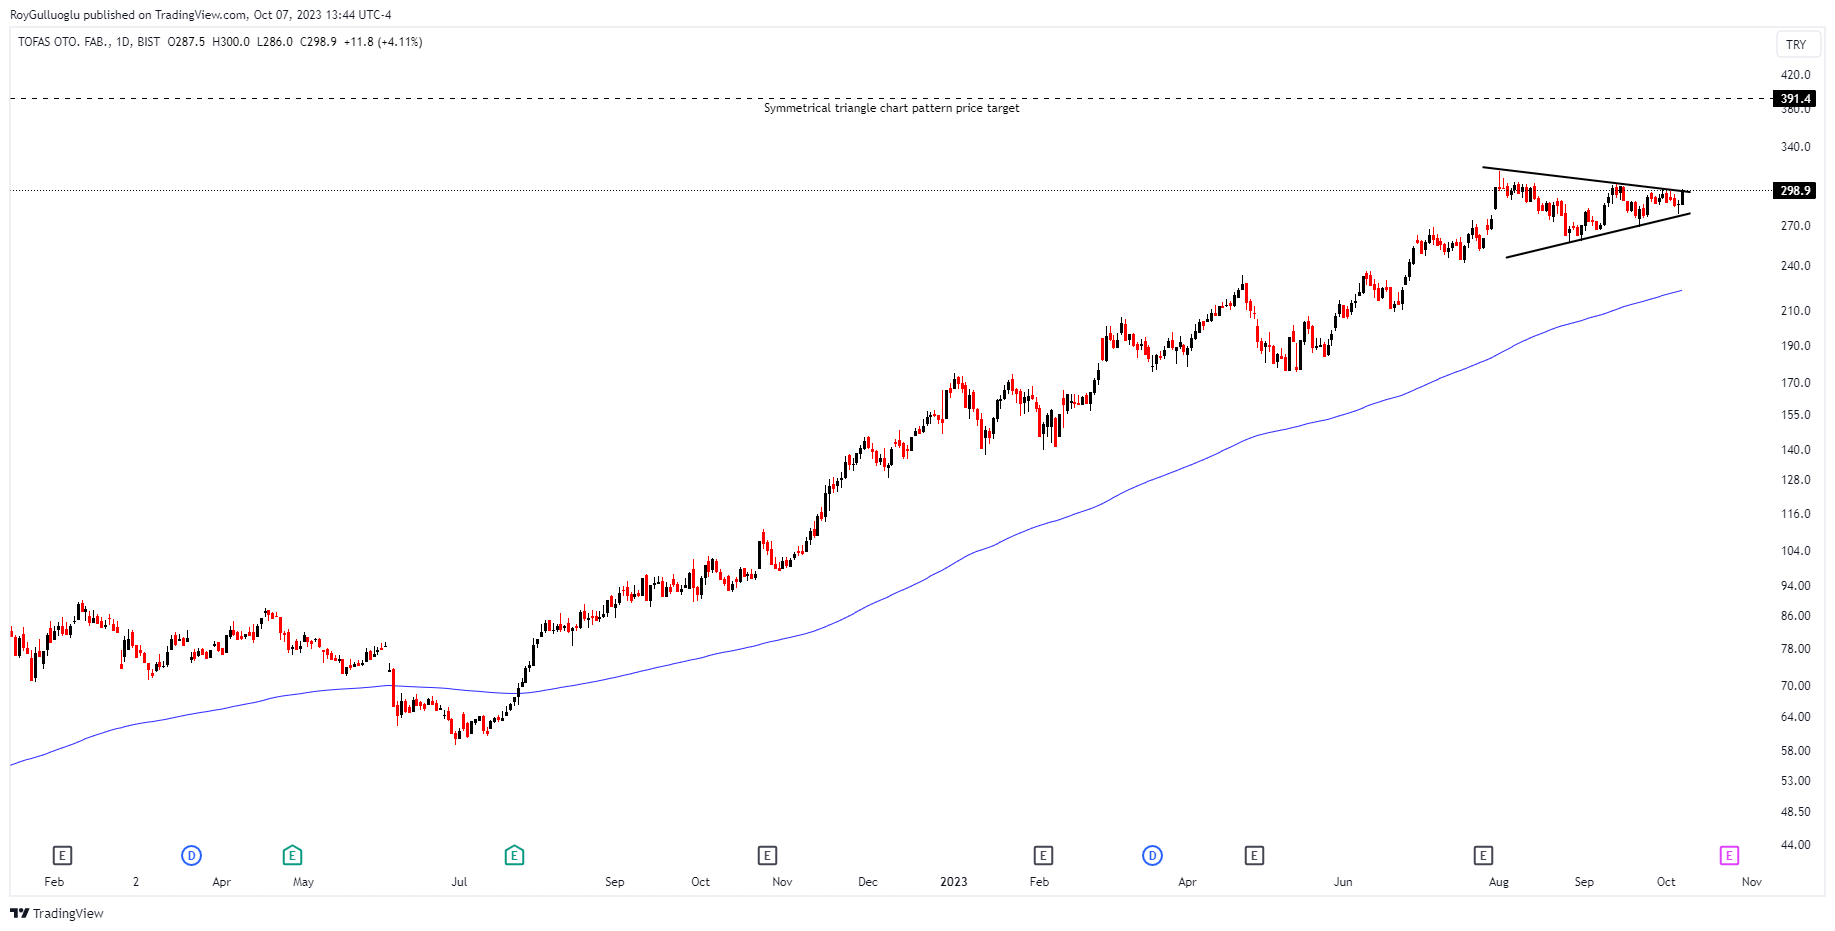
Tofas manufactures and sells passenger cars and light commercial vehicles in Turkey. It also produces and trades in automotive spare parts; and provides consumer financing services.
The GICS sector classification of the company is `Consumer Discretionary`.
The above daily chart formed an approximately 2-month-long Symmetrical triangle chart pattern as a bullish continuation after an uptrend, with resistance at 299 TRY levels.
A daily close above 310.3 TRY levels would validate the breakout from the 2-month-long Symmetrical triangle chart pattern.
This breakout could potentially result in a chart pattern target of 391.4 TRY levels.
BTCUSDT- Long Idea
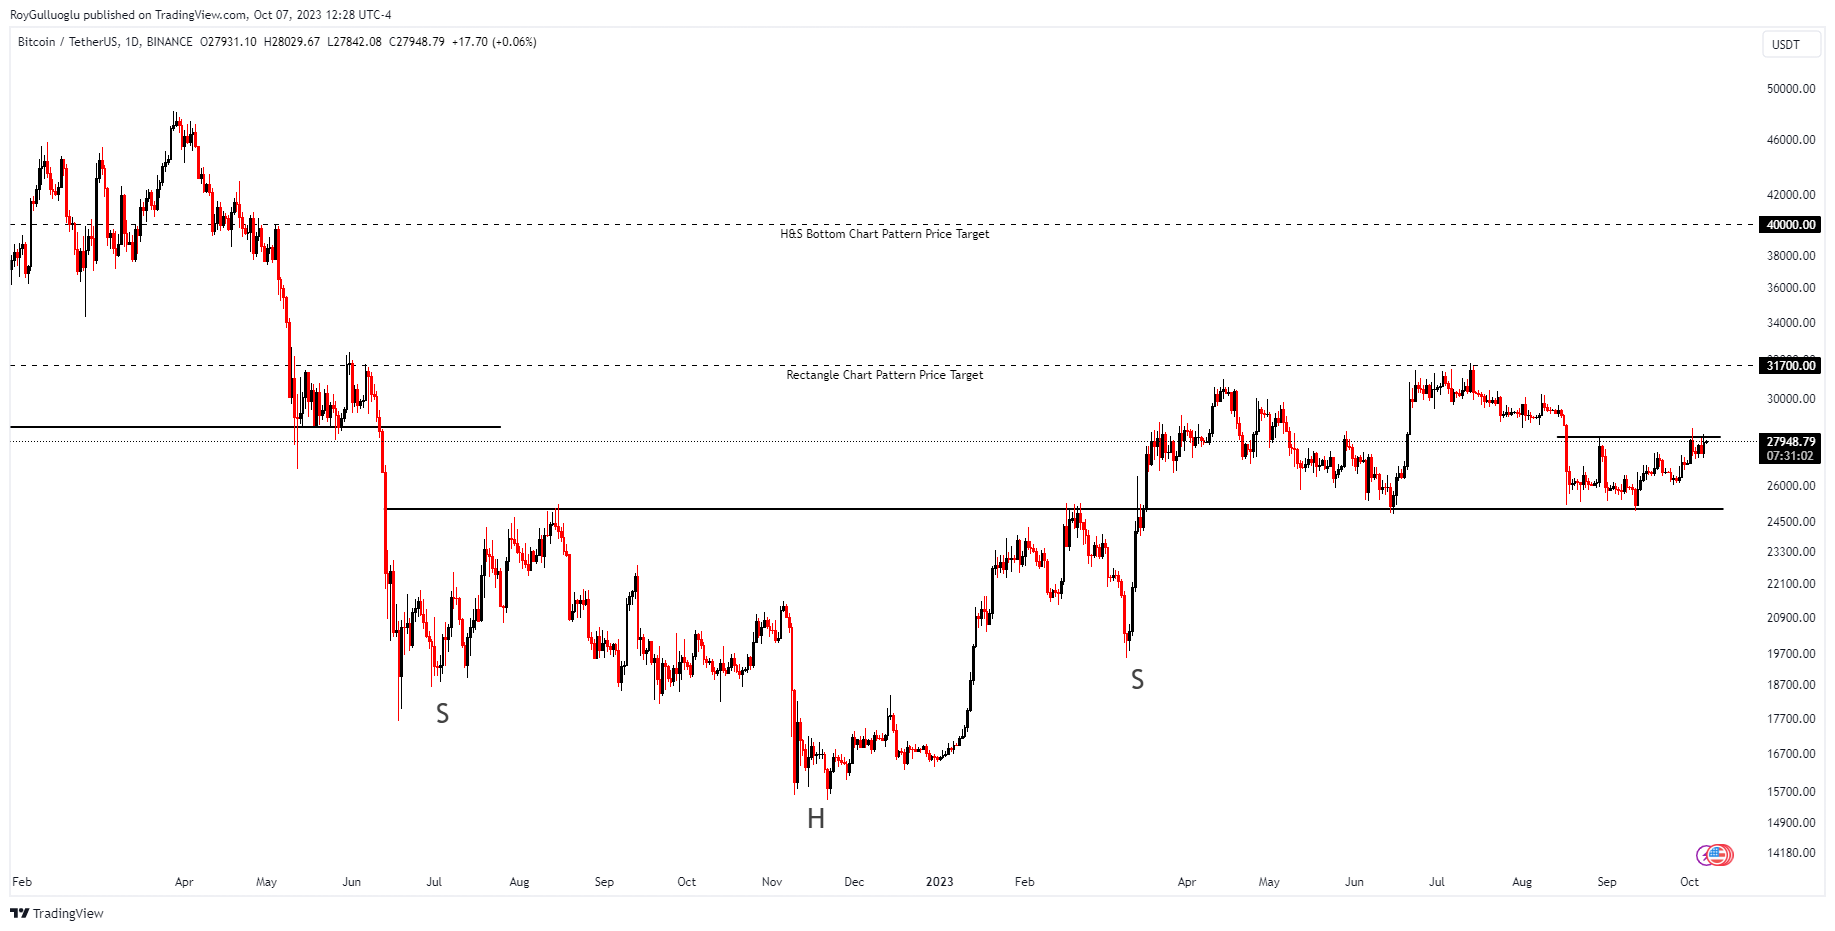
The above daily chart formed an approximately 2-month-long Rectangle triangle chart pattern as a bullish reversal after a downtrend, with resistance at 28150$ levels.
A daily close above 28800$ level would validate the breakout from the Rectangle triangle chart pattern.
This breakout could potentially result in a chart pattern target of 31700$ levels.
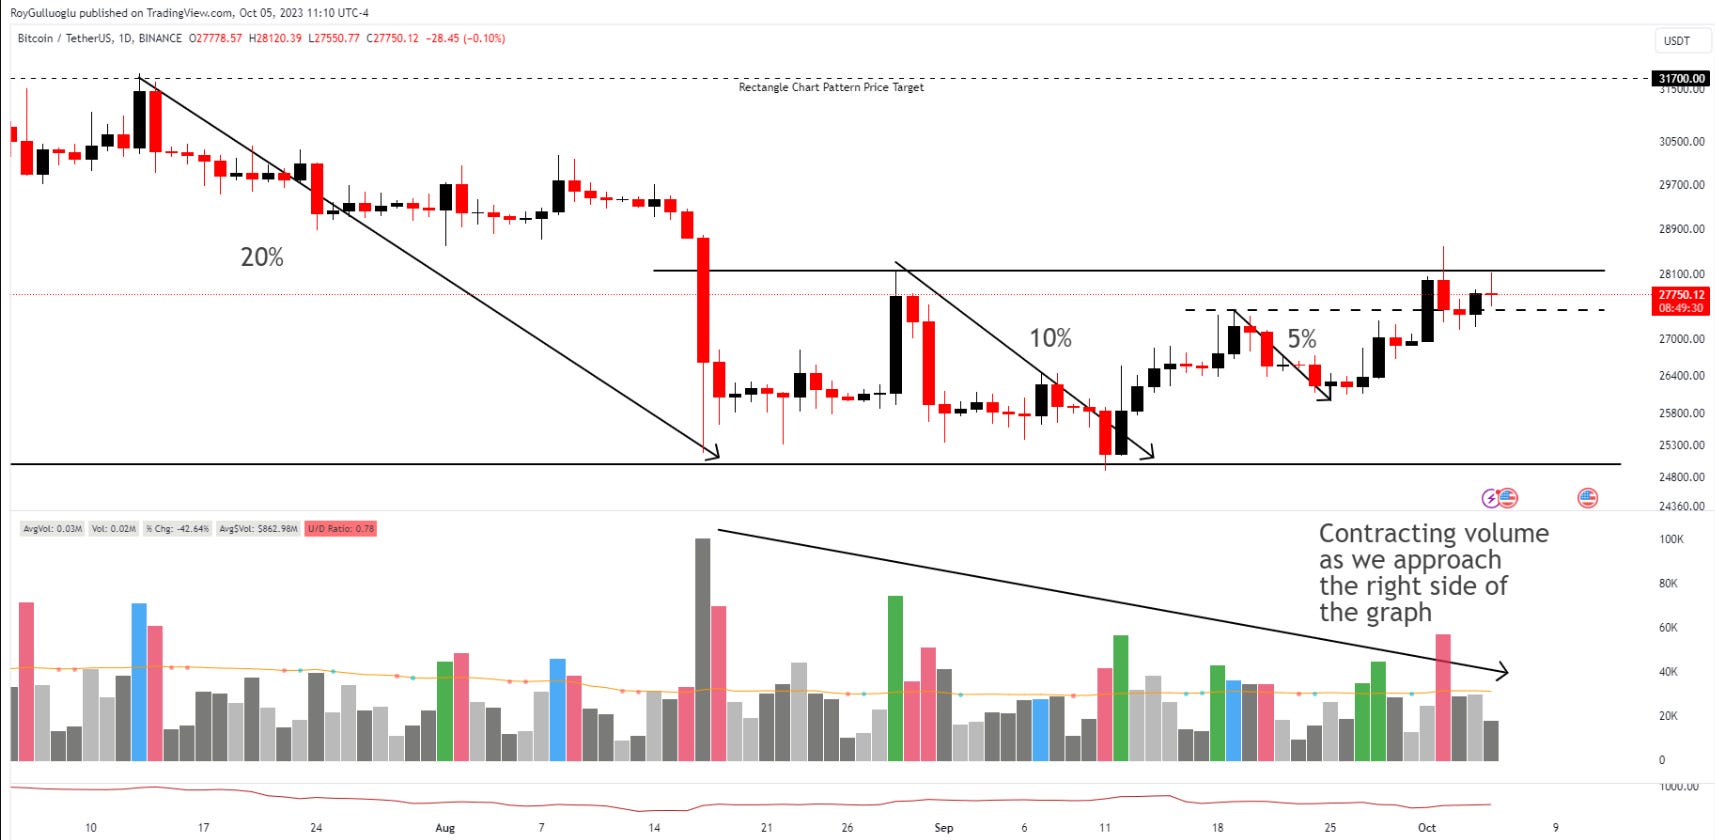
As we have experienced many times, Cryptocurrencies might not act like risky assets that are negatively correlated with rising yields. Seeing the BTC holding well at 25K levels could be considered a sign of strength especially in an environment where the yields are rocketing.
Also, it seems like a VCP(Volatility contraction pattern) has been formed. As the volume contracts to the right-hand side of the graph, price contraction decreases.

Follow-ups
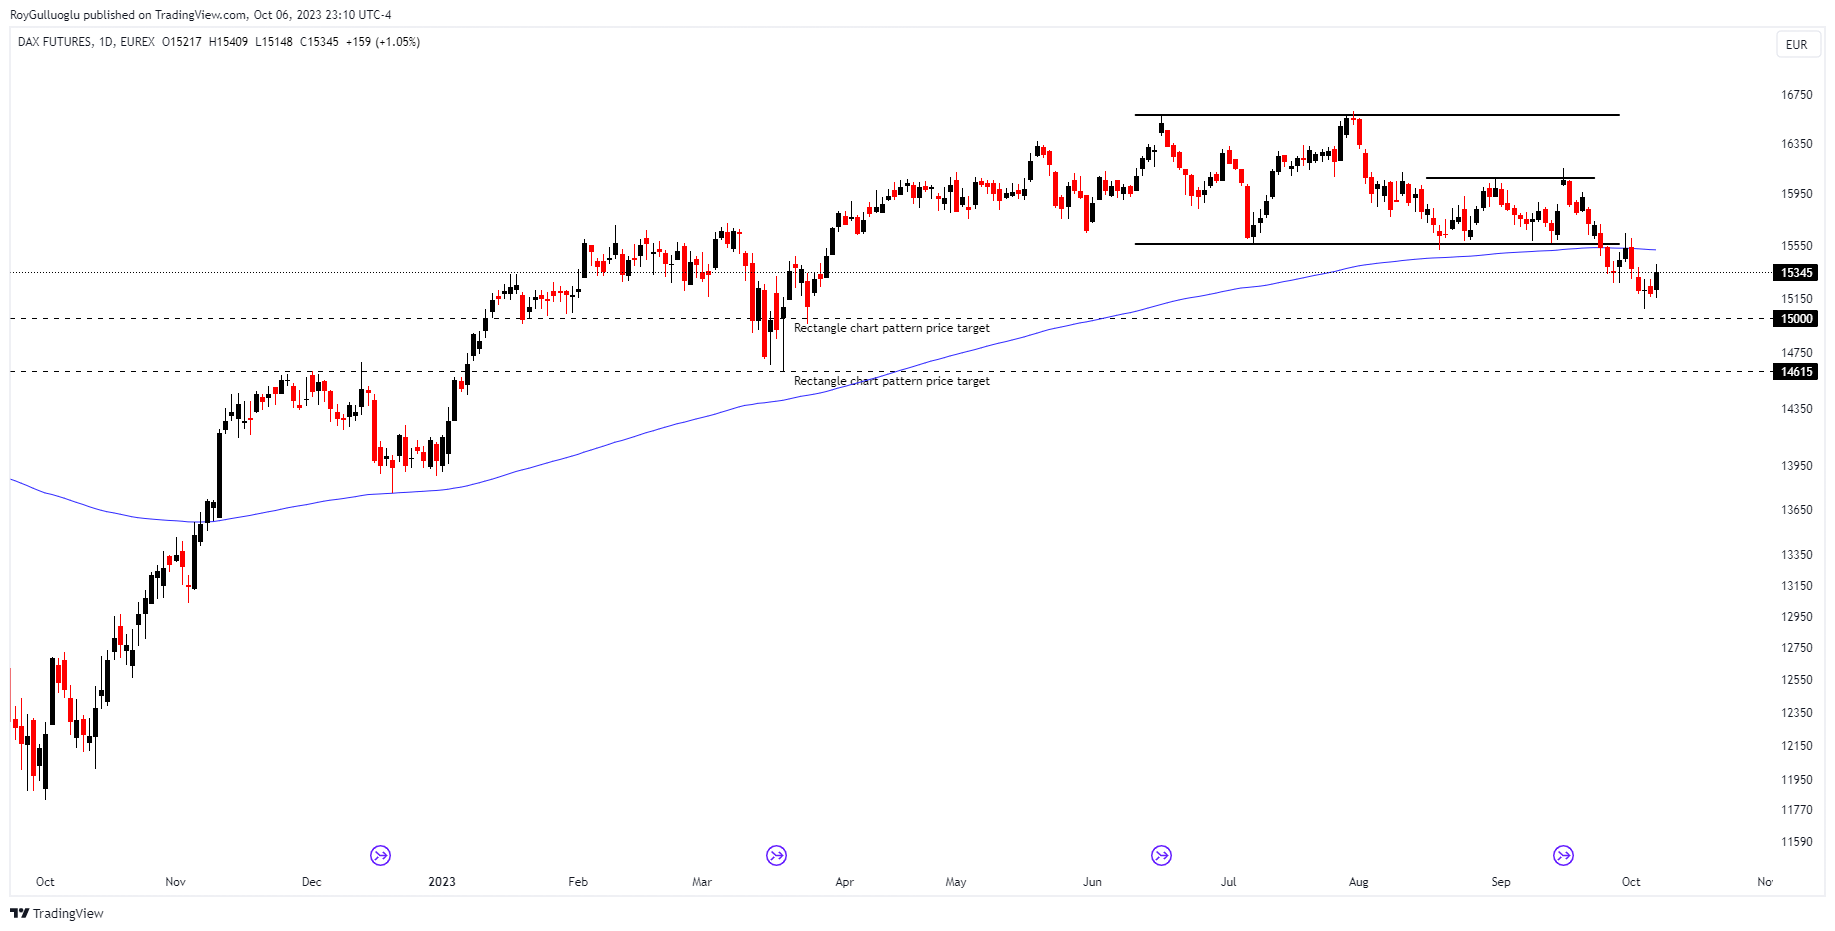
FDAX1! - Short Idea
You can click on the FDAX1! ticker above to access the first report explaining the RATIONALE behind the trade idea.
The above daily chart formed an approximately 3-month-long Rectangle chart pattern as a bearish reversal after an uptrend, with support at 15560 levels.
A daily close below 15400 levels would validate the breakdown from the 3-month-long Rectangle chart pattern. The price broke down below the 200-day EMA which is my filter for entering short positions.
This breakdown could potentially result in a chart pattern target of 14615 levels.
Thanks to growth-related concerns in the Euro area and the recent US bond yield price action the trade idea seems like played well but it has not reached its price target yet.
KBH - Short Idea
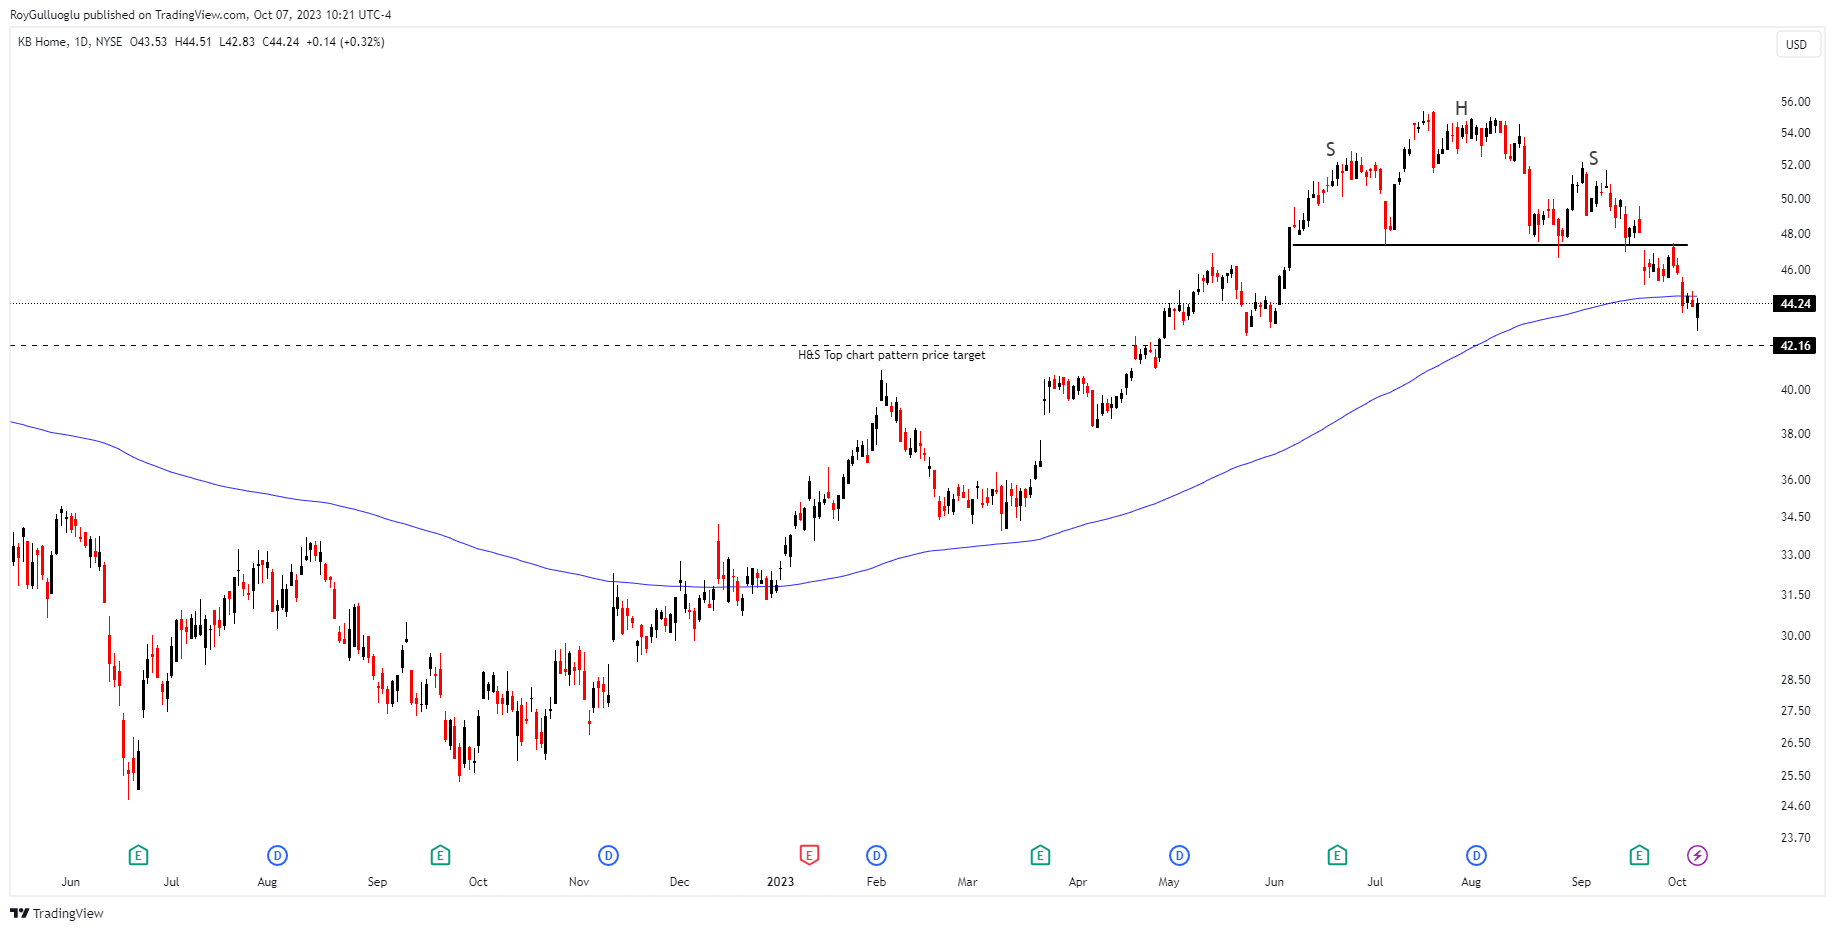
You can click on the KBH ticker above to access the first report explaining the RATIONALE behind the trade idea.
The trading signal was given when the price pulled back to the support of the H&S Top chart pattern.
Since then the bearish movement resumed and broke down the 200 day-EMA which is known as a significant trend filter.
KBH is in the residential construction industry which is very sensitive to yield movements. The driver behind the bearish movement is mainly the upward momentum of the long-term US treasury yields.
At the weekly close of the stock market, the equities became insensitive to the US yield movement and SPX closed 1.18% higher daily in Magnificant 7`s lead.
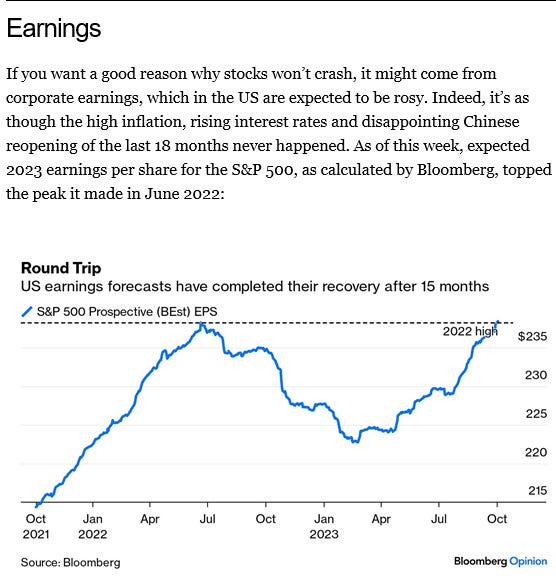
Considering the headline Nonfarm payroll data it is not easy to understand the equities` reaction at the weekly close. Recently, the main discourse of the market has been `good data-bad pricing` because good data for the economy such as headline non-farm payroll data provides FED more room to hike and a potential increase in the yields would harm the equities. But…

One reason could be the positive expectation of Q4 2023 earnings expectations as stated in the article by John Authers
Another reason could be the some details of the non-farm data such as stated in the tweet below,

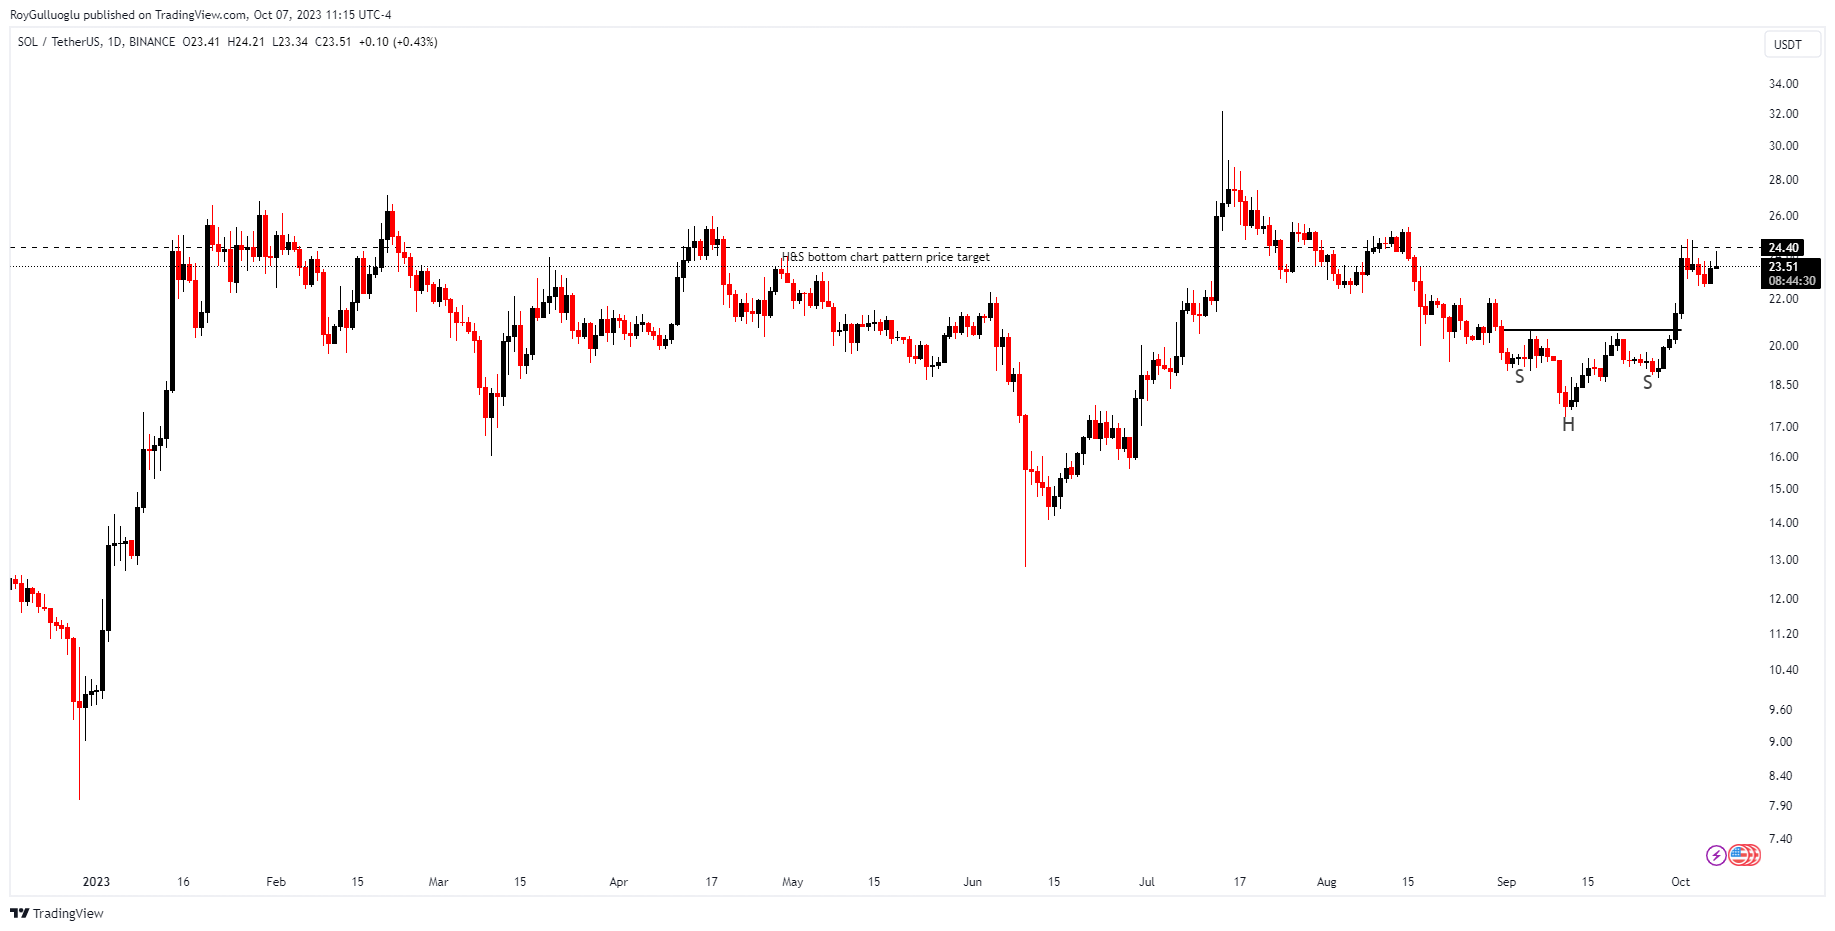
SOLUSDT - Long Idea
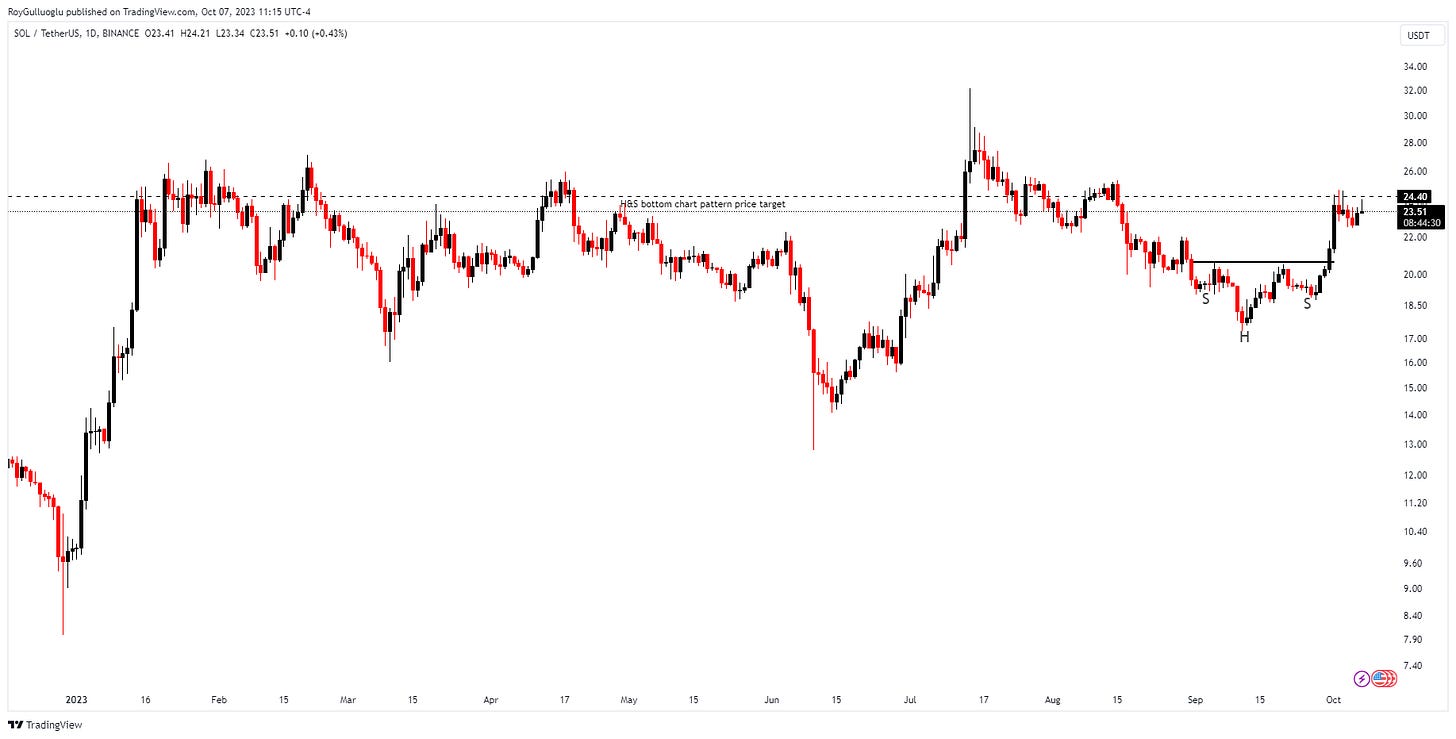
You can click on the SOLUSDT ticker above to access the first report explaining the RATIONALE behind the trade idea.
The trading signal was given before the breakout, then the price reached the H&S bottom chart pattern price target.


GE- Long/Short Idea
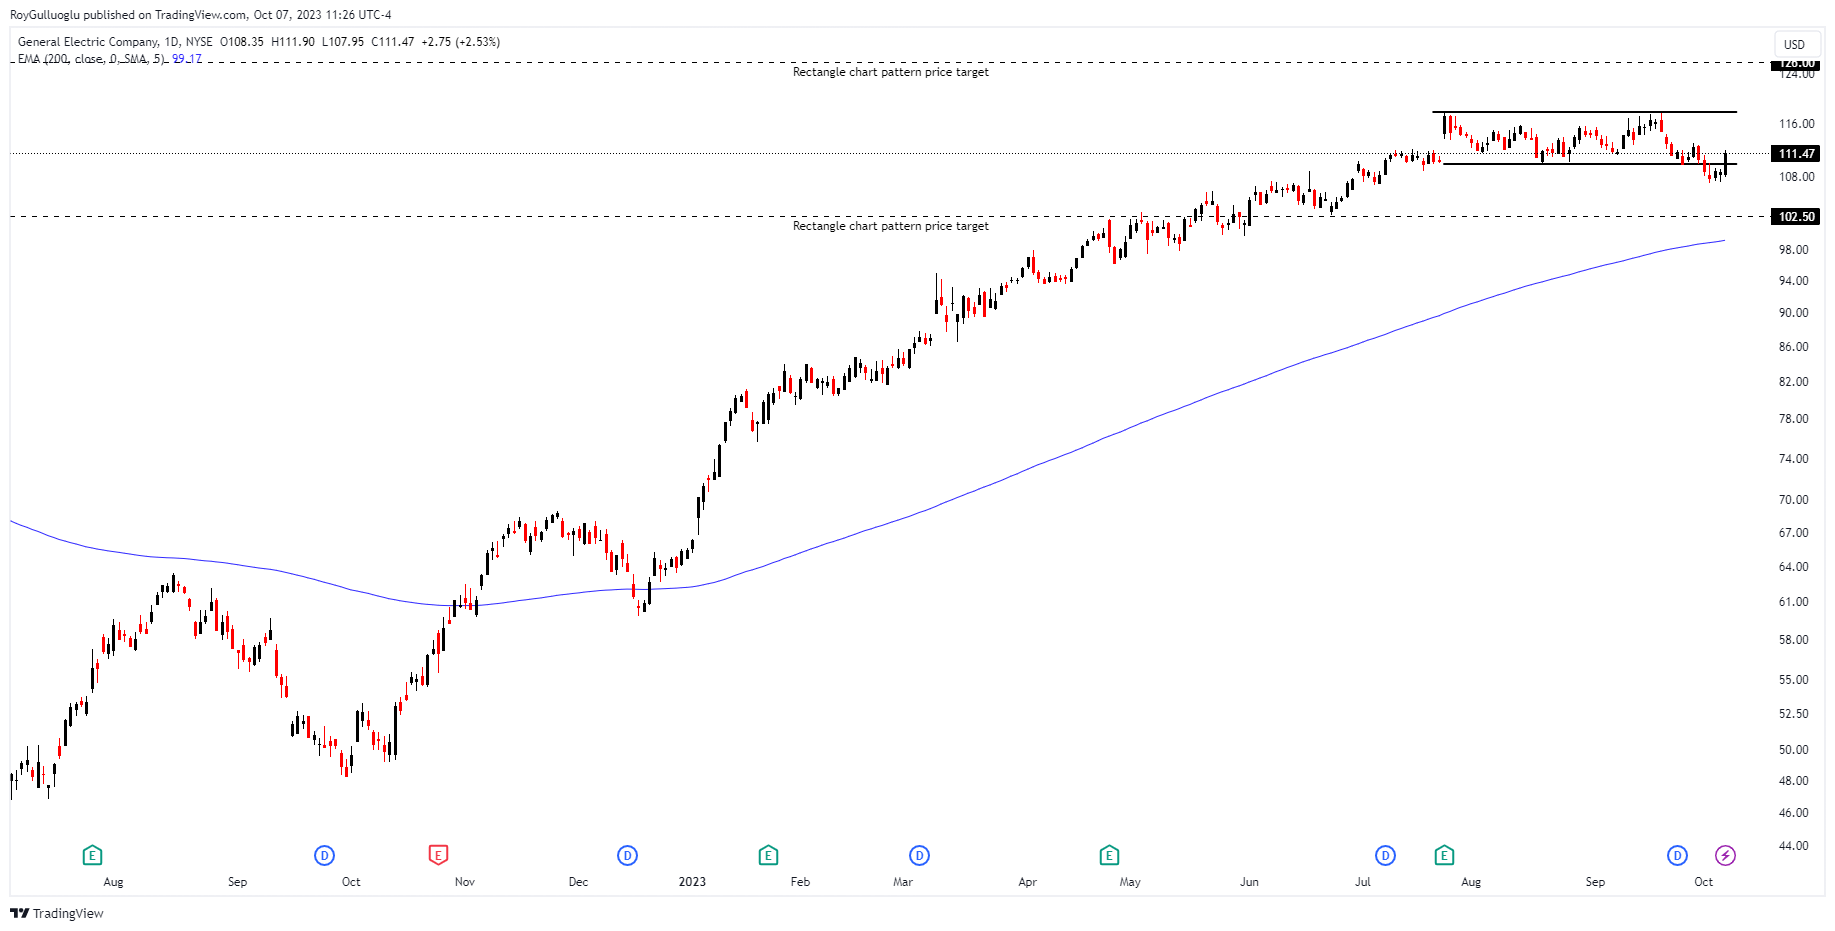
You can click on the GE ticker above to access the first report explaining the RATIONALE behind the trade idea.
GE is a two-way trade idea depending on the direction of the breakout from the rectangle chart pattern.
It failed to break down the support level of 109.9$ and got back into the range.
Since the chart pattern established well above the 200-day moving average, I need to reconsider a potential bearish play. Also, the length of the chart pattern is not that convincing relative to the other opportunities.
Another great report, Roy. Can you remind me how you calculate the RATIONALE's breakout confirmation levels? The daily close levels cited don't seem to use a standard % move from the boundary. Are they based on an Average True Range? Thanks