

New setups
UnitedHealth Group Incorporated-(UNH/NYSE)-Long Idea
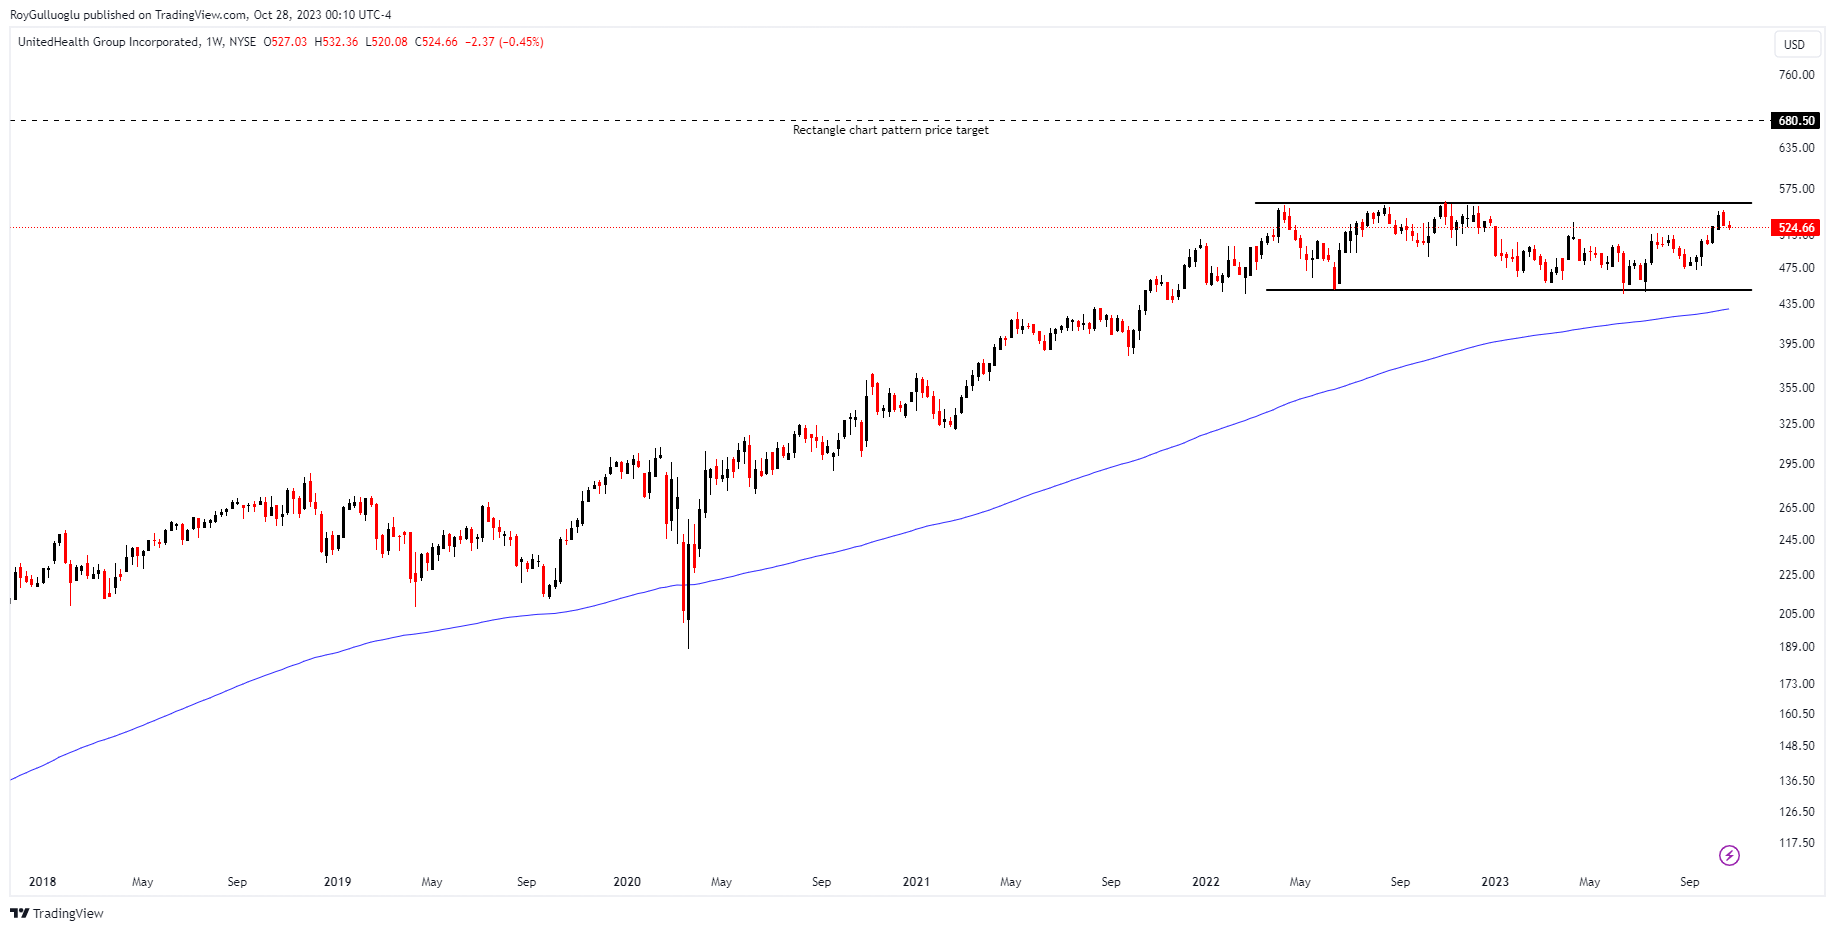
UnitedHealth Group Inc. is a diversified healthcare company in the United States. It designs products, provides services, and applies technologies that improve access to health and well-being services, and make health care more affordable.
The above weekly chart formed an approximately 20-month-long rectangle chart pattern as a bullish continuation after an uptrend.
Within this pattern, the horizontal boundary at 555 levels acts as strong resistance.
A daily close above 571.65 levels would validate the breakout from the 3-month-long rectangle chart pattern.
The potential price target, based on this chart pattern, is 680.5 levels.
If the price moves toward the lower boundary and a potential breakdown below the 200-day-EMA occurs, a short trade idea could be evaluated.
UNH, classified under the "healthcare care" sector, falls under the “Mid Cap - Value” stock category.
Healthcare stocks are considered to perform relatively better in the early recession stages of the economy due to the defensive characteristics of the sector.
The Ensign Group-(ENSG/NASDAQ)-Long Idea
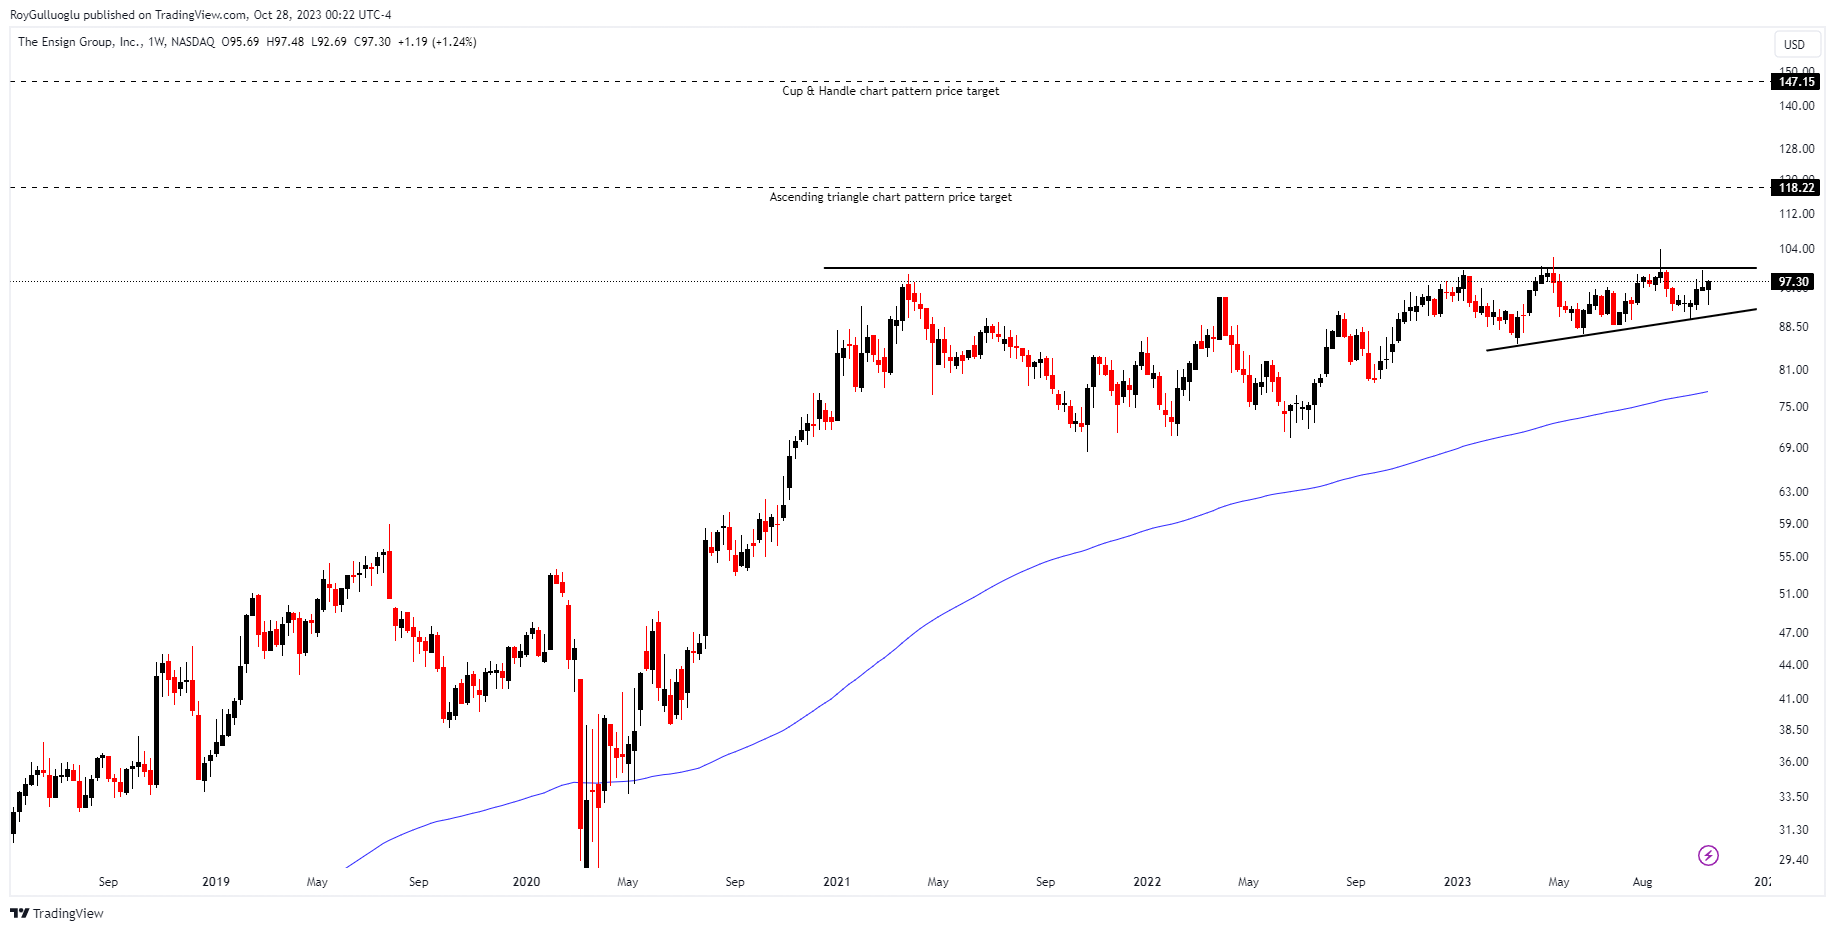
The Ensign Group Inc. provides skilled nursing and rehabilitative care services across multiple states.
The above weekly chart formed an approximately 33-month-long cup & handle and 10-month-long ascending triangle chart patterns as a bullish continuation after an uptrend.
Within this pattern, the horizontal boundary at 100 levels acts as strong resistance.
A daily close above 103 levels would validate the breakout from the 33-month-long cup & handle chart pattern.
The potential price target, based on this chart pattern, is 147.15 levels.
ENSG, classified under the "healthcare care" sector, falls under the “Mid Cap - Value” stock category.
Broadcom-(AVGO/NASDAQ)-Long Idea
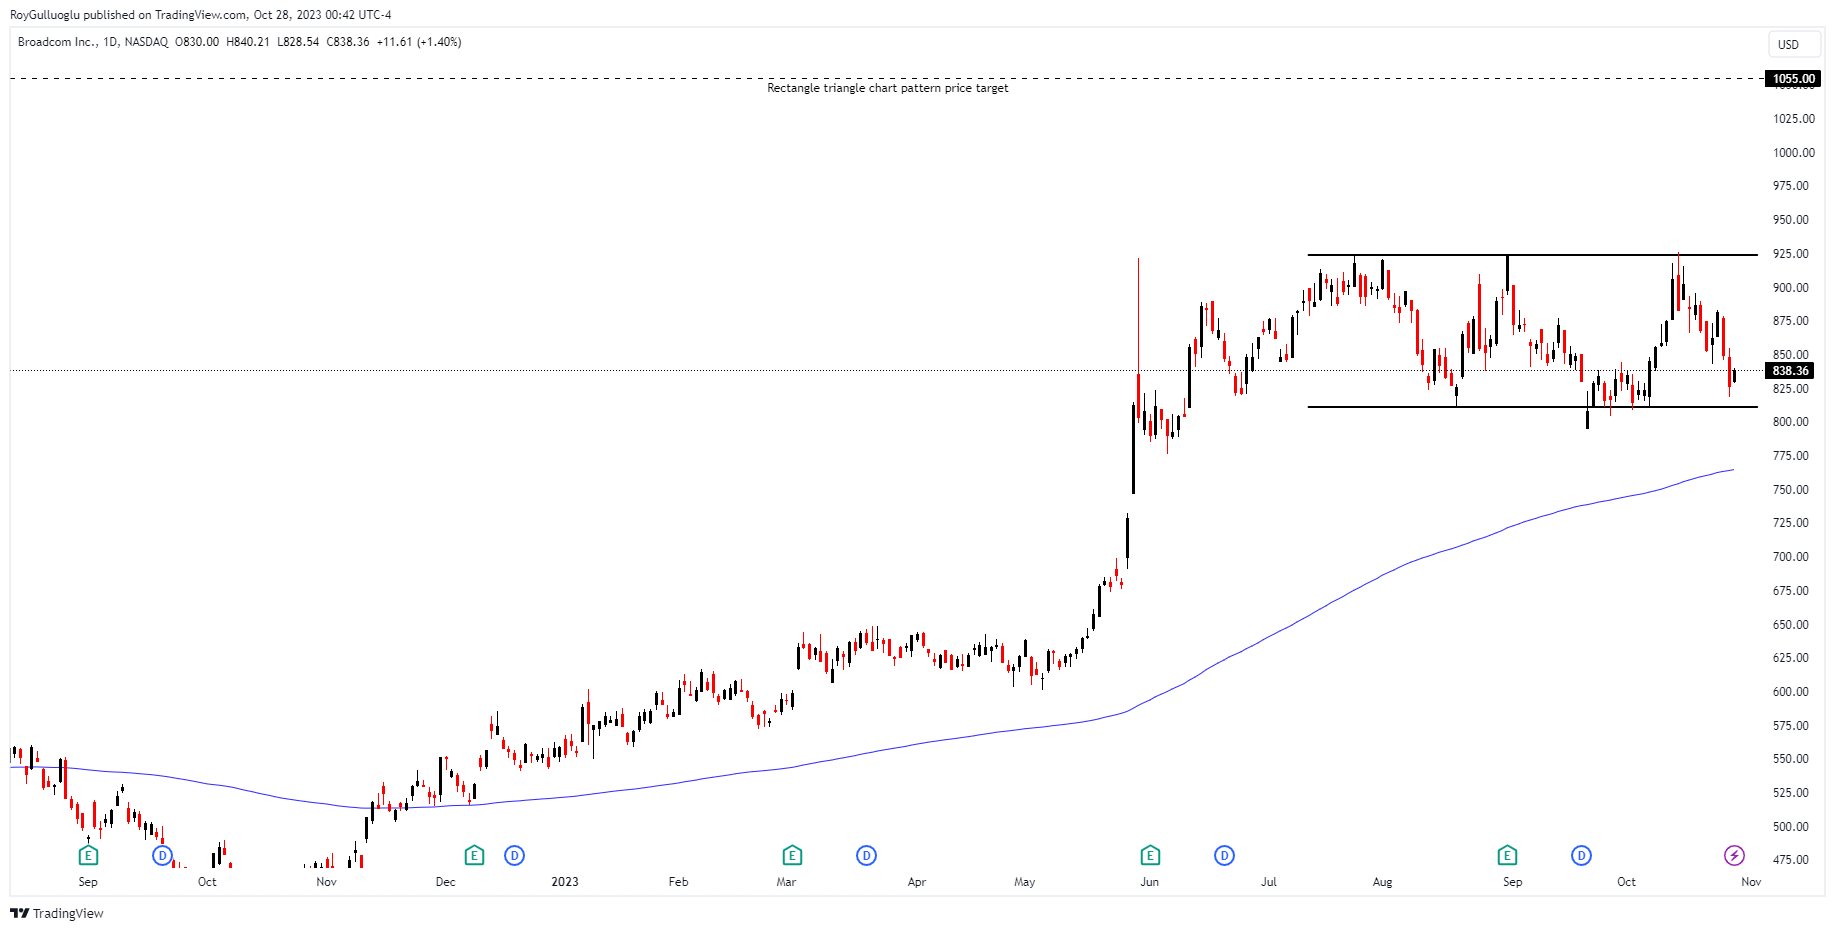
Broadcom specializes in the design, development, and provision of analog and digital semiconductor connectivity solutions. Their range of products caters to various sectors, including wired infrastructure, wireless communications, enterprise storage, industrial applications, and other related markets.
The above weekly chart formed an approximately 2-month-long rectangle chart pattern as a bullish continuation after an uptrend.
Within this pattern, the horizontal boundary at 924 levels acts as strong resistance.
A daily close above 951.72 levels would validate the breakout from the 2-month-long rectangle chart pattern.
The potential price target, based on this chart pattern, is 1055 levels.
AVGO, classified under the "technology" sector, falls under the “Large Cap - Growth” stock category.
Hilton Worldwide Holdings-(HLT/NYSE)-Long/Short Idea
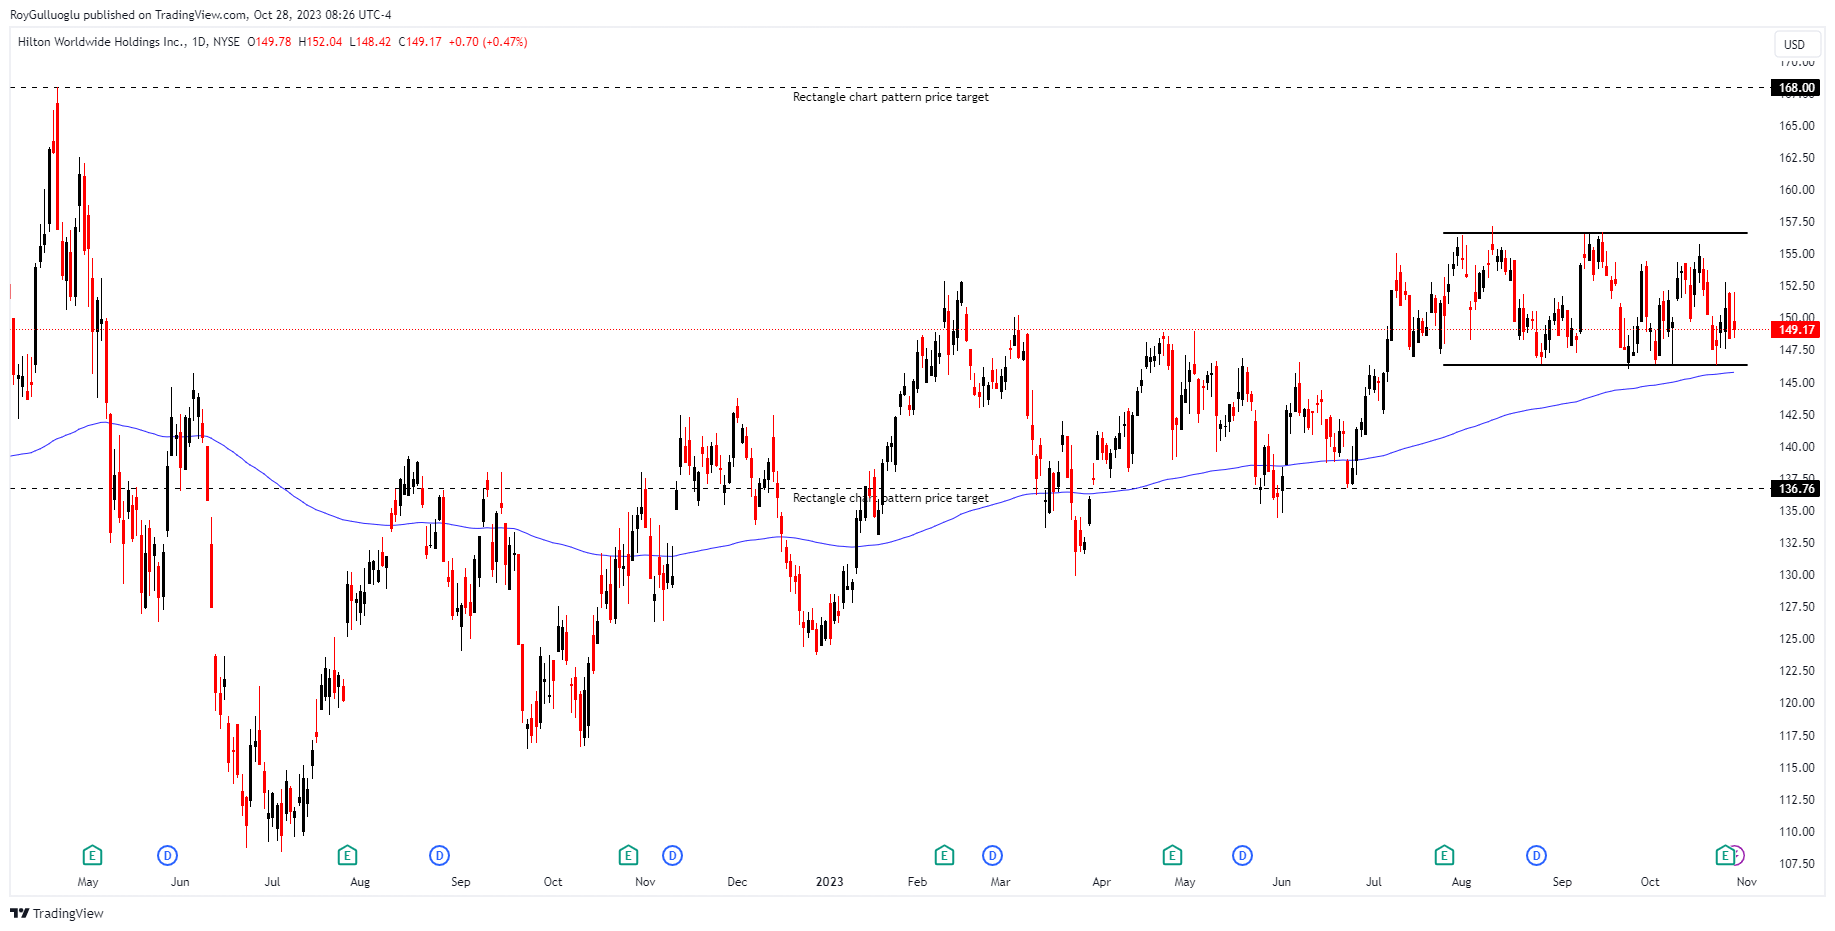
Hilton Worldwide Holdings Inc. operates hotels and resorts.
The above daily chart formed an approximately 2-month-long rectangle chart pattern which has a resistance at 156.65 levels and support at 146.34 levels.
A daily close either below 141.95 levels or above 161.35 levels would validate the breakout from the 2-month-long H&S top chart pattern.
The potential price target, based on this chart pattern, is 168 levels for the bullish scenario and 136.76 for the bearish scenario.
HLT, classified under the "consumer cyclical" sector, falls under the “Large Cap - Growth” stock category.
Wyndham Hotels & Resorts-(WH/NYSE)-Long Idea
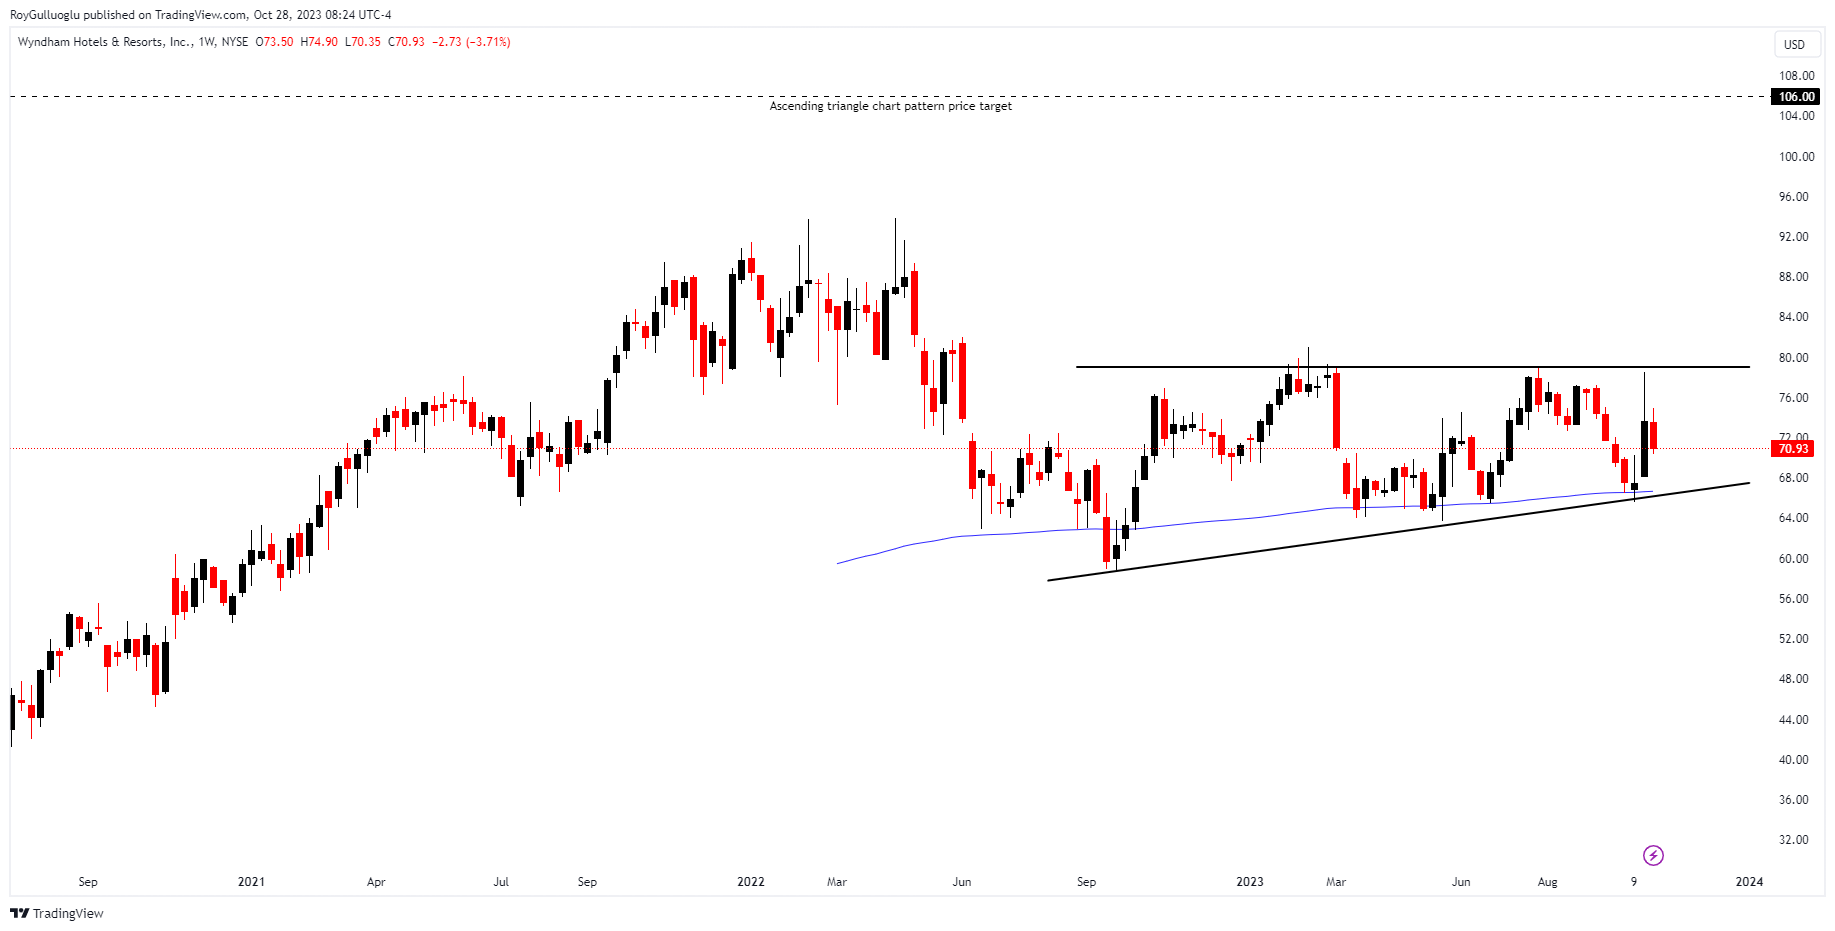
Wyndham Hotels & Resorts Inc. operates as a hotel franchising company with a global presence. They have a network of over 8,400 affiliated hotels situated in more than 80 countries.
The above weekly chart formed an approximately 14-month-long ascending triangle chart pattern as a bullish reversal after a downtrend.
Within this pattern, the horizontal boundary at 79 levels acts as strong resistance.
A daily close above 81.37 levels would validate the breakout from the 14-month-long ascending triangle chart pattern.
The potential price target, based on this chart pattern, is 106 levels.
WH, classified under the "consumer cyclical" sector, falls under the “Mid Cap - Growth” stock category.
Asian Paints Ltd-(ASIANPAINT/NSE) - Long Idea
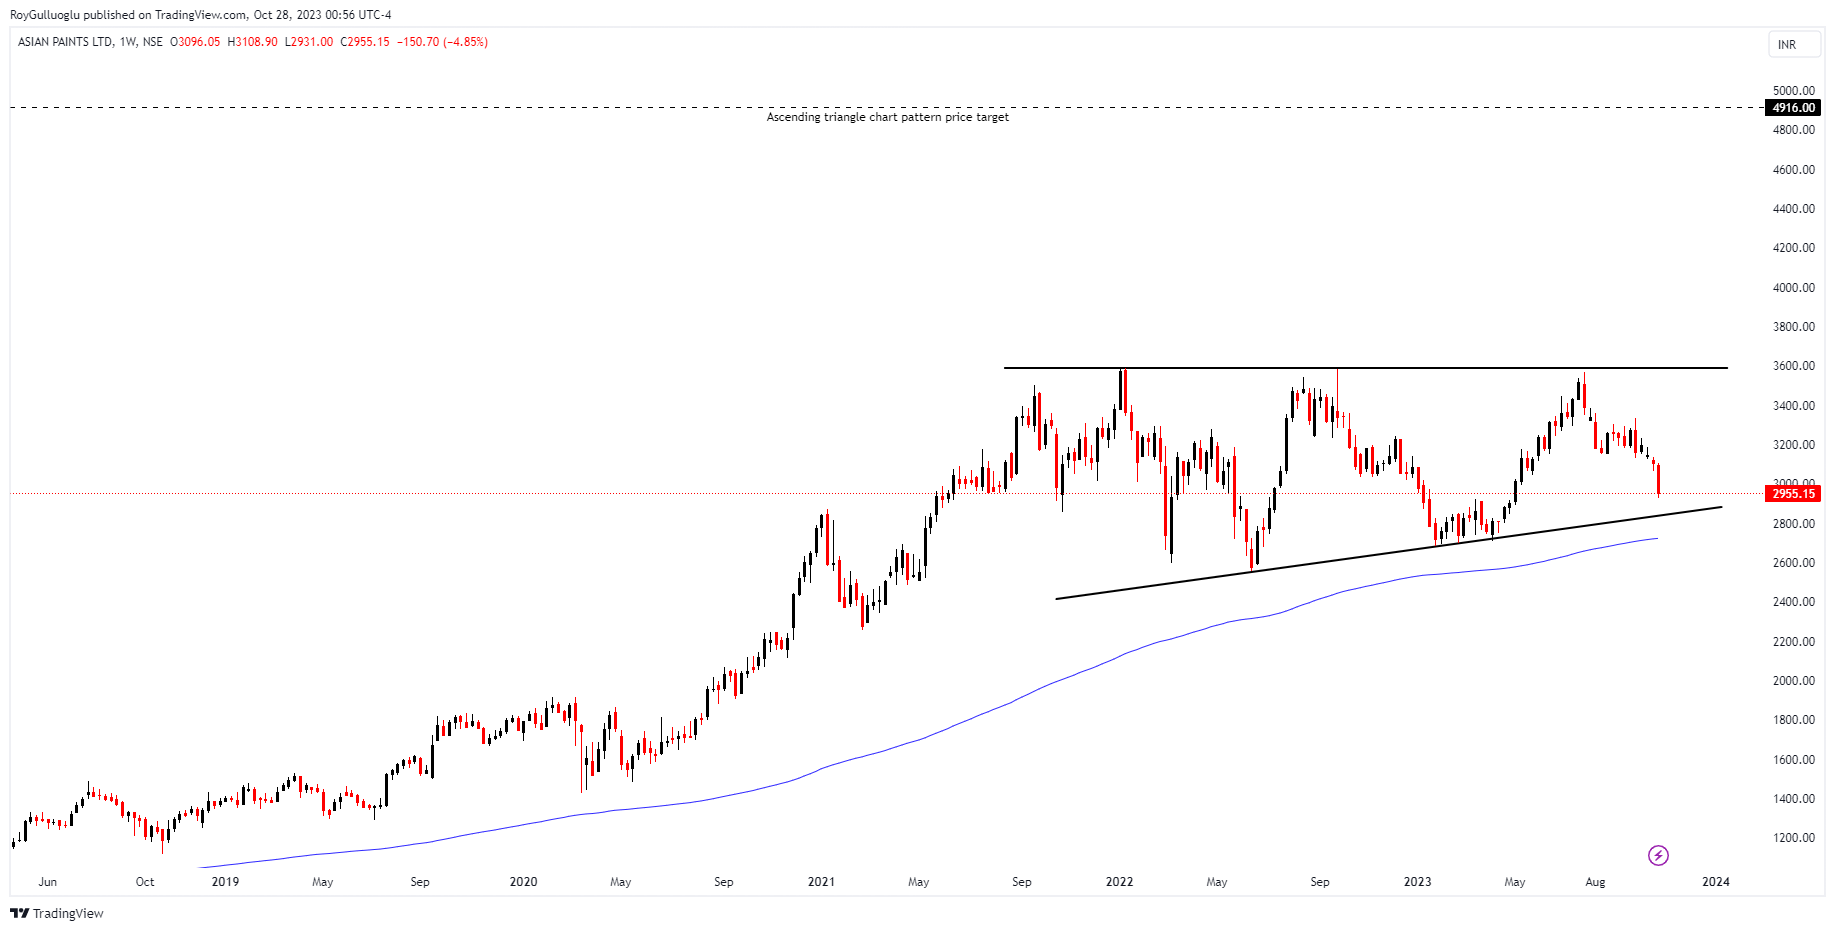
Asian Paints Limited and its subsidiaries are involved in the production, sale, and distribution of paints and coatings for both decorative and industrial purposes in India and worldwide. The company operates in two main segments: Paints and Home Improvement.
The above weekly chart formed an approximately 23-month-long ascending triangle chart pattern as a bullish continuation after an uptrend.
Within this pattern, the horizontal boundary at 3590 levels acts as strong resistance.
A daily close above 3697.7 levels would validate the breakout from the 23-month-long ascending triangle chart pattern.
The potential price target, based on this chart pattern, is 4916 levels.
ASIANPAINT, classified under the "basic materials" sector, falls under the “Mid Cap - Value” stock category.
AEON HOKKAIDO CORP-(7512/TSE)-Long/Short Idea
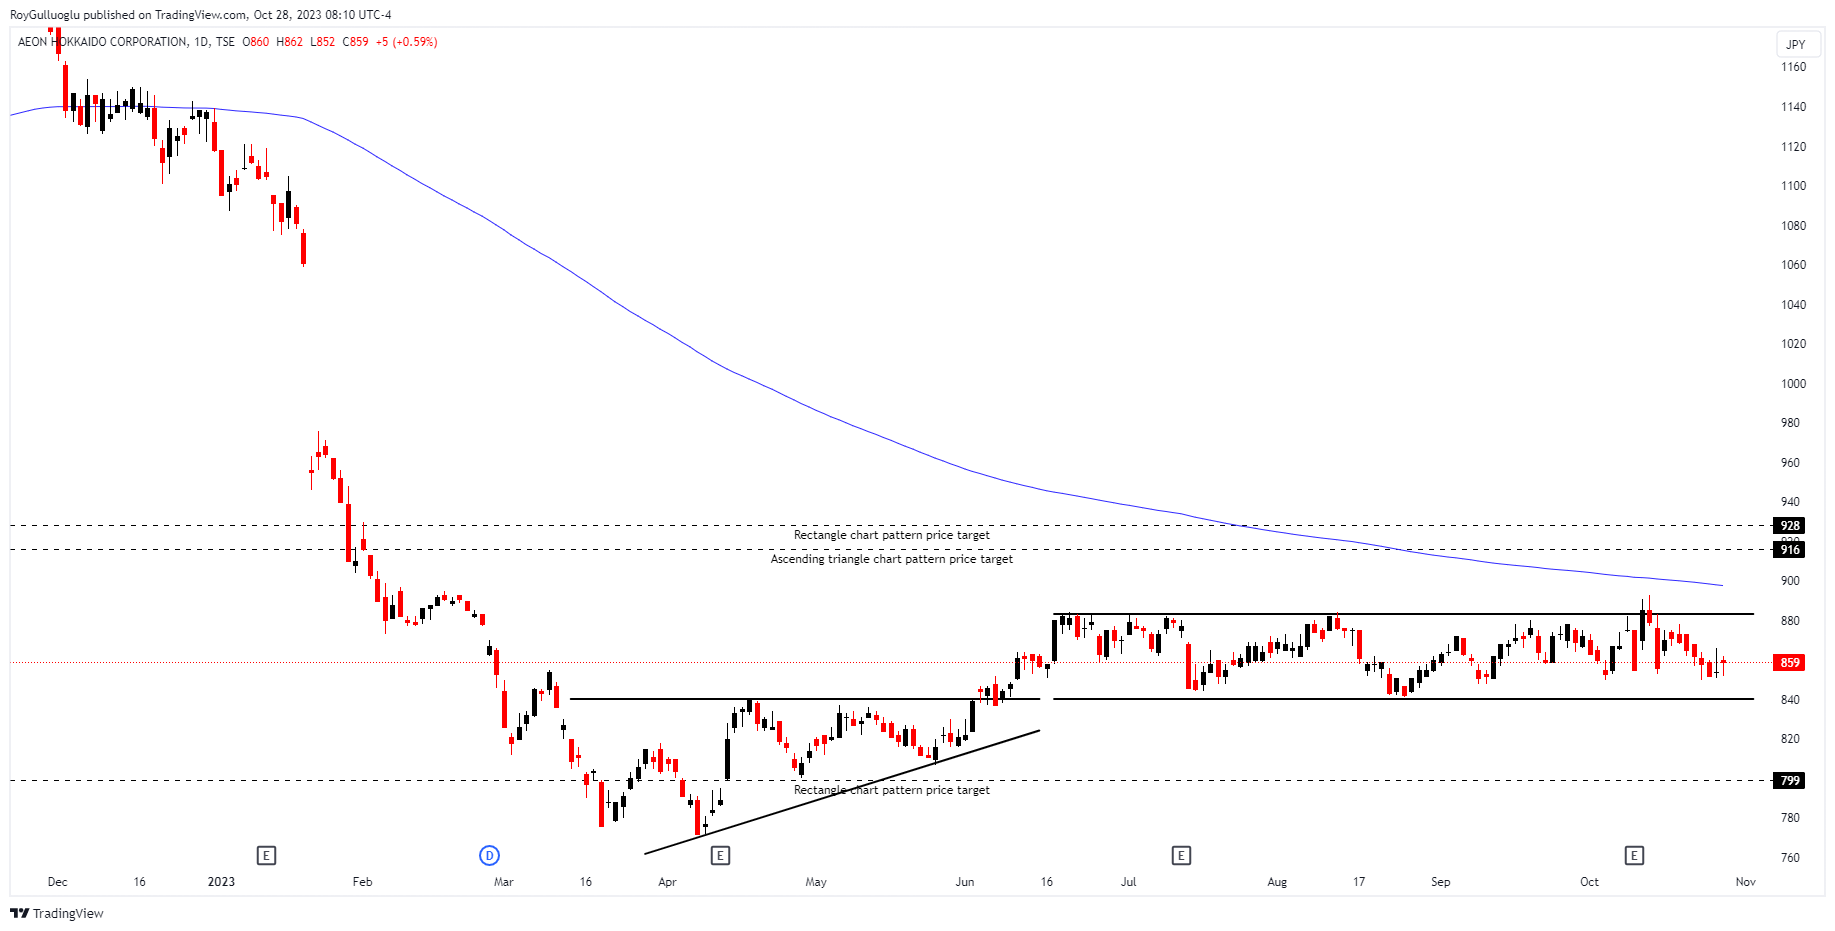
Aeon Hokkaido Corporation engages in the retail industry. It operates 78 stores.
The above daily chart formed an approximately 3-month-long rectangle chart pattern which has a resistance at 883 levels and support at 840 levels.
840 levels also act as a resistance to the priorly formed ascending triangle chart pattern.
A daily close either below 827 levels or above 896 levels would validate the breakout from the 3-month-long rectangle top chart pattern.
7512, classified under the "consumer cyclical" sector, falls under the “Small Cap - Growth” stock category.
RIX CORP-(7525/TSE)-Long Idea
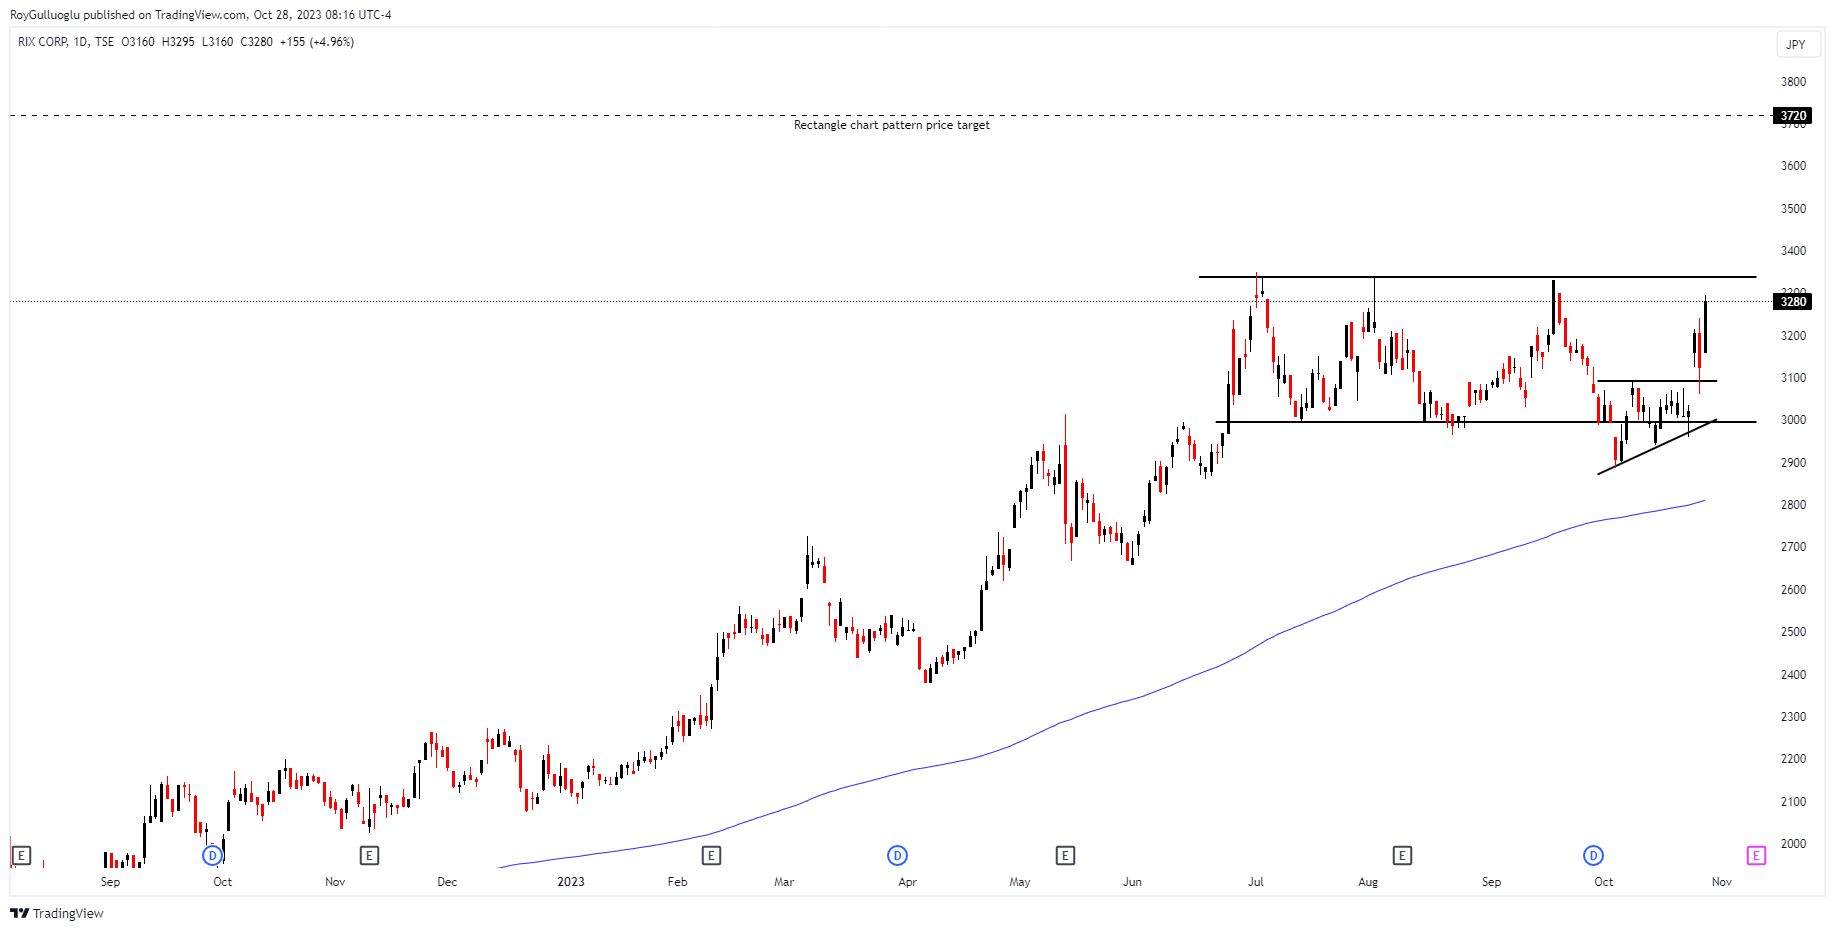
RIX CORPORATION produces, promotes, and distributes components for industrial machinery and high-pressure equipment utilized in the automotive sector. They provide their products to a range of industries, including steel, automotive, electrical machinery, semiconductor, and chemical sectors.
The above daily chart formed an approximately 3-month-long rectangle chart pattern as a bullish continuation after an uptrend.
Within this pattern, the horizontal boundary at 3340 levels acts as strong resistance.
A daily close above 3440 levels would validate the breakout from the 3-month-long rectangle chart pattern.
The potential price target, based on this chart pattern, is 3720 levels.
7525, classified under the "industrials" sector, falls under the “Small Cap - Value” stock category.
Follow-ups
MA - Short Idea
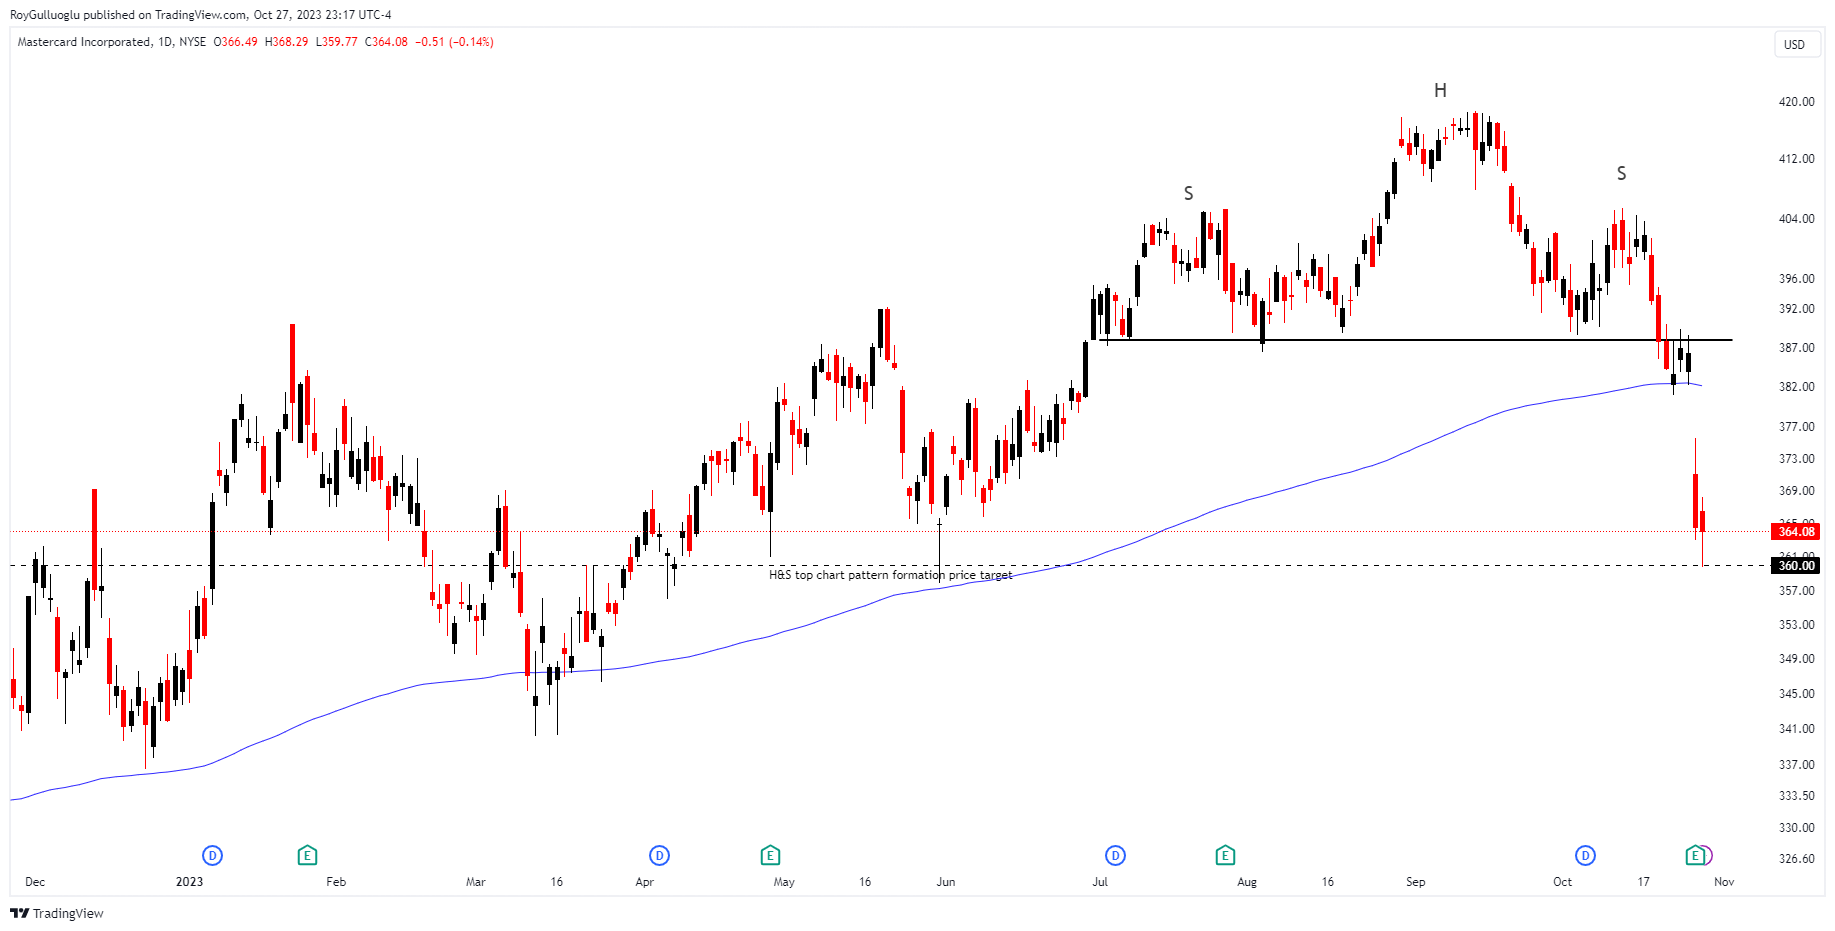
You can click the MA ticker above to access the first report explaining the RATIONALE behind the trade idea.
Price reached the 3-month-long H&S top chart pattern target of 360 levels.
MNDY - Short Idea
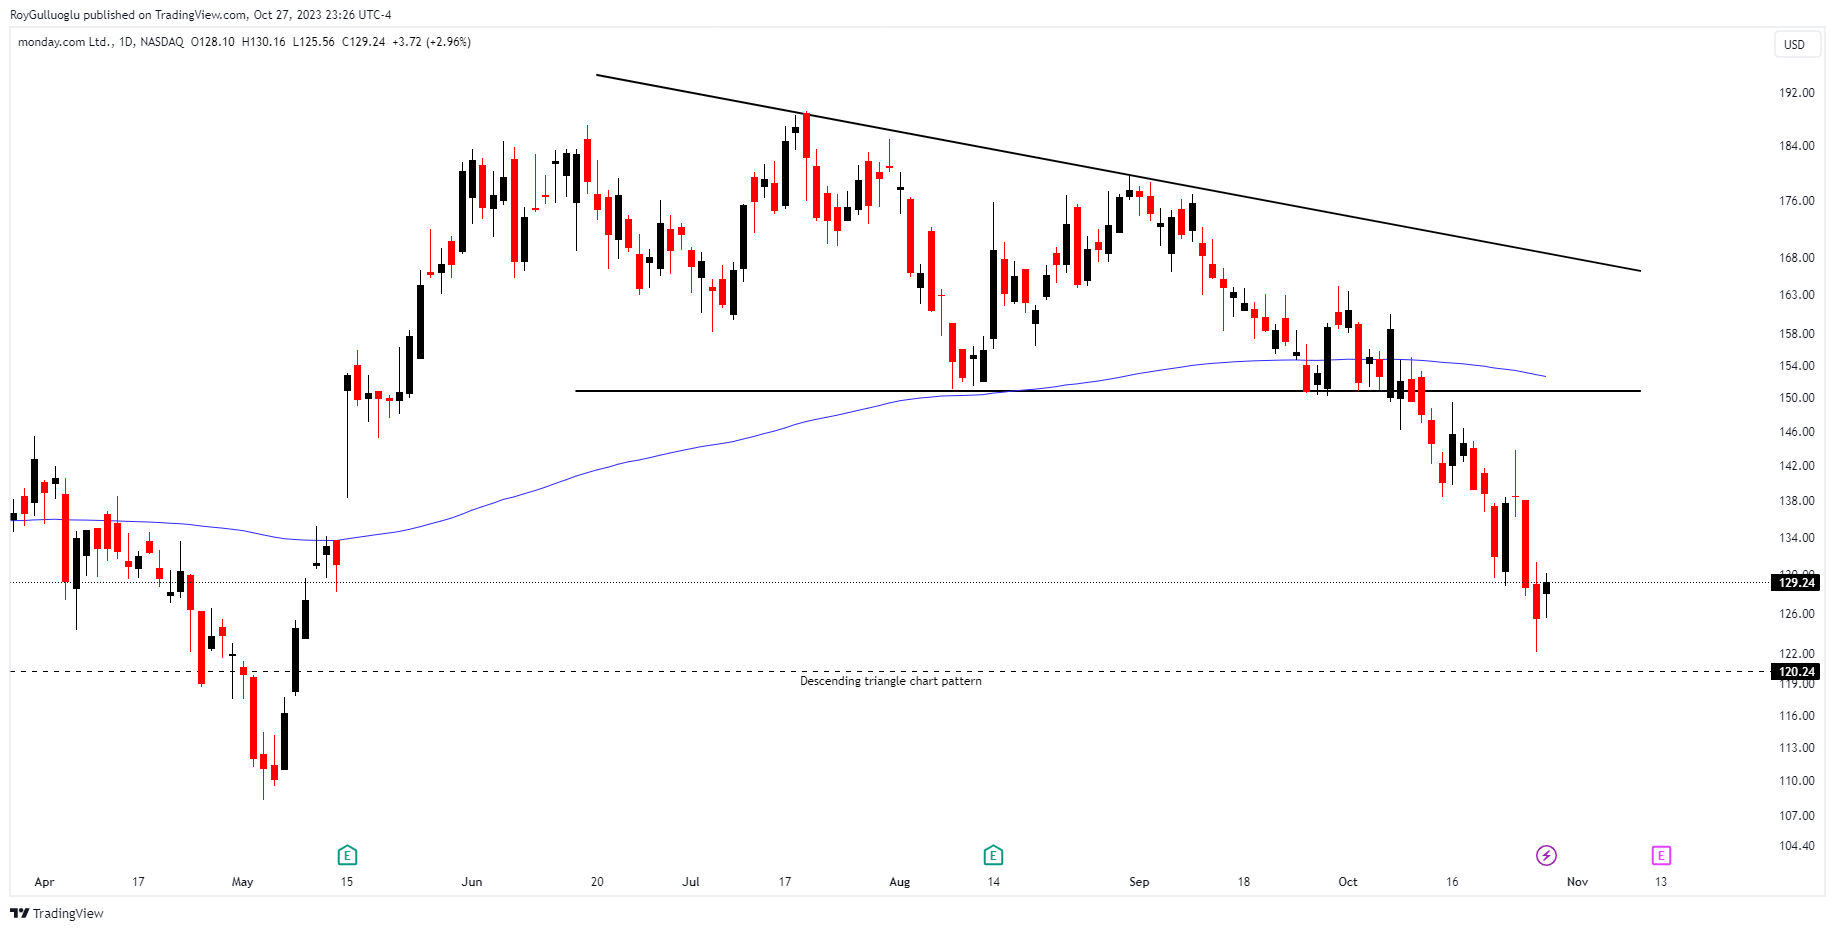
You can click the MNDY ticker above to access the first report explaining the RATIONALE behind the trade idea.
Price resumed its downward movement after the pull back to the horizontal boundary of the descending triangle chart pattern.
MMC - Short Idea
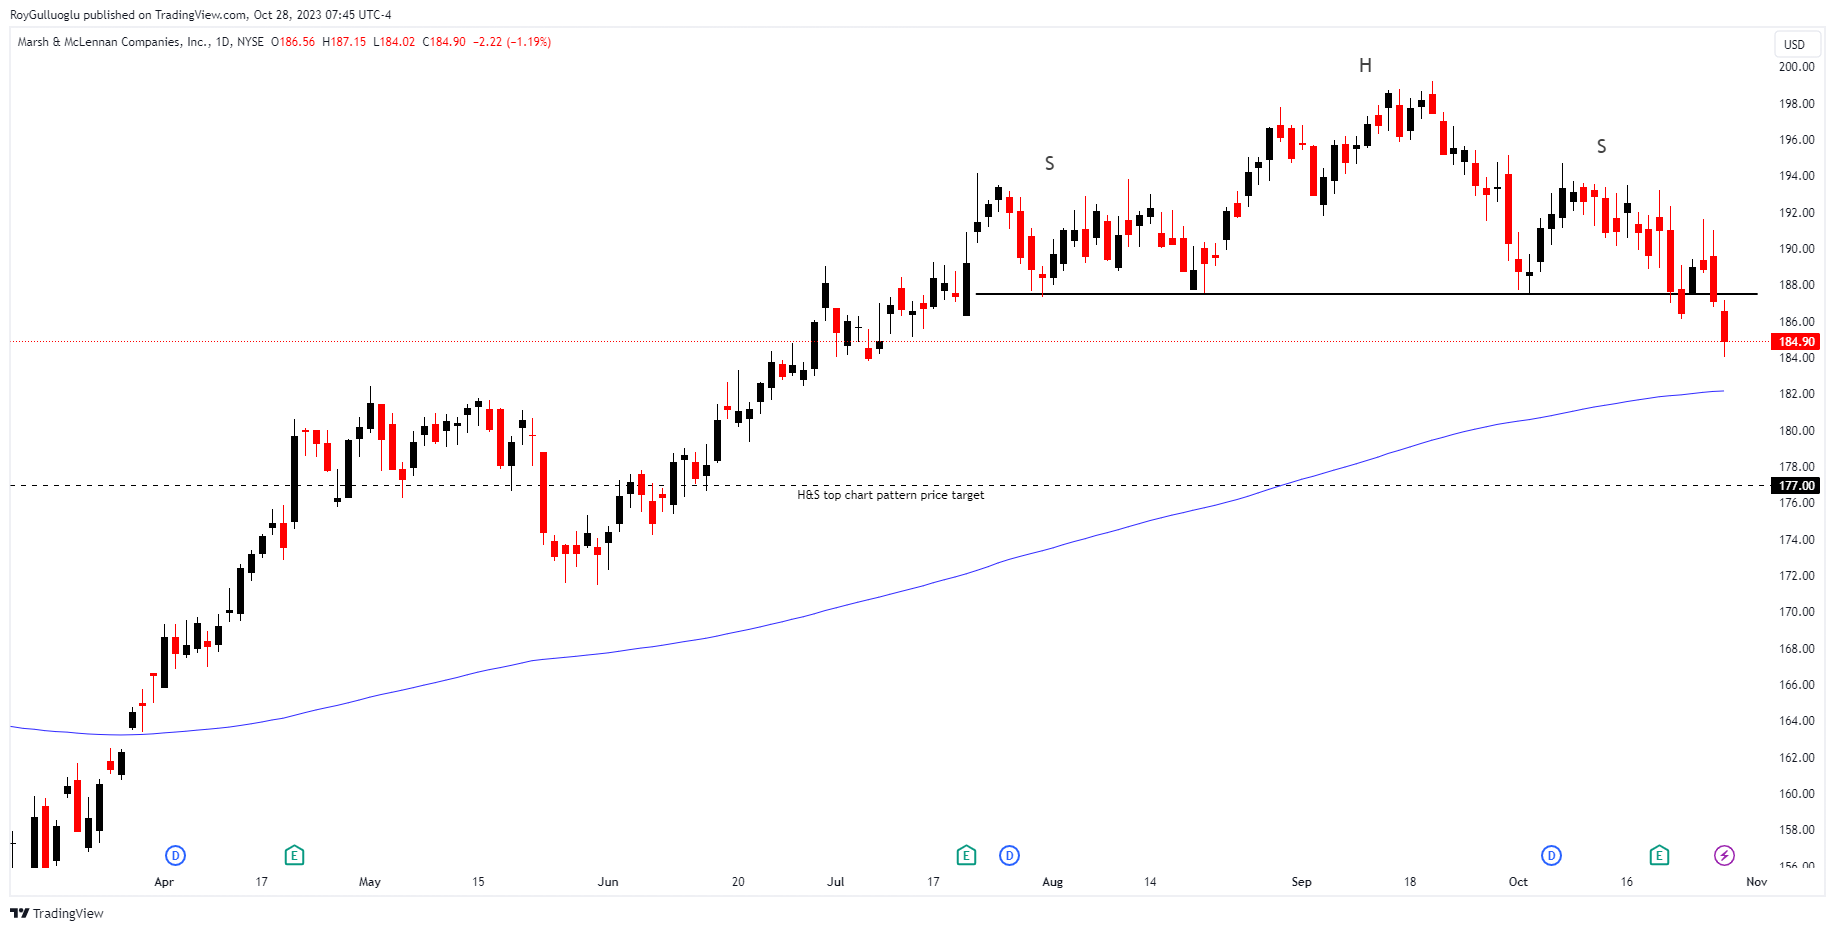
You can click the MMC ticker above to access the first report explaining the RATIONALE behind the trade idea.