


Zscaler, Inc.-(ZS/NASDAQ)-Long Idea
Zscaler, Inc. operates as a cloud security company worldwide.
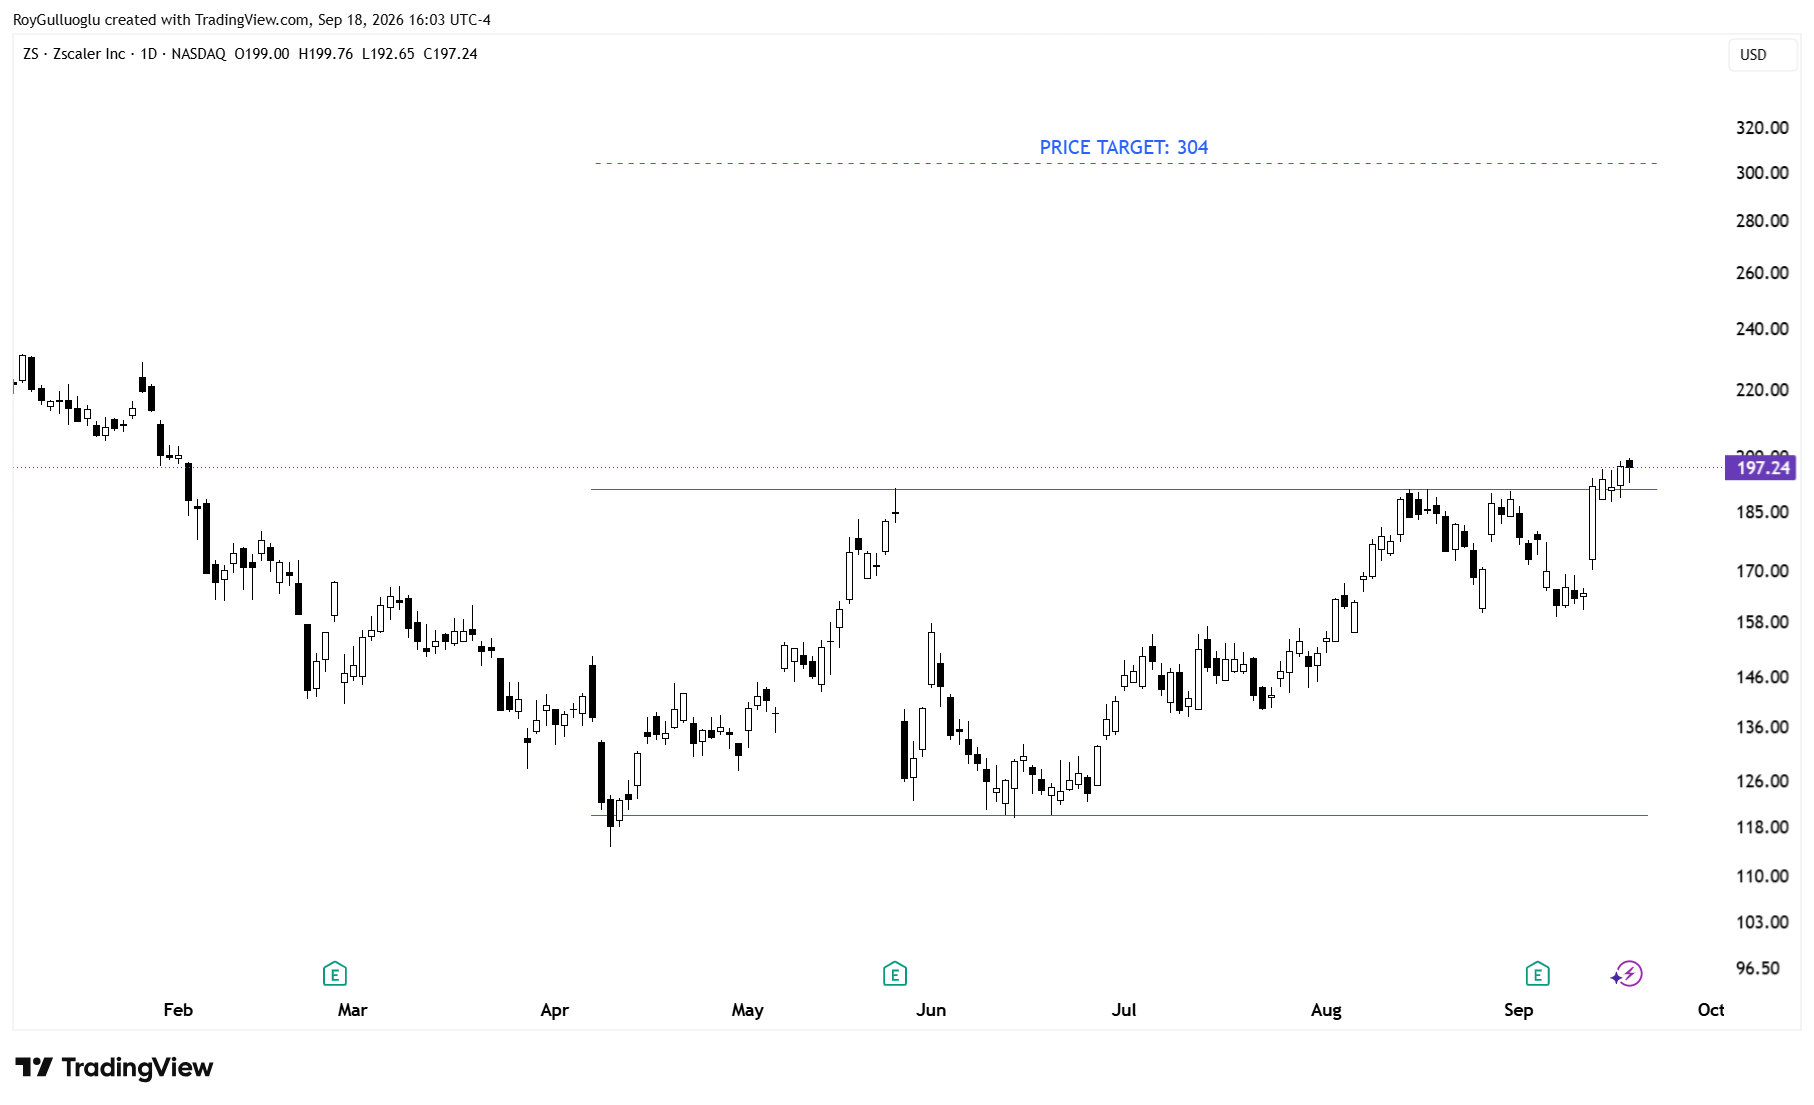
The above daily chart formed an approximately 4-month-long rectangle chart pattern as a bullish reversal after a downtrend.
Within this pattern, the horizontal boundary at 191.11 levels acted as a resistance.
A daily close above 196.8 levels validated the breakout from the 4-month-long rectangle chart pattern.
Based on this chart pattern, the potential price target is 304 levels.
Mineralys Therapeutics, Inc.-(MLYS/NASDAQ)-Long Idea
Mineralys Therapeutics, Inc., a biopharmaceutical company, develops medicines to target diseases driven by dysregulated aldosterone in the United States.
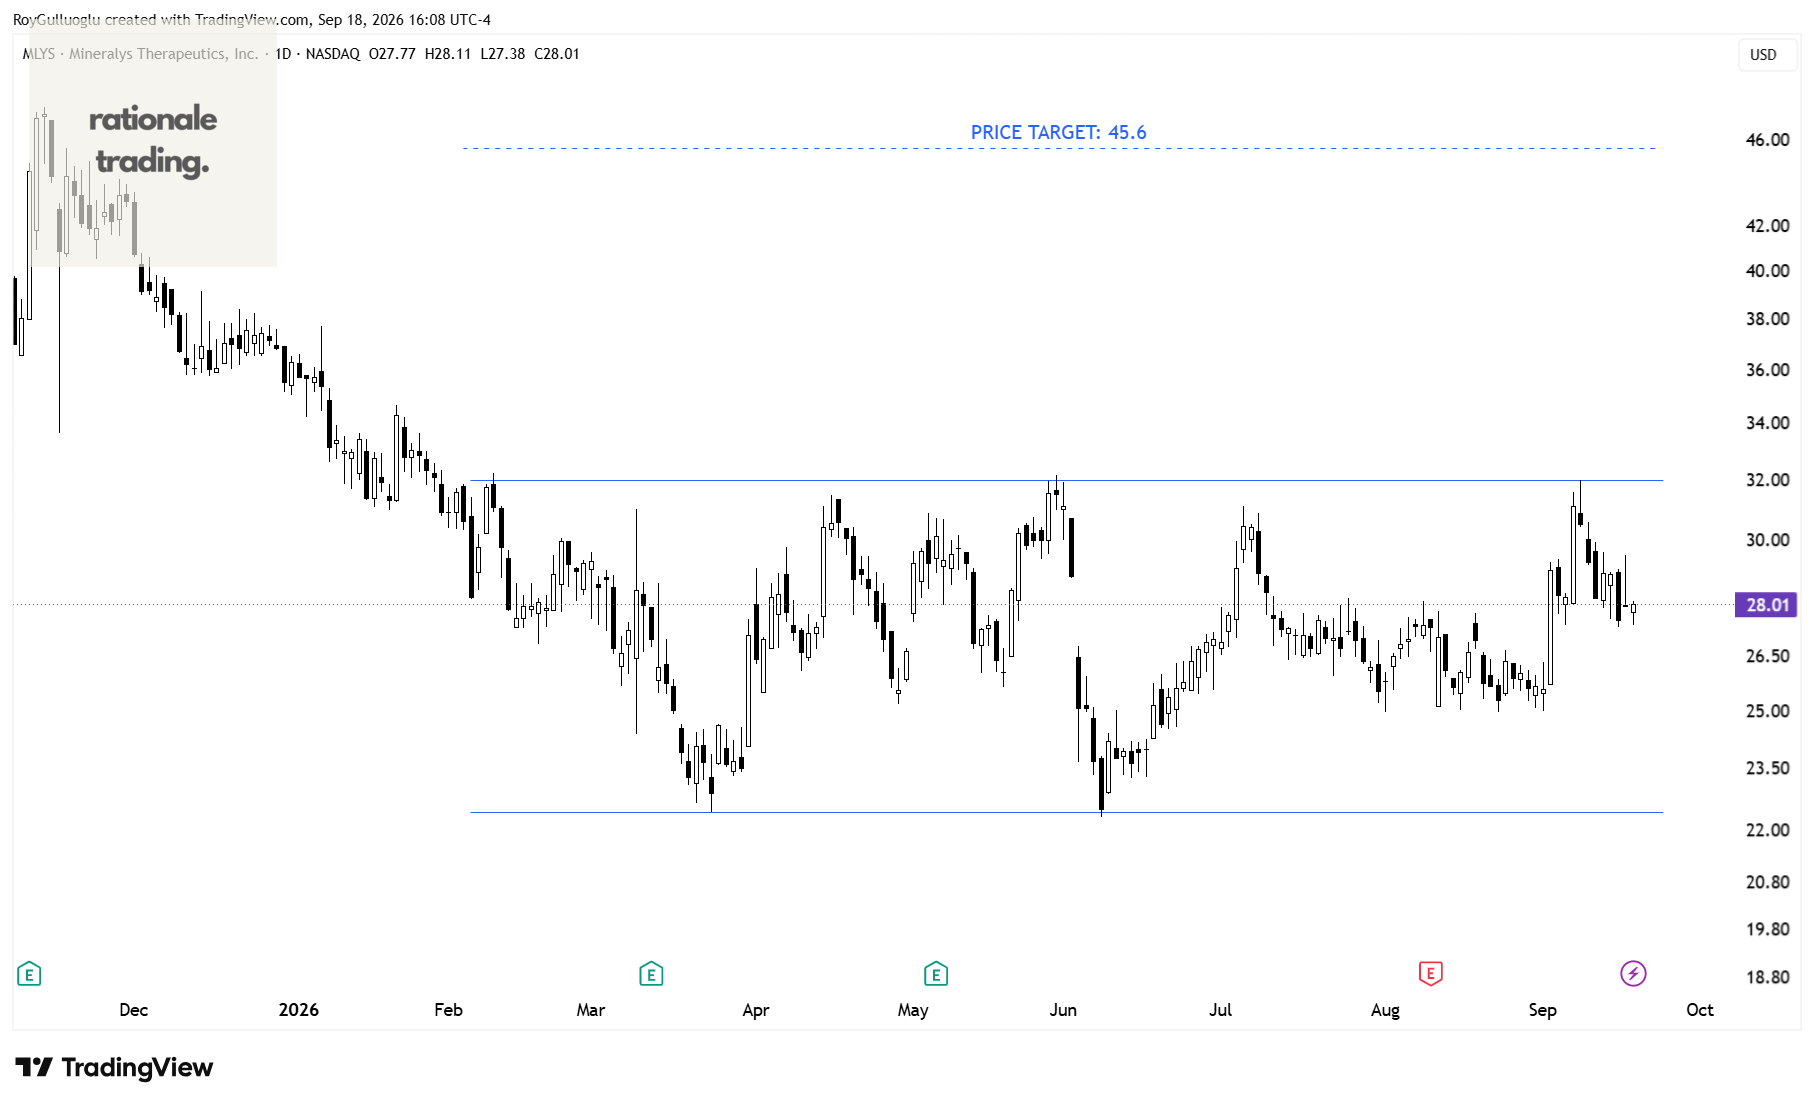
The above daily chart formed an approximately 5-month-long rectangle chart pattern as a bullish reversal after a downtrend.
Within this pattern, the horizontal boundary at 31.99 levels acts as a resistance.
A daily close above 32.9 levels would validate the breakout from the 5-month-long rectangle chart pattern.
Based on this chart pattern, the potential price target is 45.6 levels.
NeoGenomics, Inc.-(NEO/NASDAQ)-Long Idea
NeoGenomics, Inc. operates a network of cancer-focused testing laboratories in the United States and the United Kingdom.
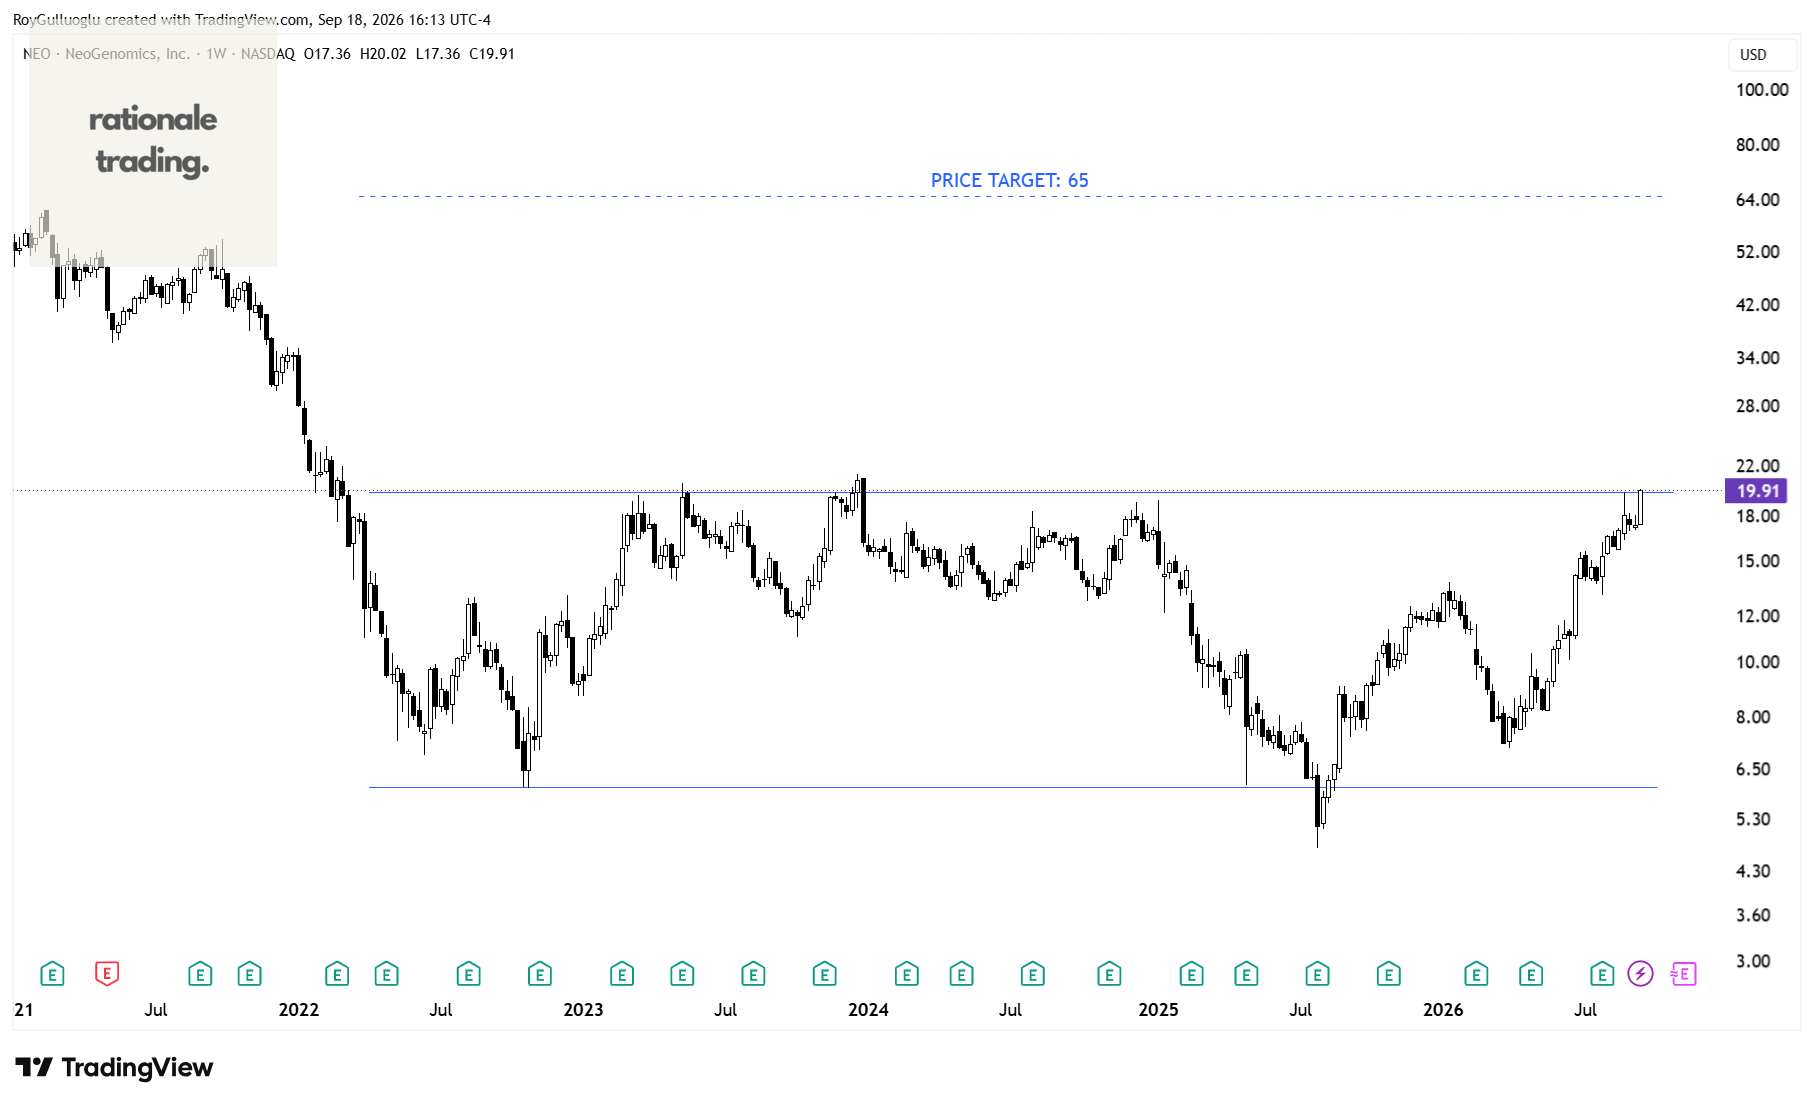
The above weekly chart formed an approximately 7-month-long rectangle chart pattern as a bullish reversal after a downtrend.
Within this pattern, the horizontal boundary at 19.76 levels acts as a resistance.
A daily close above 20.35 levels would validate the breakout from the 7-month-long rectangle chart pattern.
Based on this chart pattern, the potential price target is 65 levels.
Meta Platforms, Inc.-(META/NASDAQ)-Long Idea
Meta Platforms, Inc. engages in the development of products that enable people to connect and share with friends and family through mobile devices, personal computers, virtual reality (VR) headsets, and AI glasses in the United States, Canada, Europe, Asia-Pacific, and internationally.
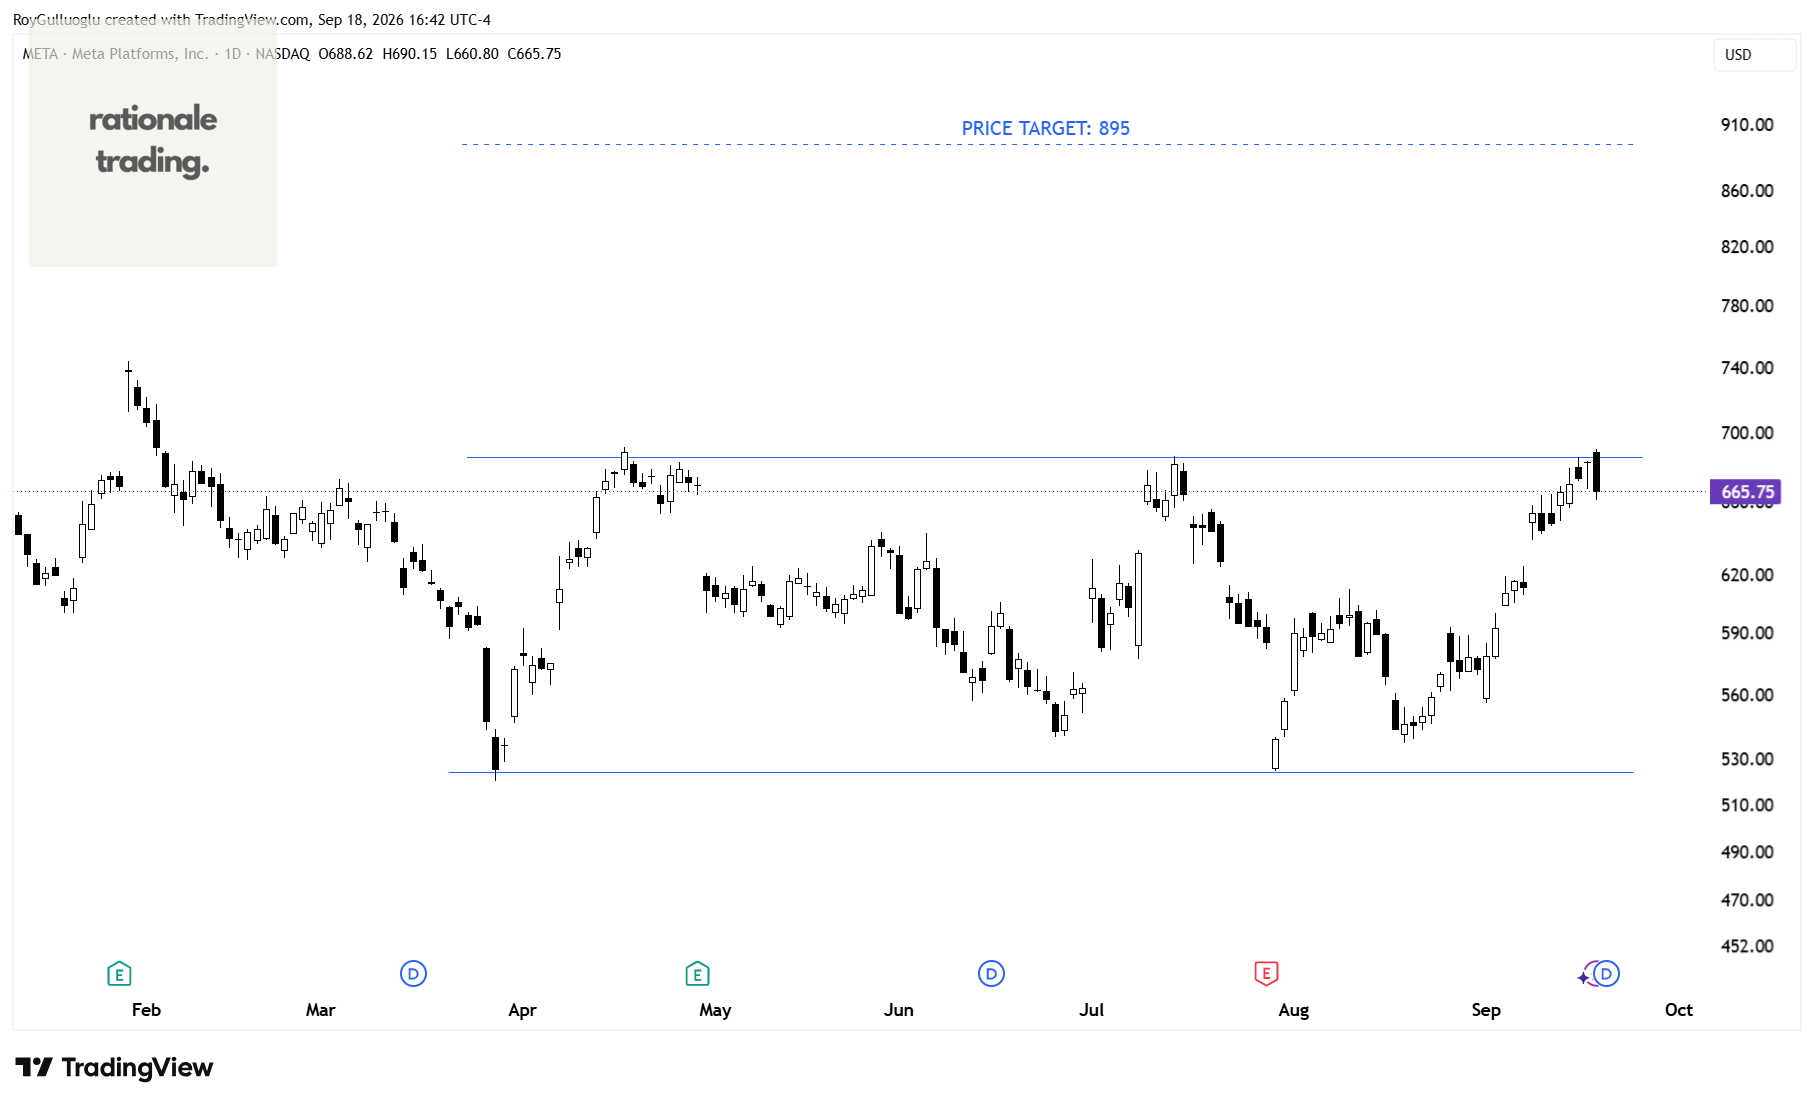
The above daily chart formed an approximately 4-month-long rectangle chart pattern as a bullish reversal after a downtrend.
Within this pattern, the horizontal boundary at 685.3 levels acts as a resistance.
A daily close above 705.85 levels would validate the breakout from the 4-month-long rectangle chart pattern.
Based on this chart pattern, the potential price target is 895 levels.
Cryoport, Inc.-(CYRX/NASDAQ)-Long Idea
Cryoport, Inc. provides temperature-controlled supply chain solutions in biopharma/pharma, animal health, and reproductive medicine markets worldwide.
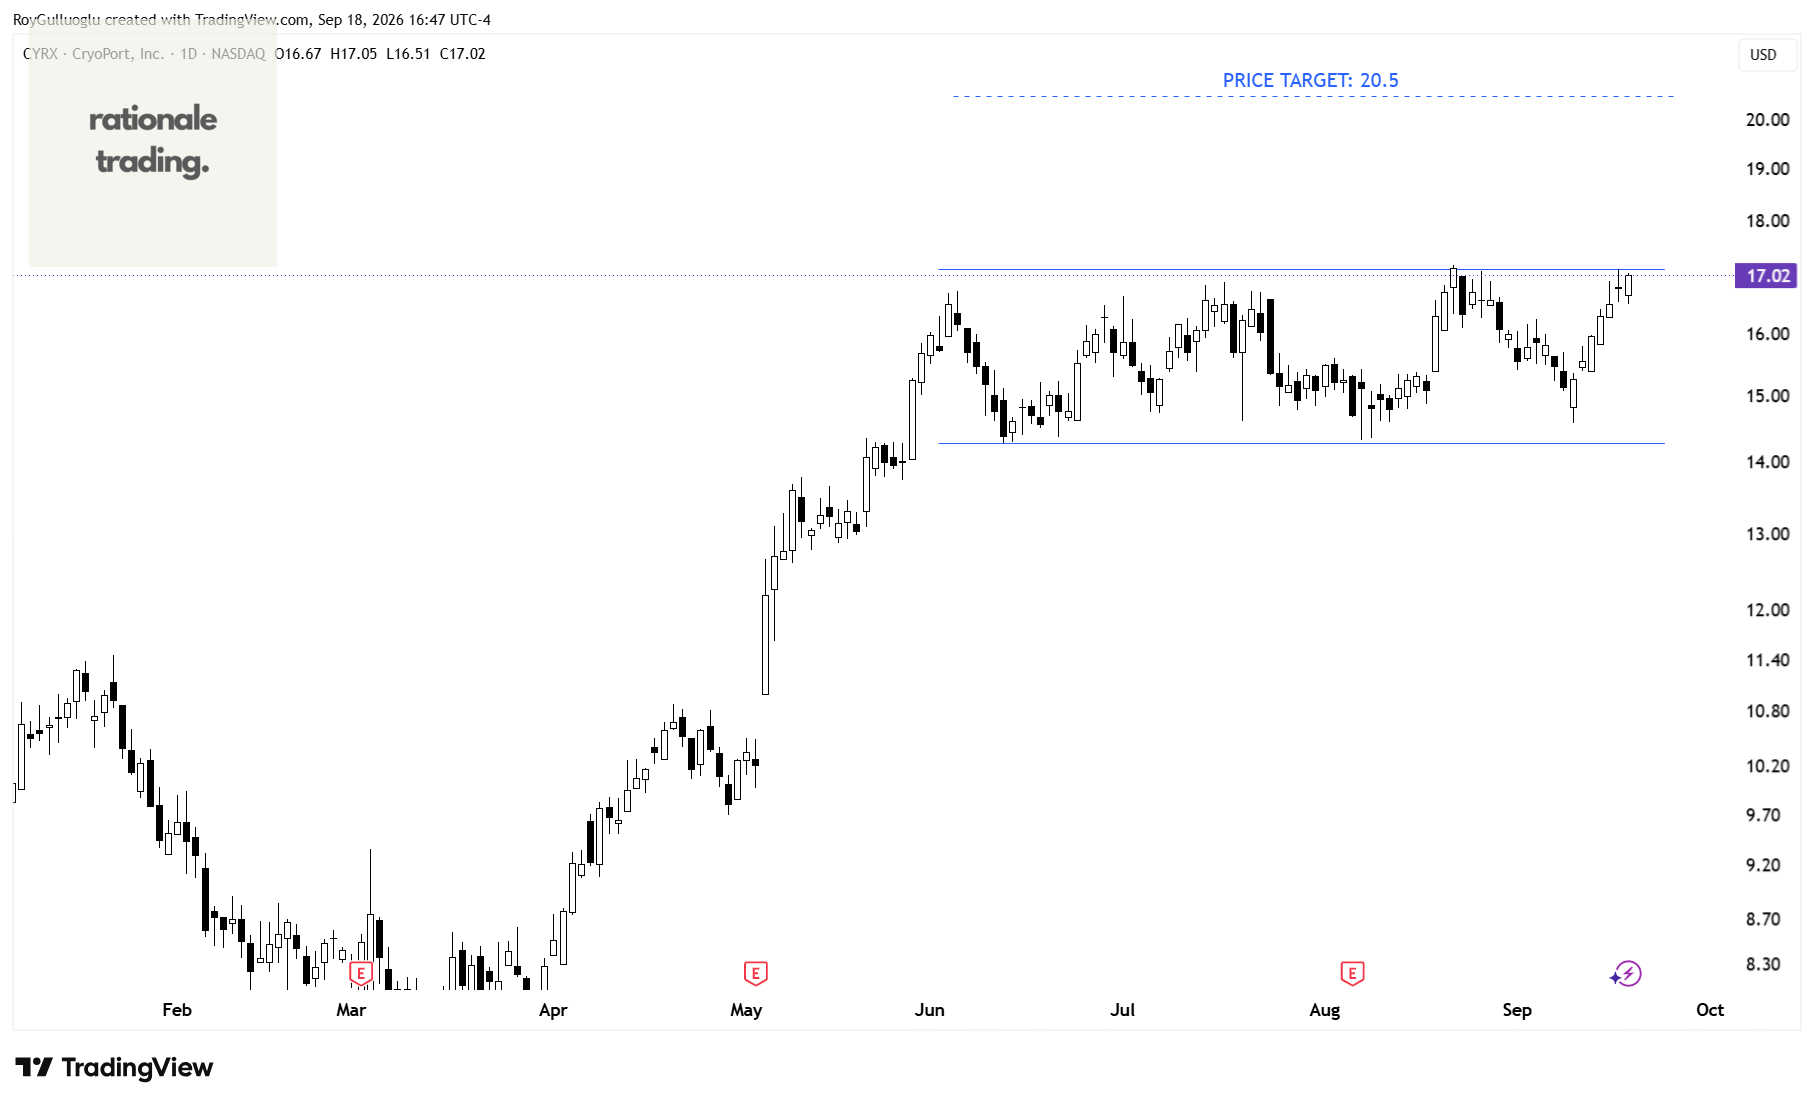
The above daily chart formed an approximately 3-month-long rectangle chart pattern as a bullish continuation after an uptrend.
Within this pattern, the horizontal boundary at 17.12 levels acts as a resistance.
A daily close above 17.6 levels would validate the breakout from the 3-month-long rectangle chart pattern.
Based on this chart pattern, the potential price target is 20.5 levels.
HCA Healthcare, Inc.-(HCA/NYSE)-Long Idea
HCA Healthcare, Inc., through its subsidiaries, provides health care services in the United States.
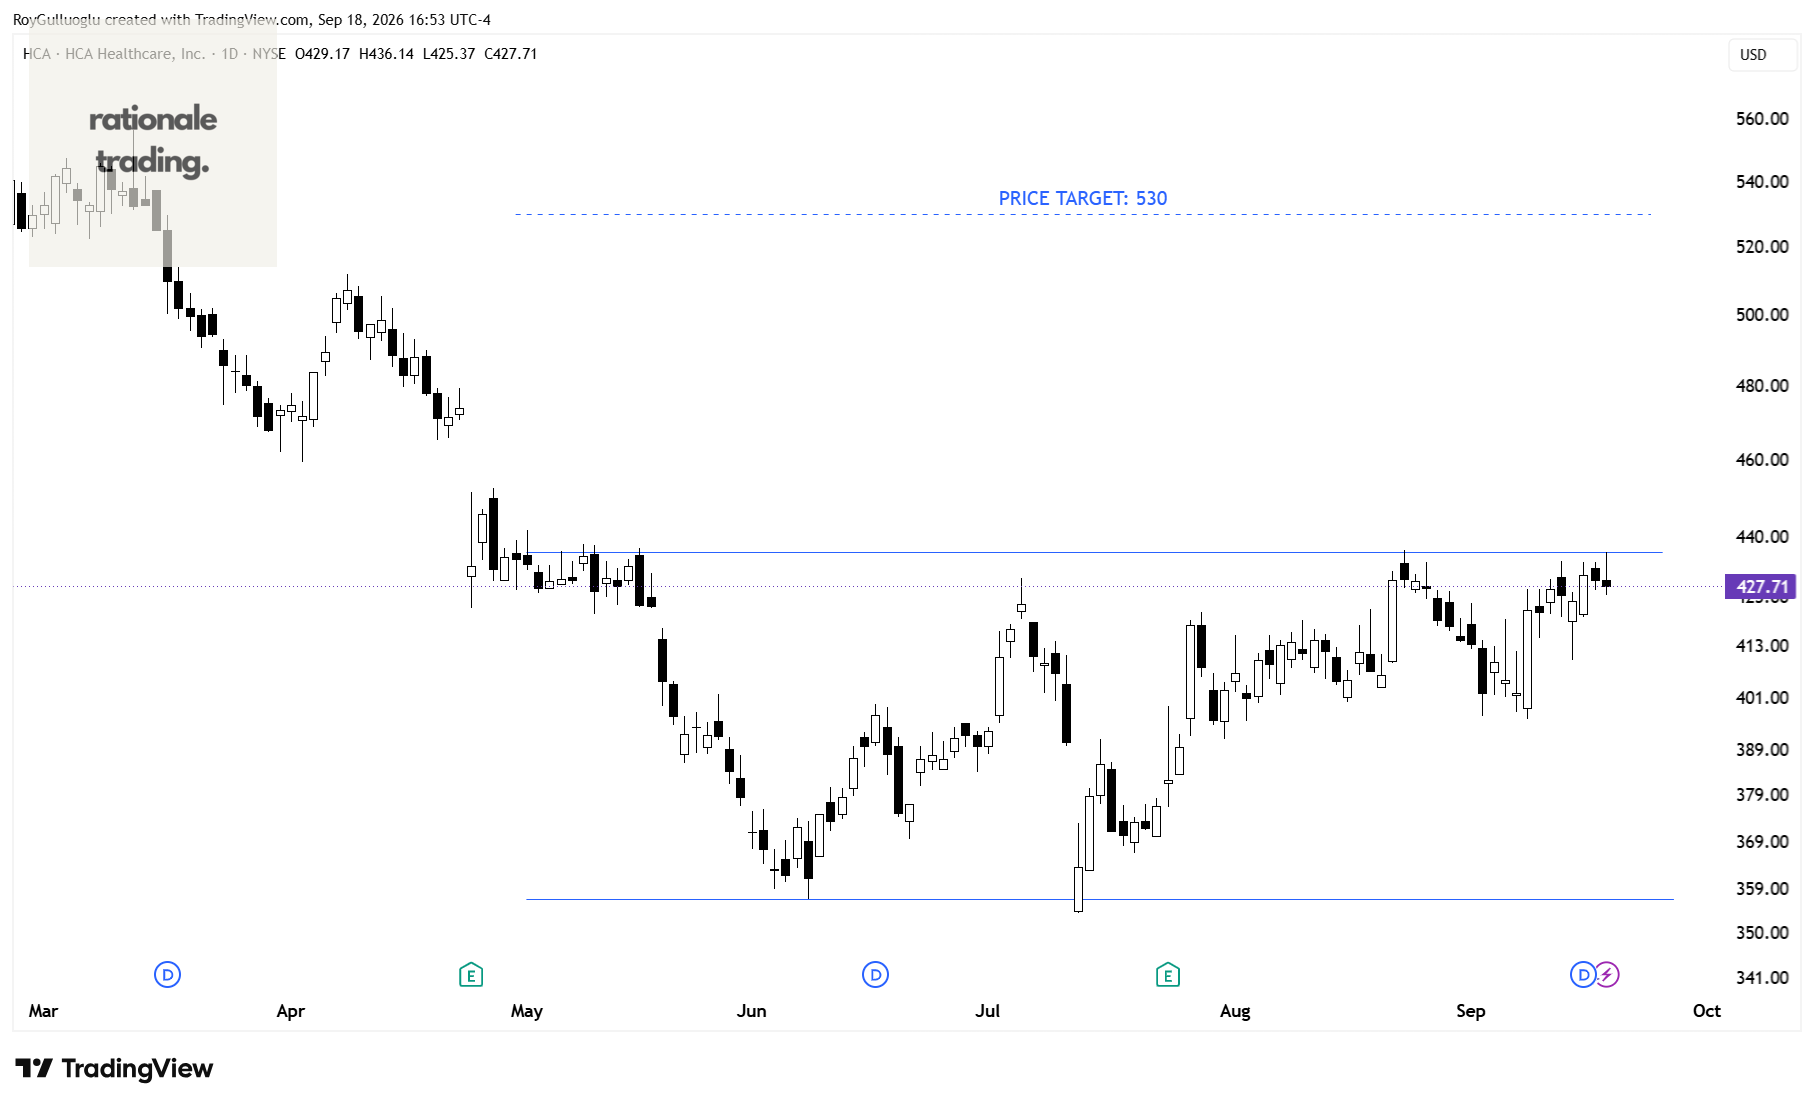
The above daily chart formed an approximately 3-month-long rectangle chart pattern as a bullish reversal after a downtrend.
Within this pattern, the horizontal boundary at 436.14 levels acts as a resistance.
A daily close above 449.2 levels would validate the breakout from the 3-month-long rectangle chart pattern.
Based on this chart pattern, the potential price target is 530 levels.