New setups
Eli Lilly and Company-(LLY/NYSE) - Long Idea
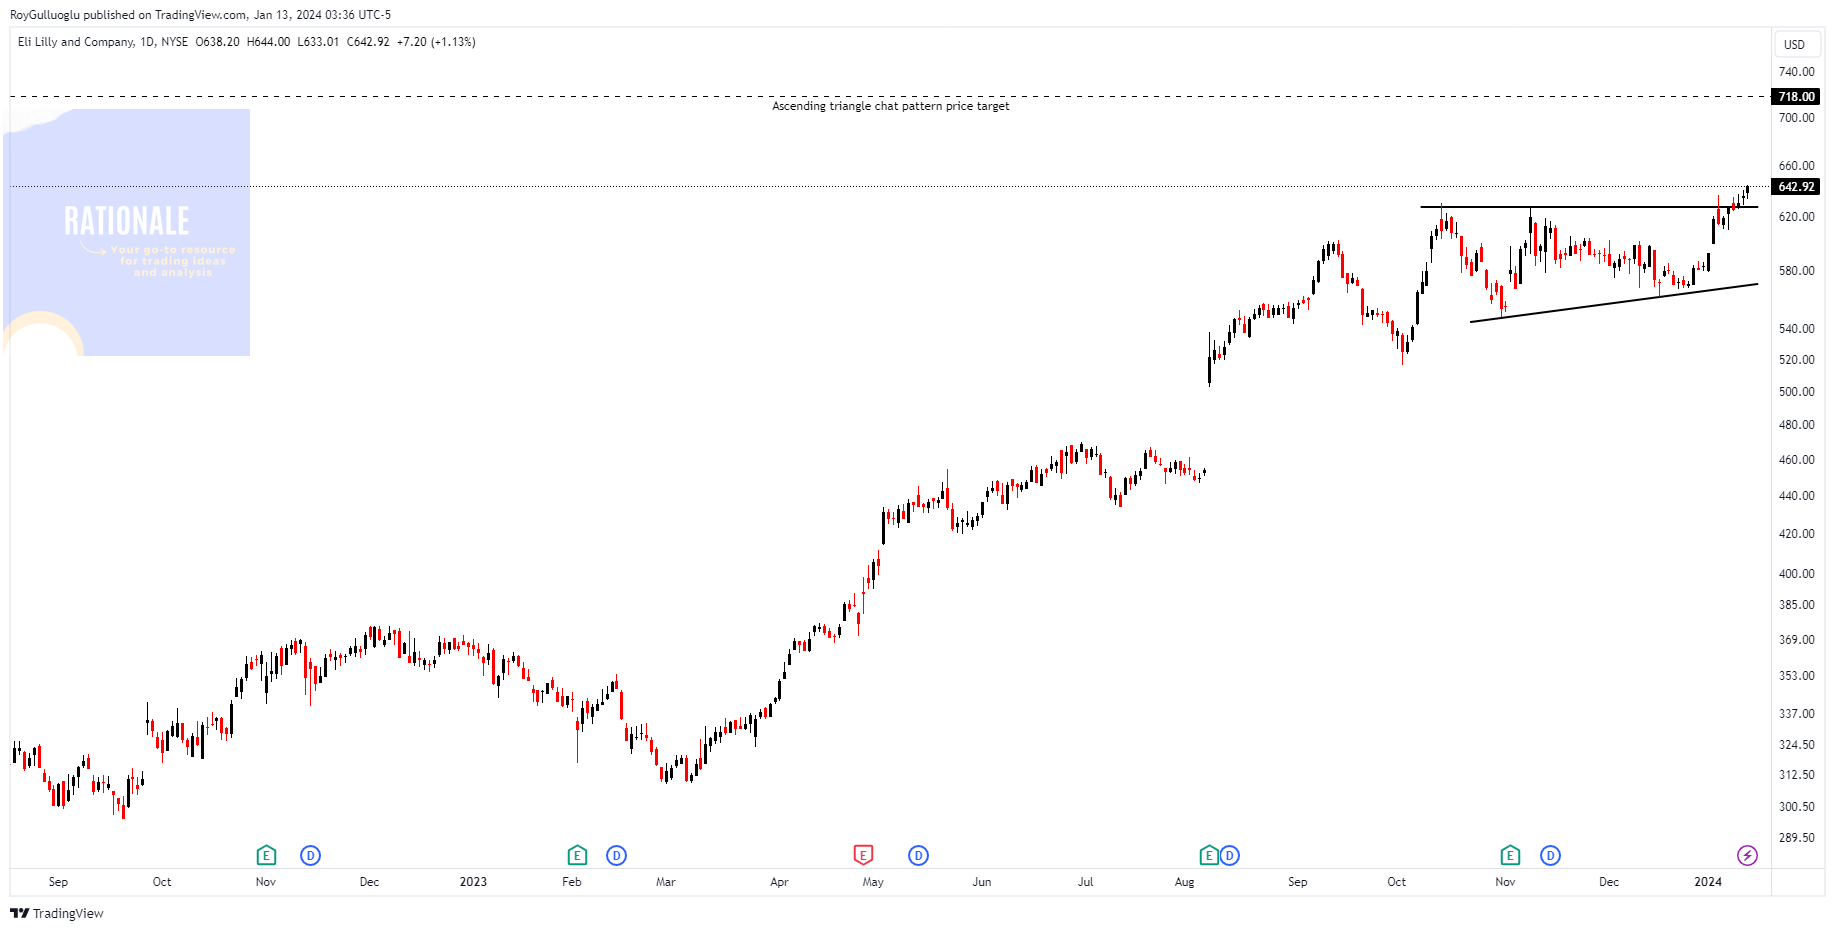
Eli Lilly and Company discovers, develops, and markets human pharmaceuticals worldwide.
The above daily chart formed an approximately 2-month-long ascending triangle chart pattern as a bullish continuation after an uptrend.
Within this pattern, the horizontal boundary at 627 levels acts as a resistance.
A daily close above 645 levels would validate the breakout from the 2-month-long ascending triangle chart pattern.
Based on this chart pattern, the potential price target is 718 levels.
LLY, classified under the "healthcare" sector, falls under the “Large Cap - Value” stock category.
Urban Outfitters, Inc.-(URBN/NASDAQ) - Long Idea
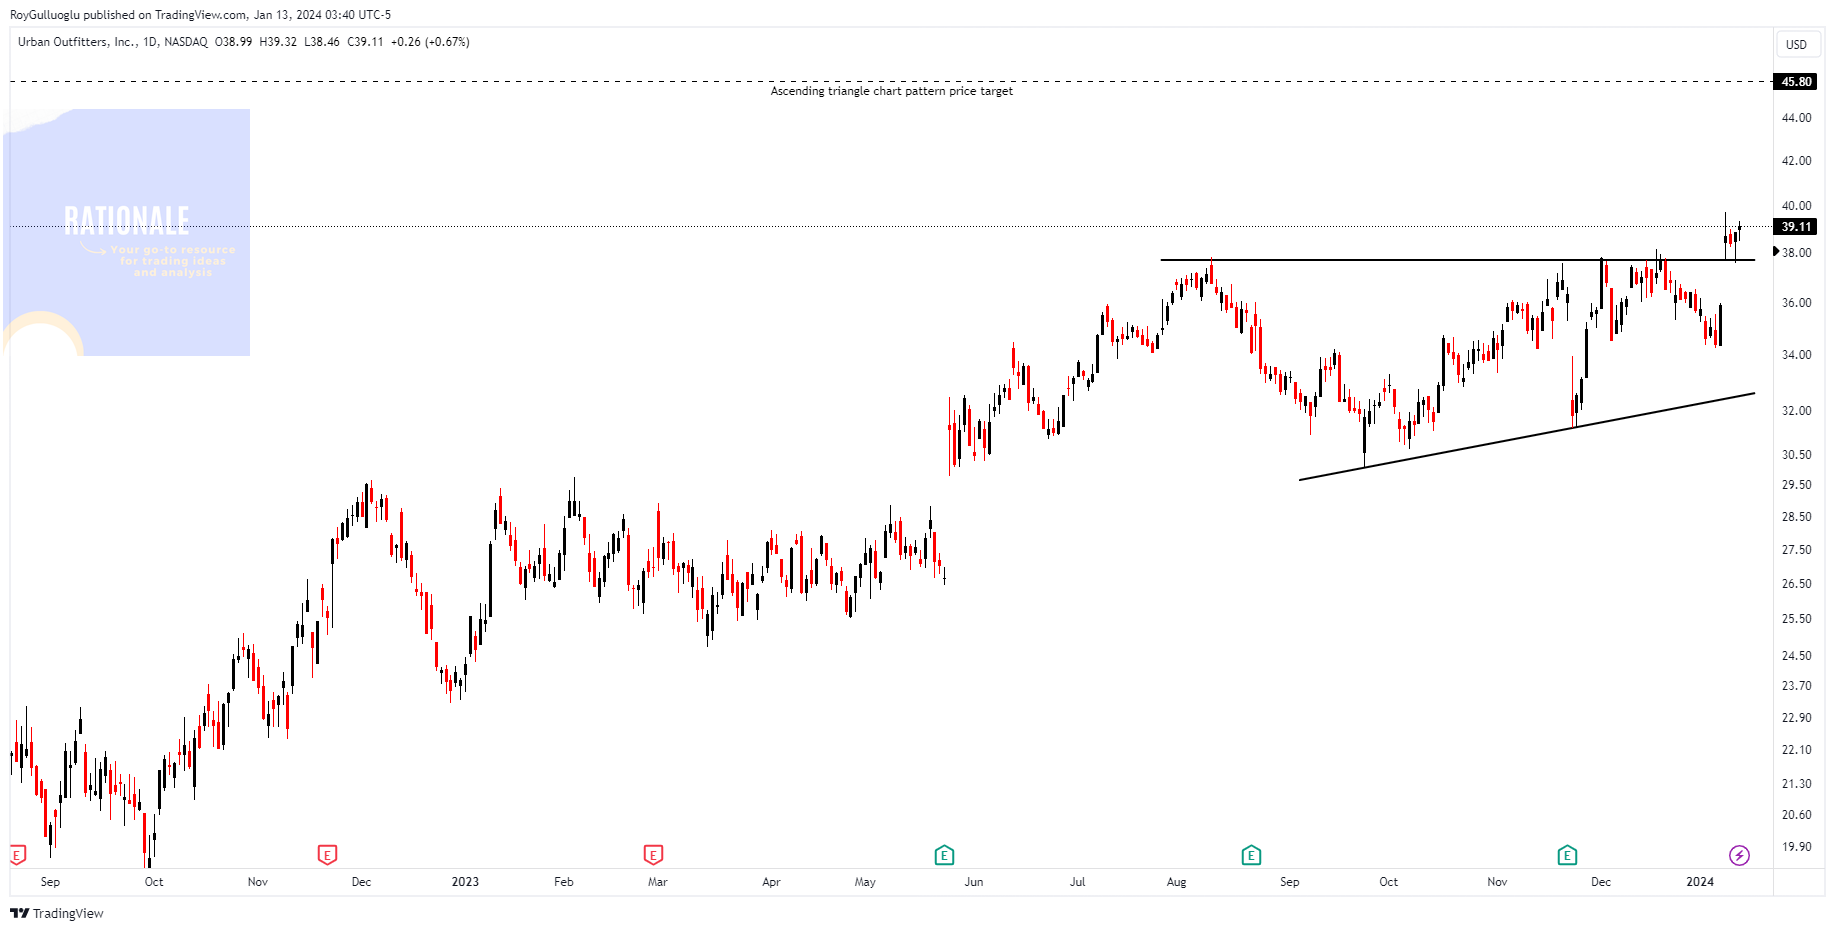
Urban Outfitters, Inc. is involved in the retail and wholesale of various consumer products. It manages Urban Outfitters stores, offering fashion apparel, activewear, intimates, footwear, accessories, home goods, electronics, and beauty products. Additionally, the company operates Anthropologie stores, serving a range of apparel, accessories, intimates, shoes, home furnishings, gifts, decorative items, and beauty and wellness products.
The above daily chart formed an approximately 3-month-long ascending triangle chart pattern as a bullish continuation after an uptrend.
Within this pattern, the horizontal boundary at 37.7 levels acted as a resistance.
A daily close above 38.83 levels validated the breakout from the 3-month-long ascending triangle chart pattern.
Based on this chart pattern, the potential price target is 45.8 levels.
URBN, classified under the "consumer cyclical sector" sector, falls under the “Mid Cap - Growth” stock category.
Upwork Inc.-(UPWK/NASDAQ)-Long Idea
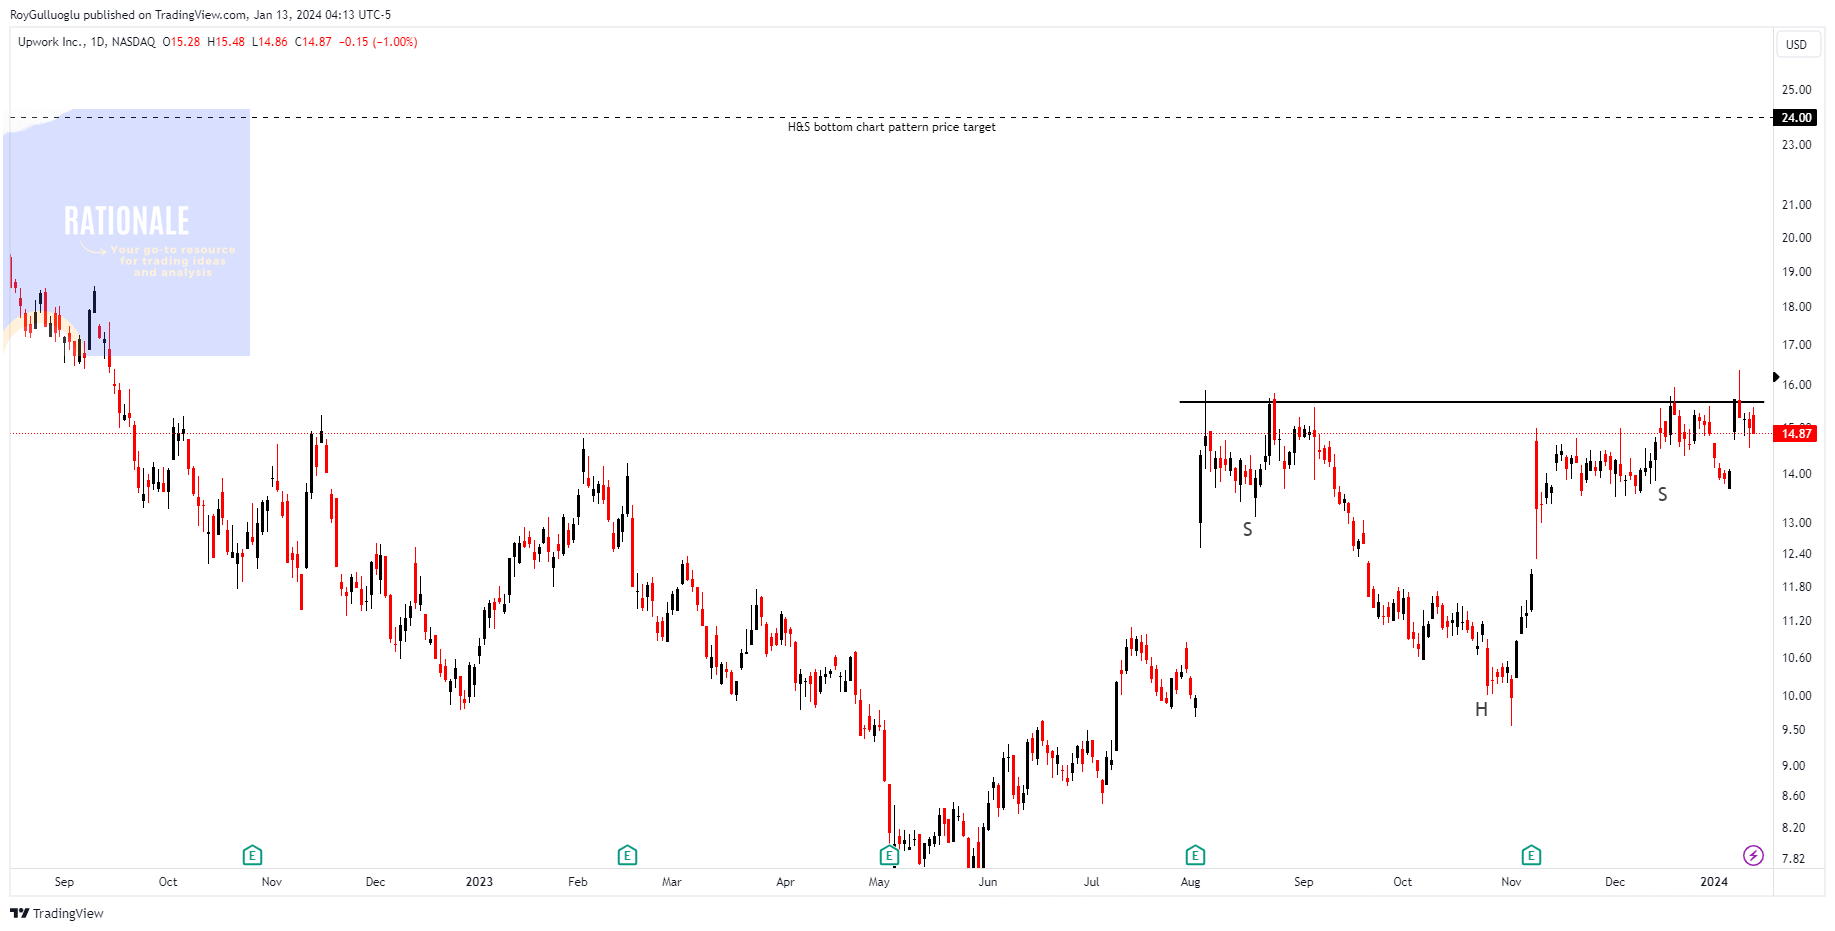
The company's work marketplace provides access to talent with various skills across a range of categories, including sales and marketing, customer service, data science and analytics, design and creative, web, mobile, and software development.
The above daily chart formed an approximately 3-month-long H&S continuation chart pattern as a bullish continuation after an uptrend.
Within this pattern, the boundary at 15.6 levels acts as a resistance.
A daily close above 16.06 levels would validate the breakout from the 3-month-long H&S continuation chart pattern.
Based on this chart pattern, the potential price target is 24 levels.
UPWK, classified under the "industrials" sector, falls under the “Mid Cap - Value” stock category.
Multiple quarters of EPS, and revenue acceleration YoY in Quarterly Earnings is another strength of the stock.
Amazon.com, Inc.-(AMZN/NASDAQ)-Long Idea
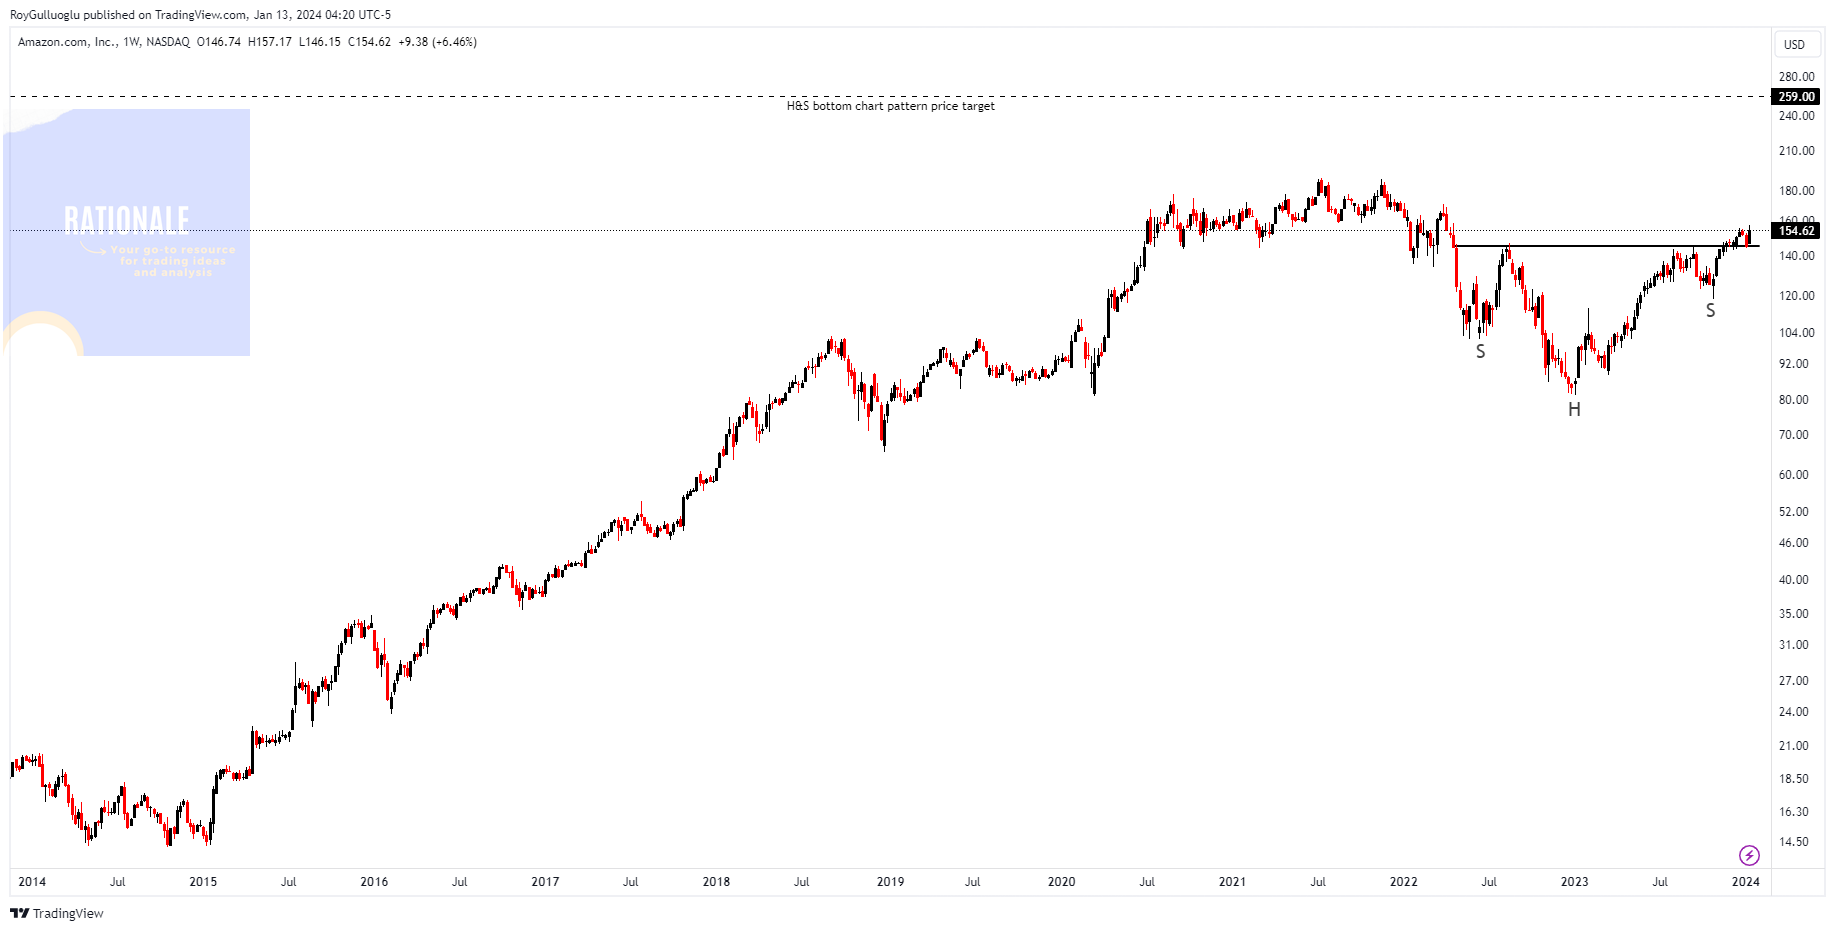
Amazon.com, Inc. participates in the retailing of consumer products and subscriptions via online and brick-and-mortar stores across North America and globally. The company's operations are divided into North American, International, and Amazon Web Services (AWS) segments.
The above weekly chart formed an approximately 20-month-long H&S bottom chart pattern as a bullish reversal after a downtrend.
Within this pattern, the boundary at 145 levels acted as a resistance.
A daily close above 149.35 levels validated the breakout from the 20-month-long H&S bottom chart pattern.
Based on this chart pattern, the potential price target is 259 levels.
AMZN, classified under the "consumer cyclical" sector, falls under the “Large Cap - Growth” stock category.
Multiple quarters of EPS, and revenue acceleration YoY in Quarterly Earnings is another strength of the stock.
Marathon Petroleum Corporation-(MPC/NYSE)-Long Idea
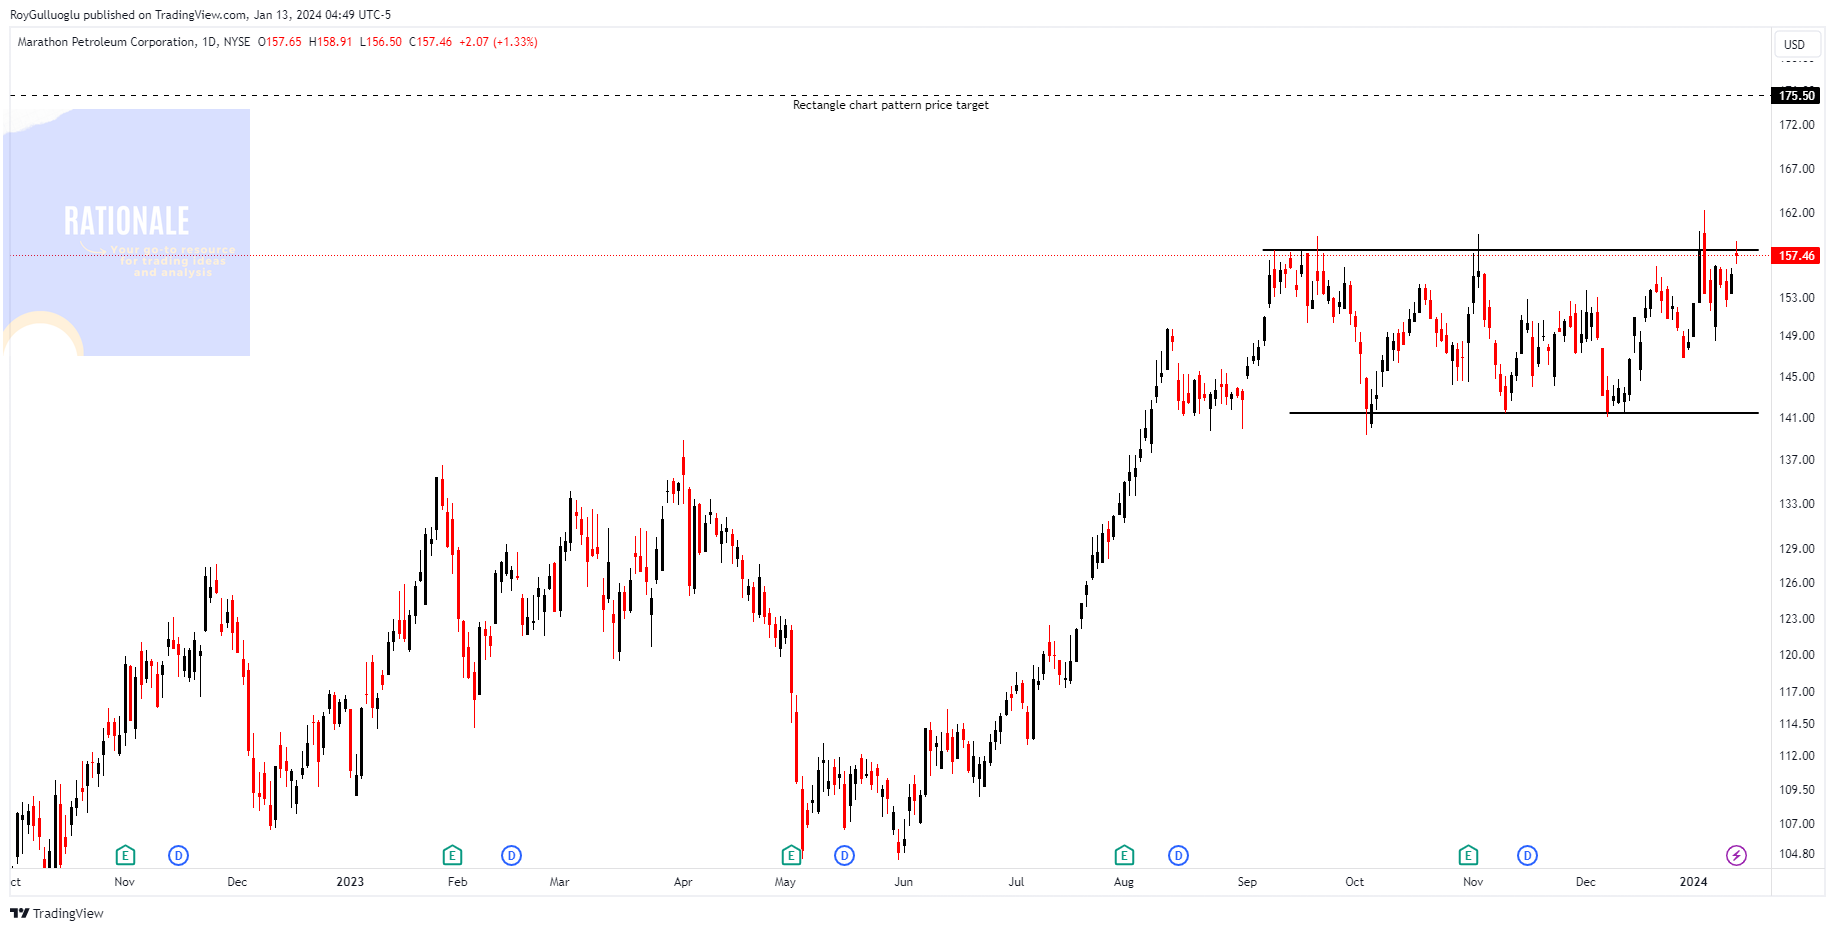
Marathon Petroleum Corporation, along with its subsidiaries, functions as a comprehensive downstream energy company mainly within the United States. The company operates in two key segments: Refining & Marketing and Midstream. In the Refining & Marketing segment, Marathon refines crude oil and various feedstocks in its refineries situated in the Gulf Coast, Mid-Continent, and West Coast regions of the United States.
The above daily chart formed an approximately 3-month-long rectangle chart pattern as a bullish continuation after an uptrend.
Within this pattern, the horizontal boundary at 158 levels acts as a resistance.
A daily close above 162.7 levels would validate the breakout from the 3-month-long rectangle chart pattern.
Based on this chart pattern, the potential price target is 175.5 levels.
MPC, classified under the "energy" sector, falls under the “Large Cap - Income” stock category.
Energy Transfer LP-(ET/NYSE)-Long Idea
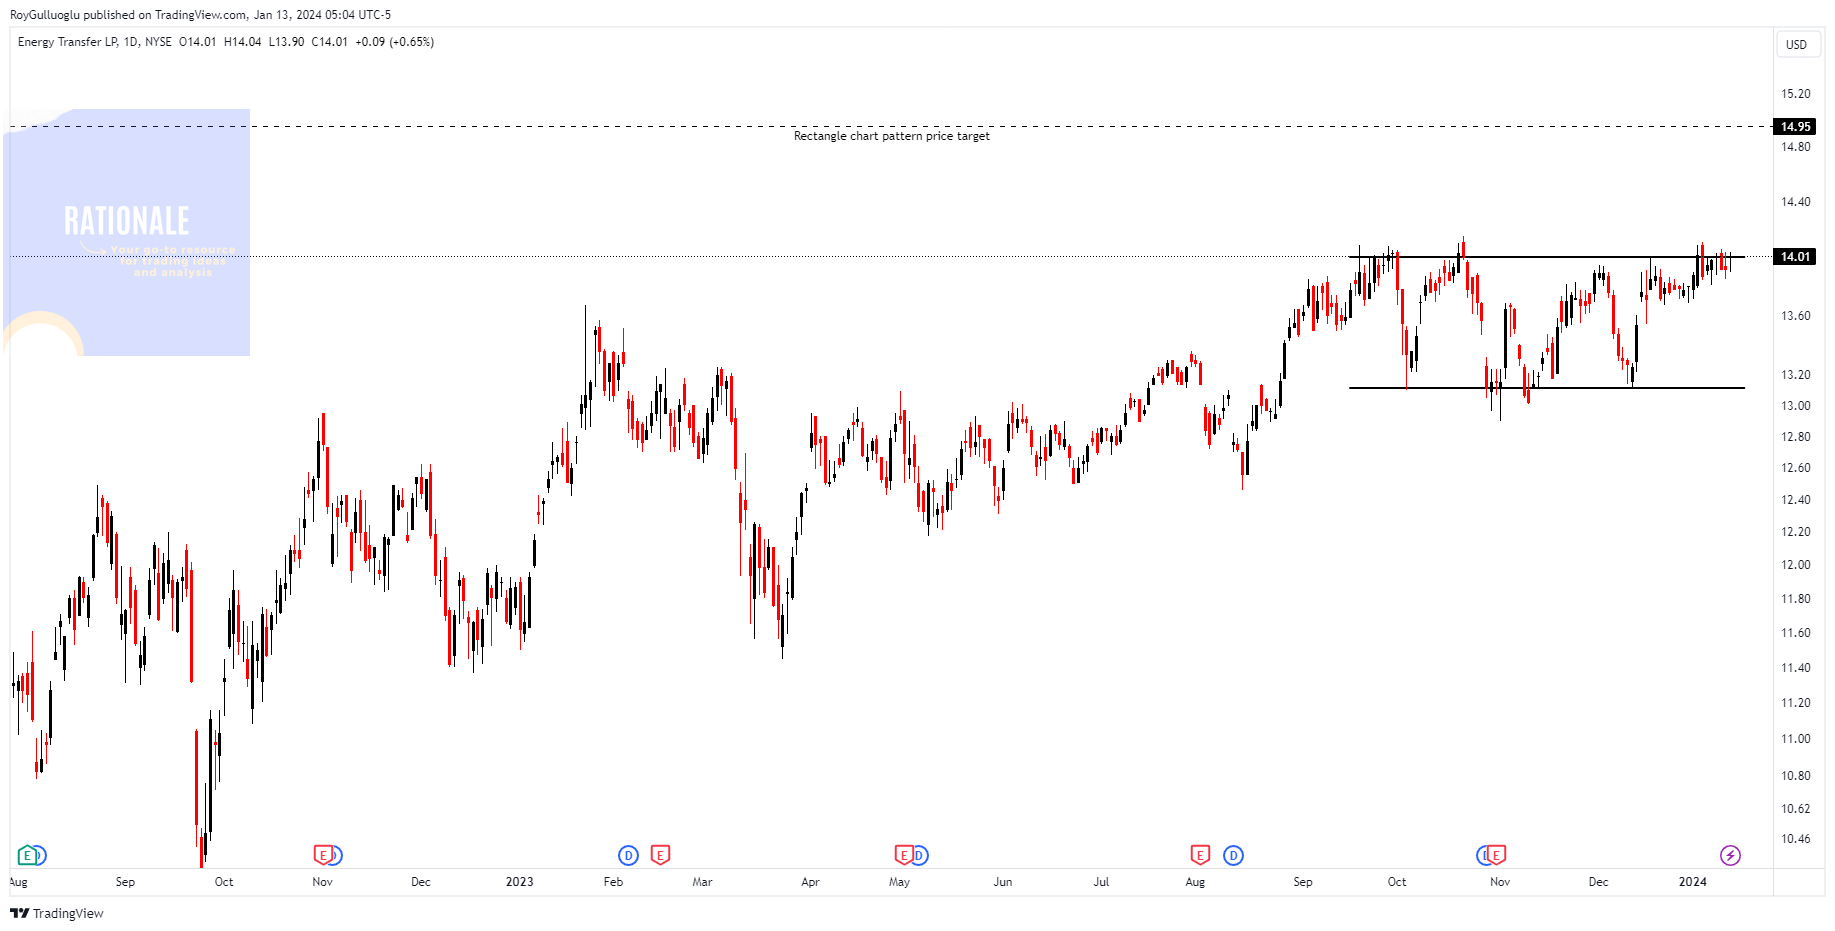
Energy Transfer LP delivers energy-related services, possessing ownership and operation of about 11,600 miles of natural gas transportation pipelines, along with three natural gas storage facilities in Texas and two in Oklahoma. Furthermore, Energy Transfer LP engages in the sale of natural gas to electric utilities, independent power plants, local distribution, and other marketing companies, as well as industrial end-users.
The above daily chart formed an approximately 3-month-long rectangle chart pattern as a bullish continuation after an uptrend.
Within this pattern, the horizontal boundary at 14 levels acts as a resistance.
A daily close above 14.4 levels would validate the breakout from the 3-month-long rectangle chart pattern.
Based on this chart pattern, the potential price target is 14.95 levels.
ET, classified under the "energy" sector, falls under the “Large Cap - Income” stock category.
Follow-ups
General Dynamics Corporation-(GD/NYSE)-Long Idea
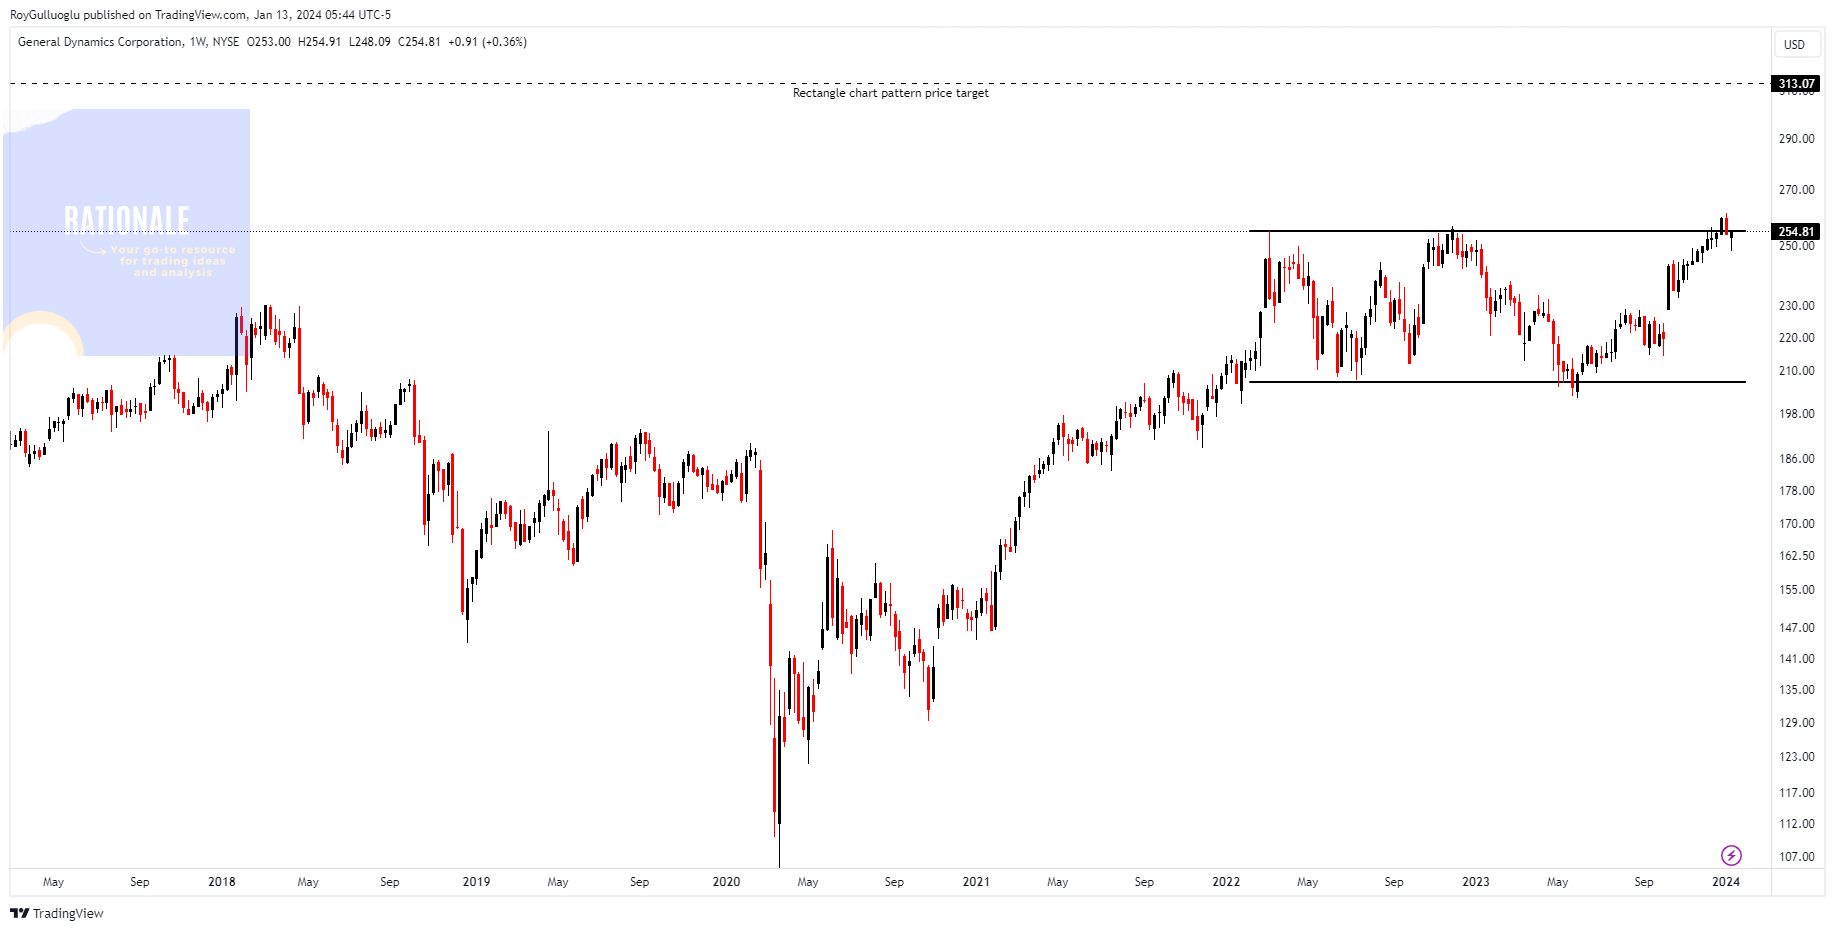
You can click the GD ticker above to access the first report explaining the RATIONALE behind the trade idea.
The rectangle chart pattern’s resistance is tested after the fake breakout.
NVIDIA Corporation-(NVDA/NASDAQ)-Long Idea
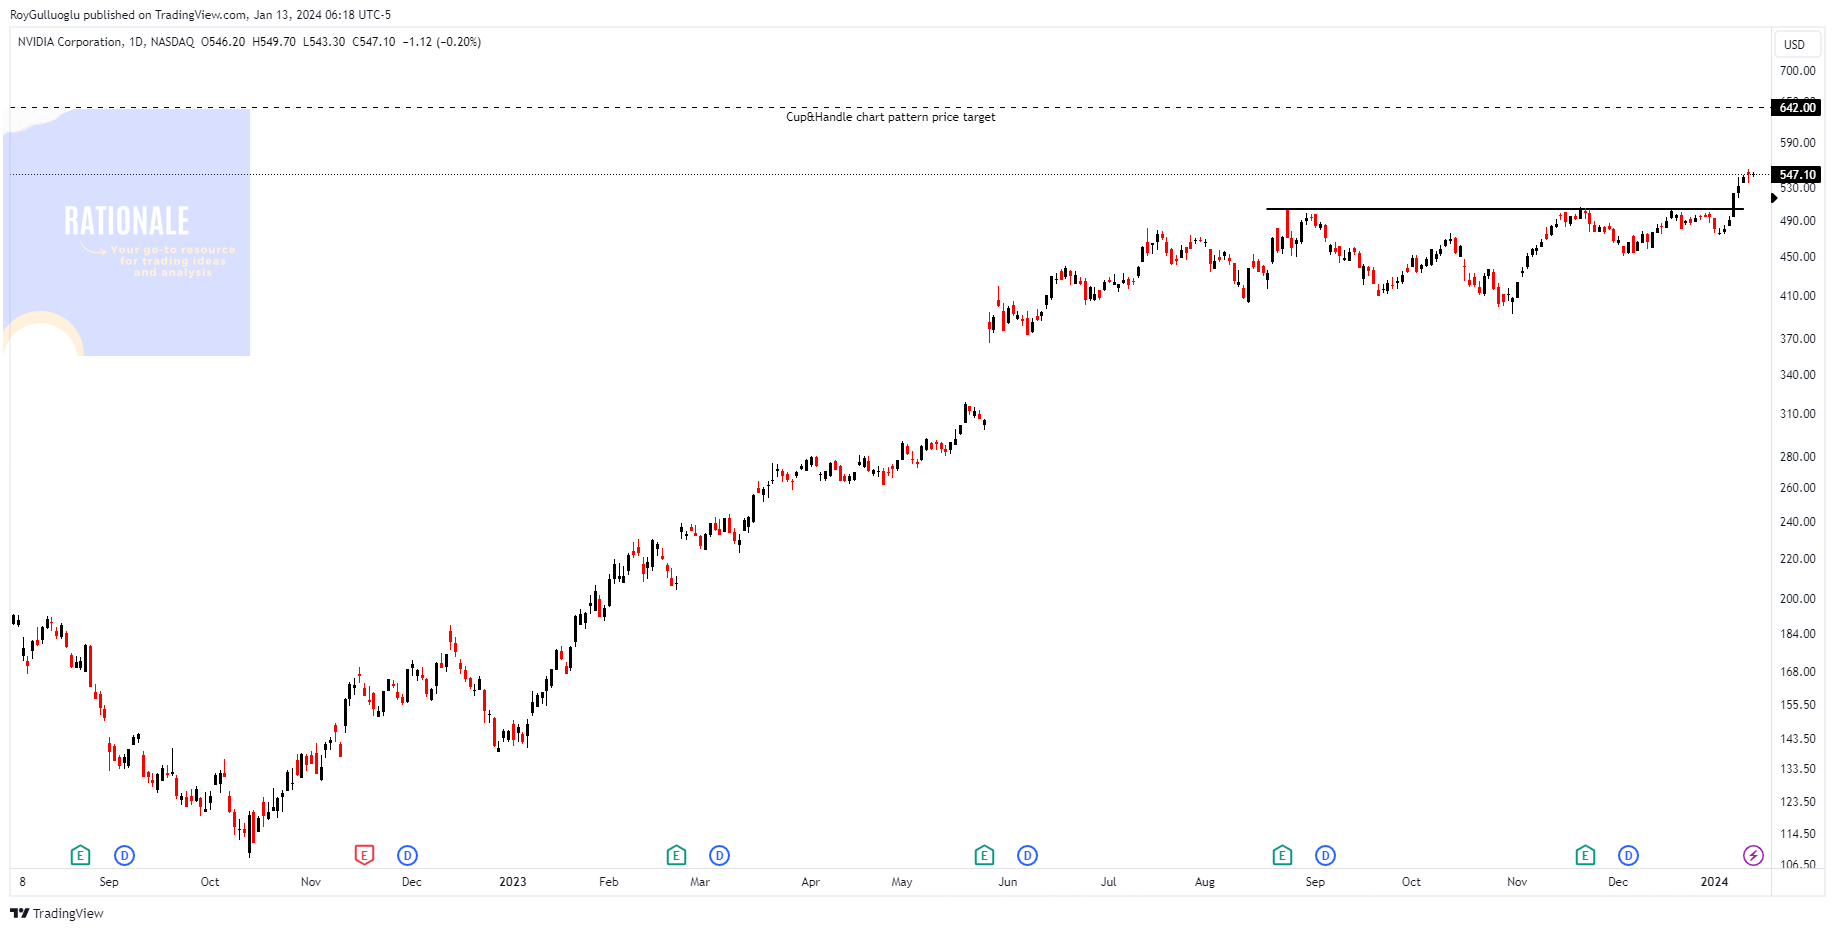
You can click the NVDA ticker above to access the first report explaining the RATIONALE behind the trade idea.
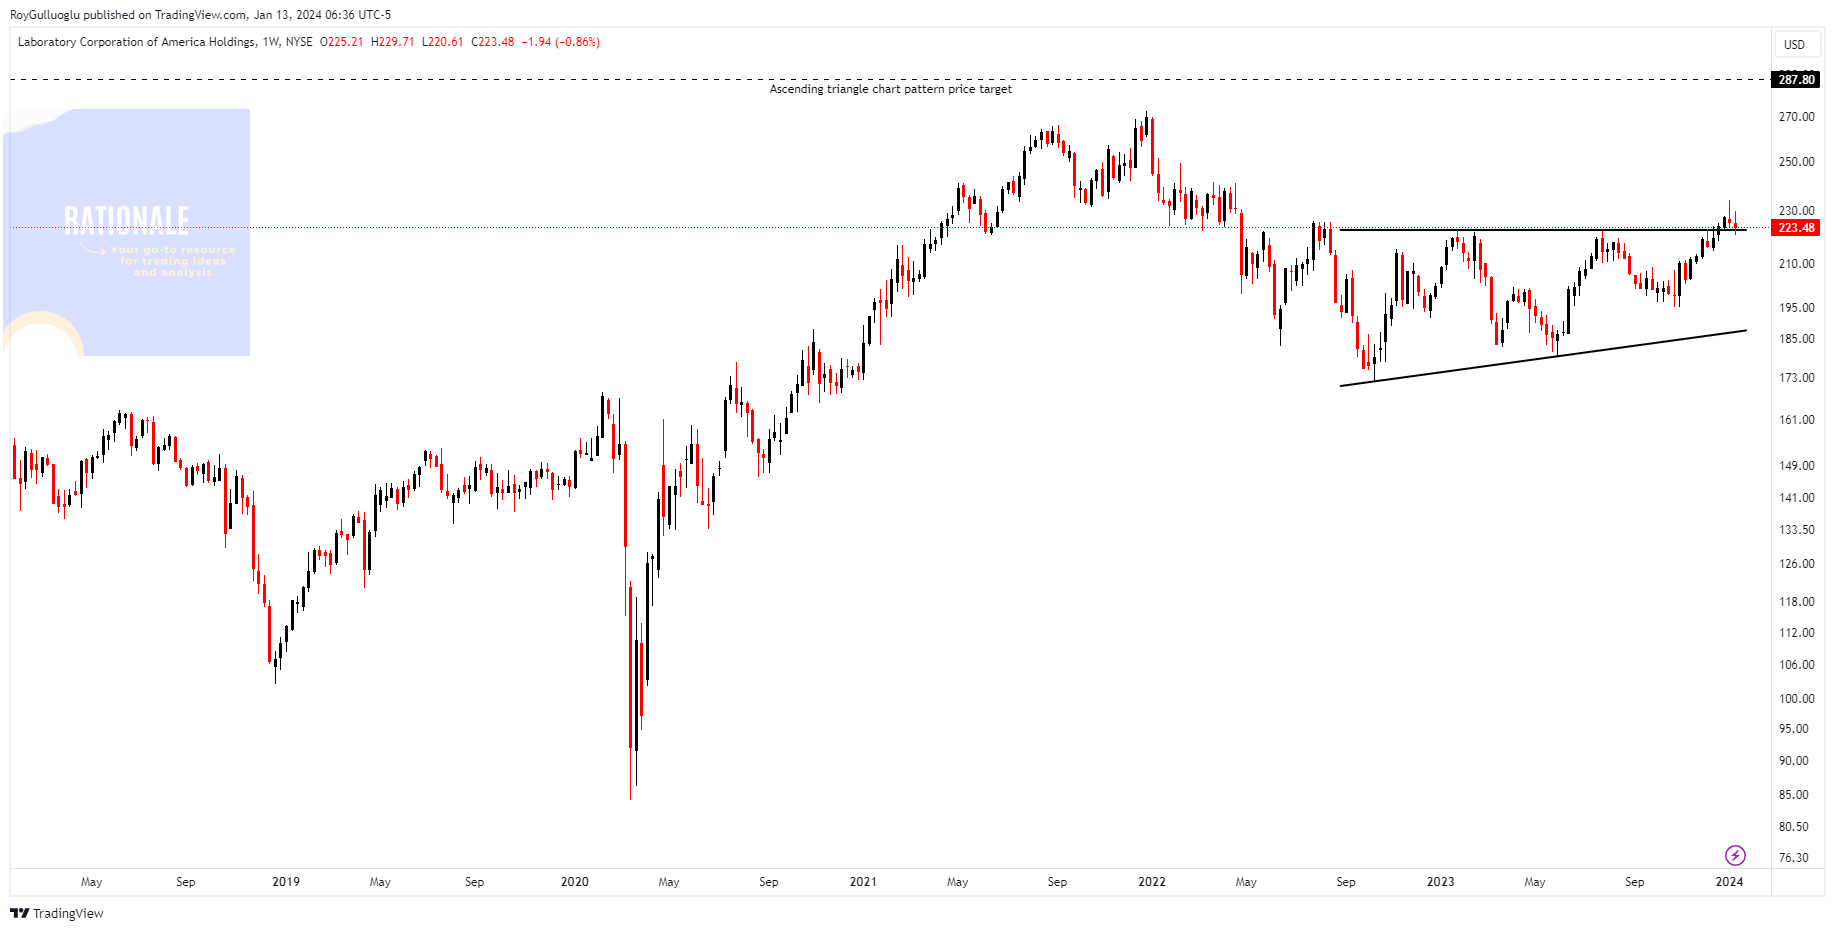
Laboratory Corporation of America Holdings-(LH/NYSE)-Long Idea

You can click the LH ticker above to access the first report explaining the RATIONALE behind the trade idea.