


UiPath, Inc.-(PATH/NYSE)-Long Idea
UiPath, Inc. provides an automation platform that offers a range of robotic process automation (RPA) solutions primarily in the United States, Romania, the United Kingdom, the Netherlands, and internationally.
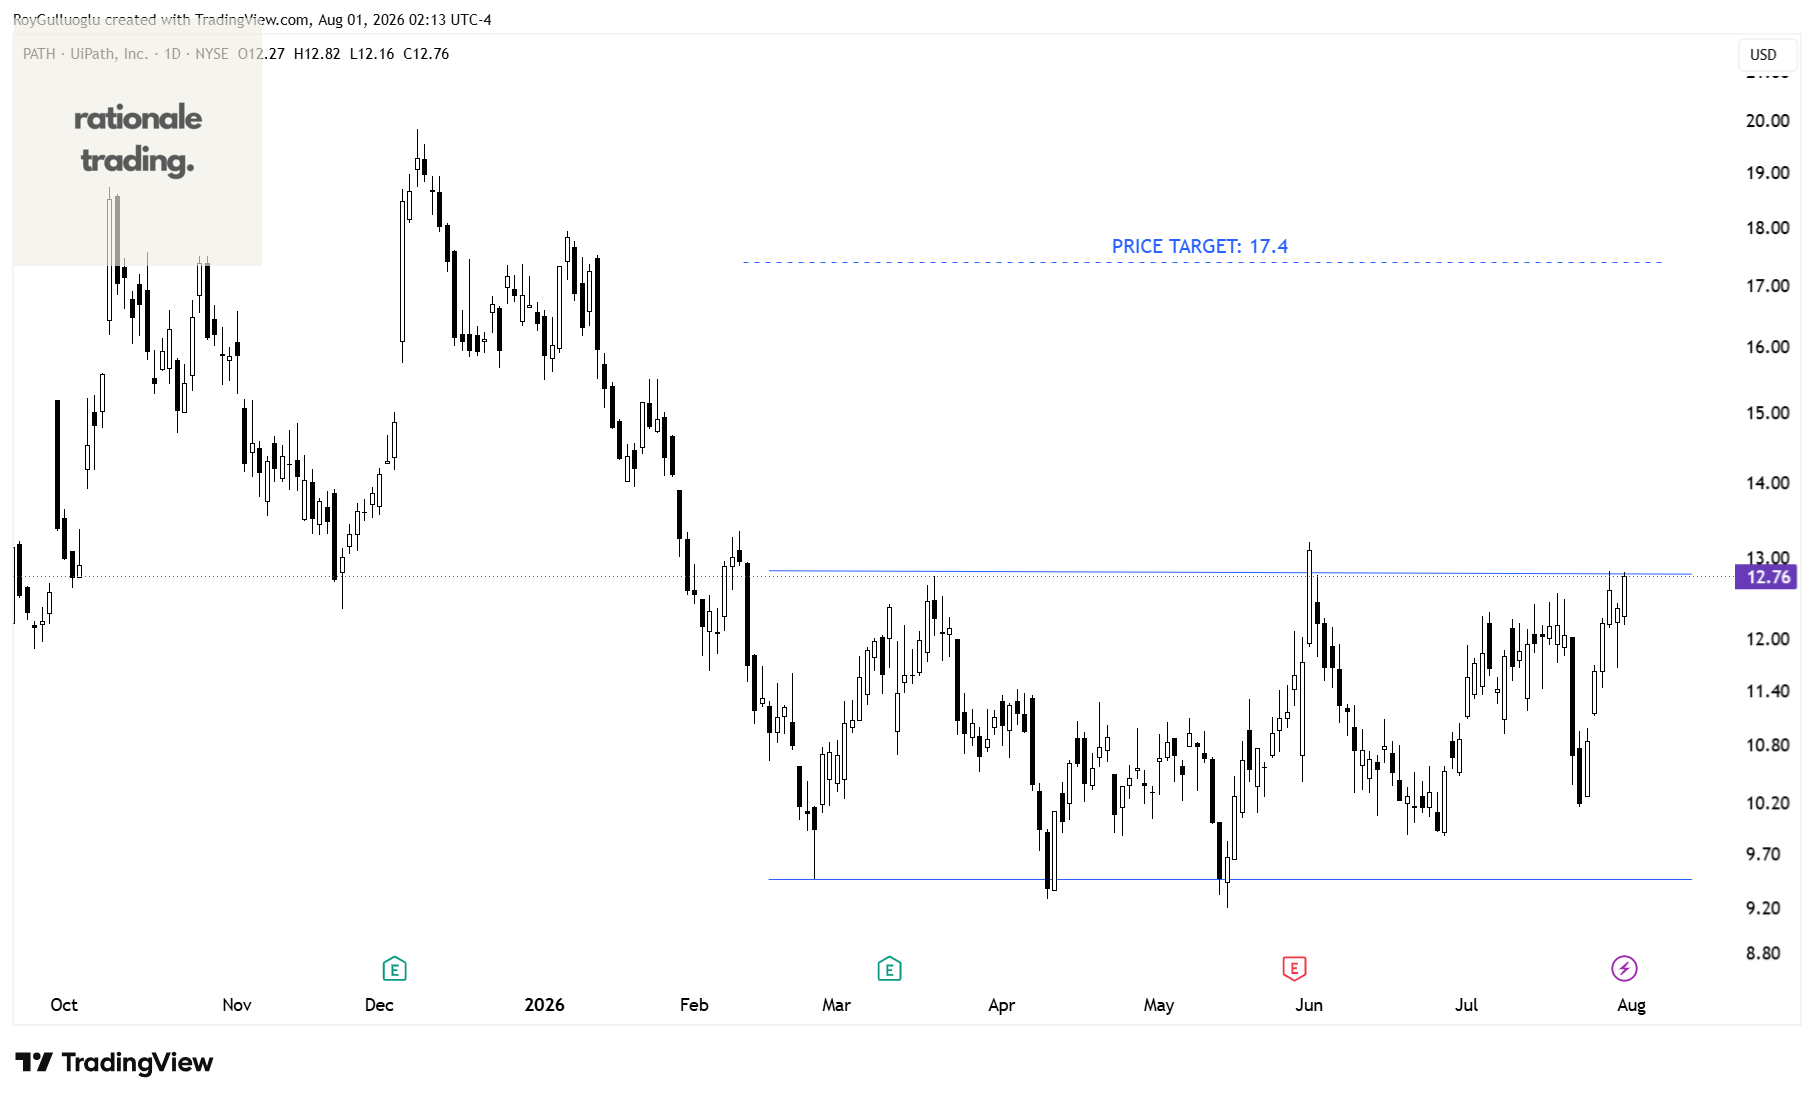
The above daily chart formed an approximately 4-month-long rectangle chart pattern as a bullish continuation after an uptrend.
Within this pattern, the horizontal boundary at 12.76 levels acts as a resistance.
A daily close below 13.14 levels would validate the breakout from the 4-month-long rectangle chart pattern.
Based on this chart pattern, the potential price target is 17.4 levels.
Southern Copper Corporation-(SCCO/NYSE)-Long Idea
Southern Copper Corporation engages in mining, exploring, smelting, and refining copper and other minerals in Mexico, the United States, Peru, Brazil, Chile, and Other American countries.
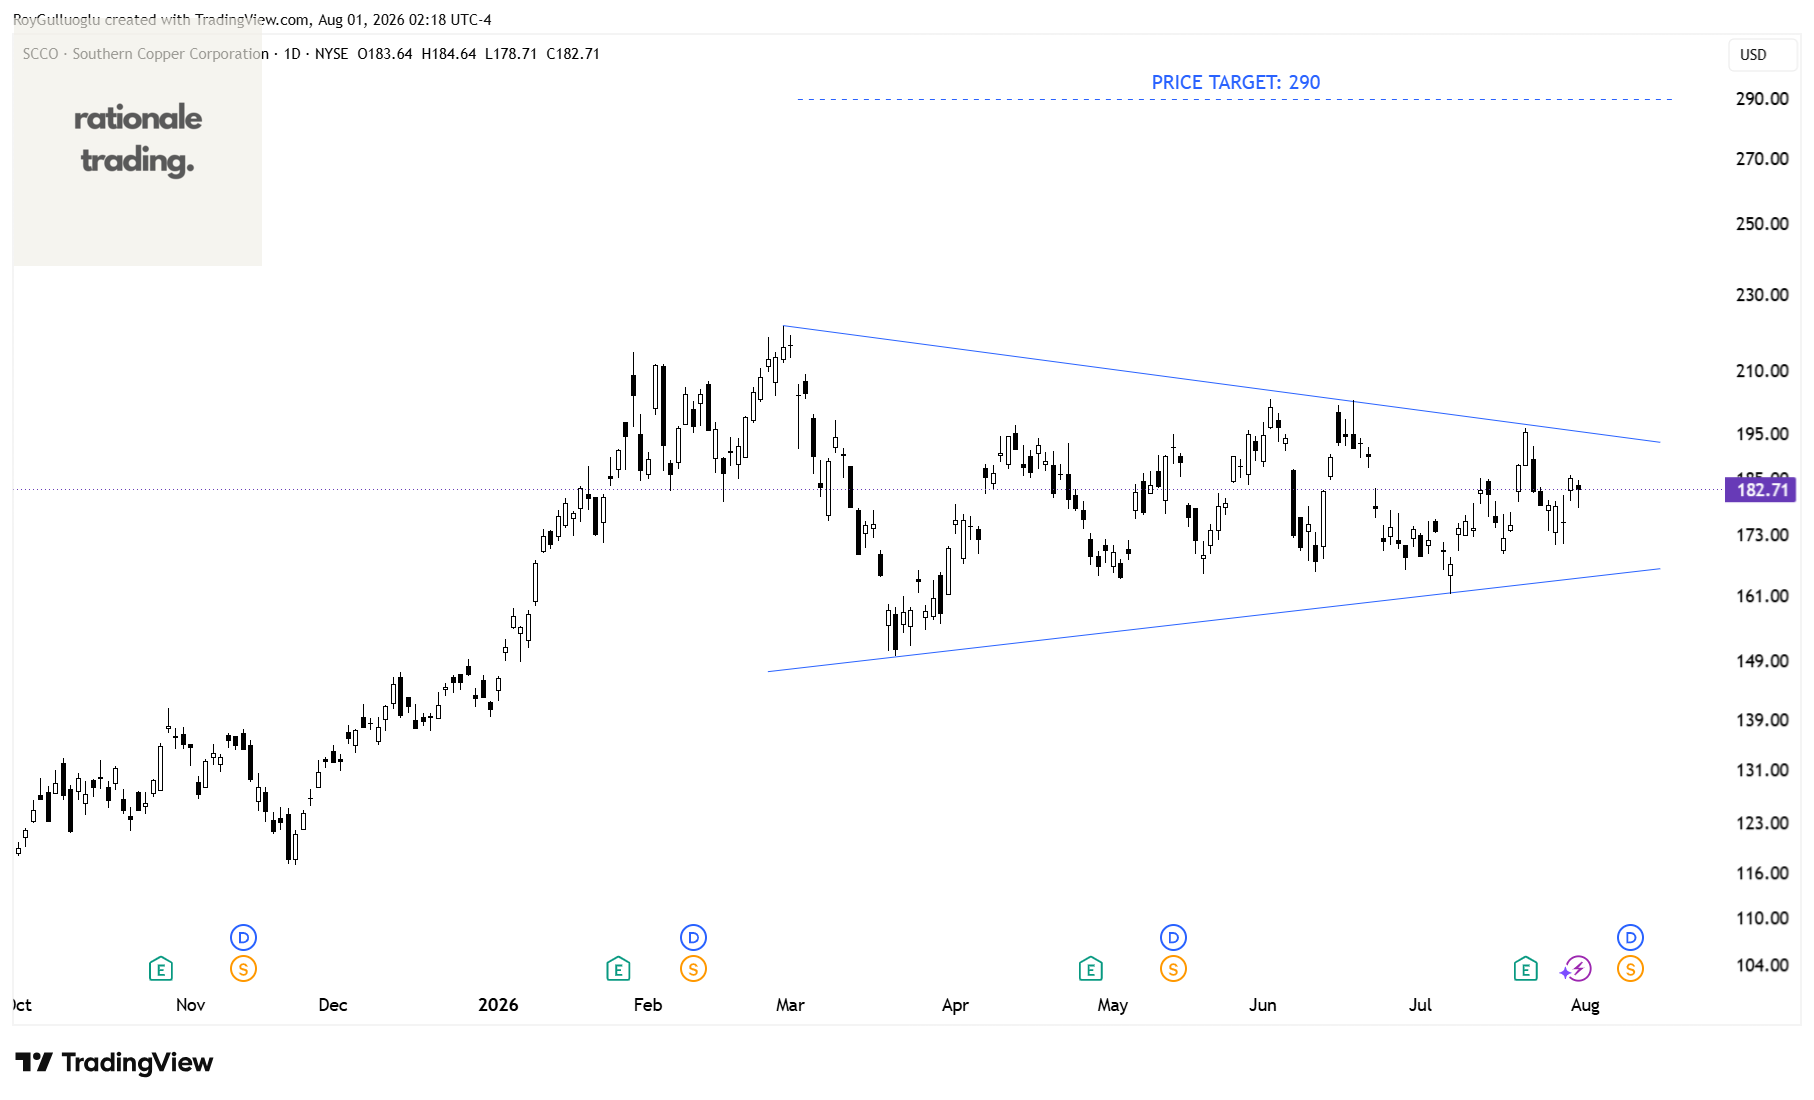
The above daily chart formed an approximately 4-month-long symmetrical triangle chart pattern as a bullish continuation after an uptrend.
A daily close above 202.35 levels would validate the breakout from the 4-month-long cup & handle chart pattern.
Based on this chart pattern, the potential price target is 290 levels.
Fastly, Inc.-(FSLY/NASDAQ)-Long Idea
Fastly, Inc. operates an edge cloud platform for processing, serving, and securing its customer’s applications in the United States, the Asia Pacific, Europe, and internationally.
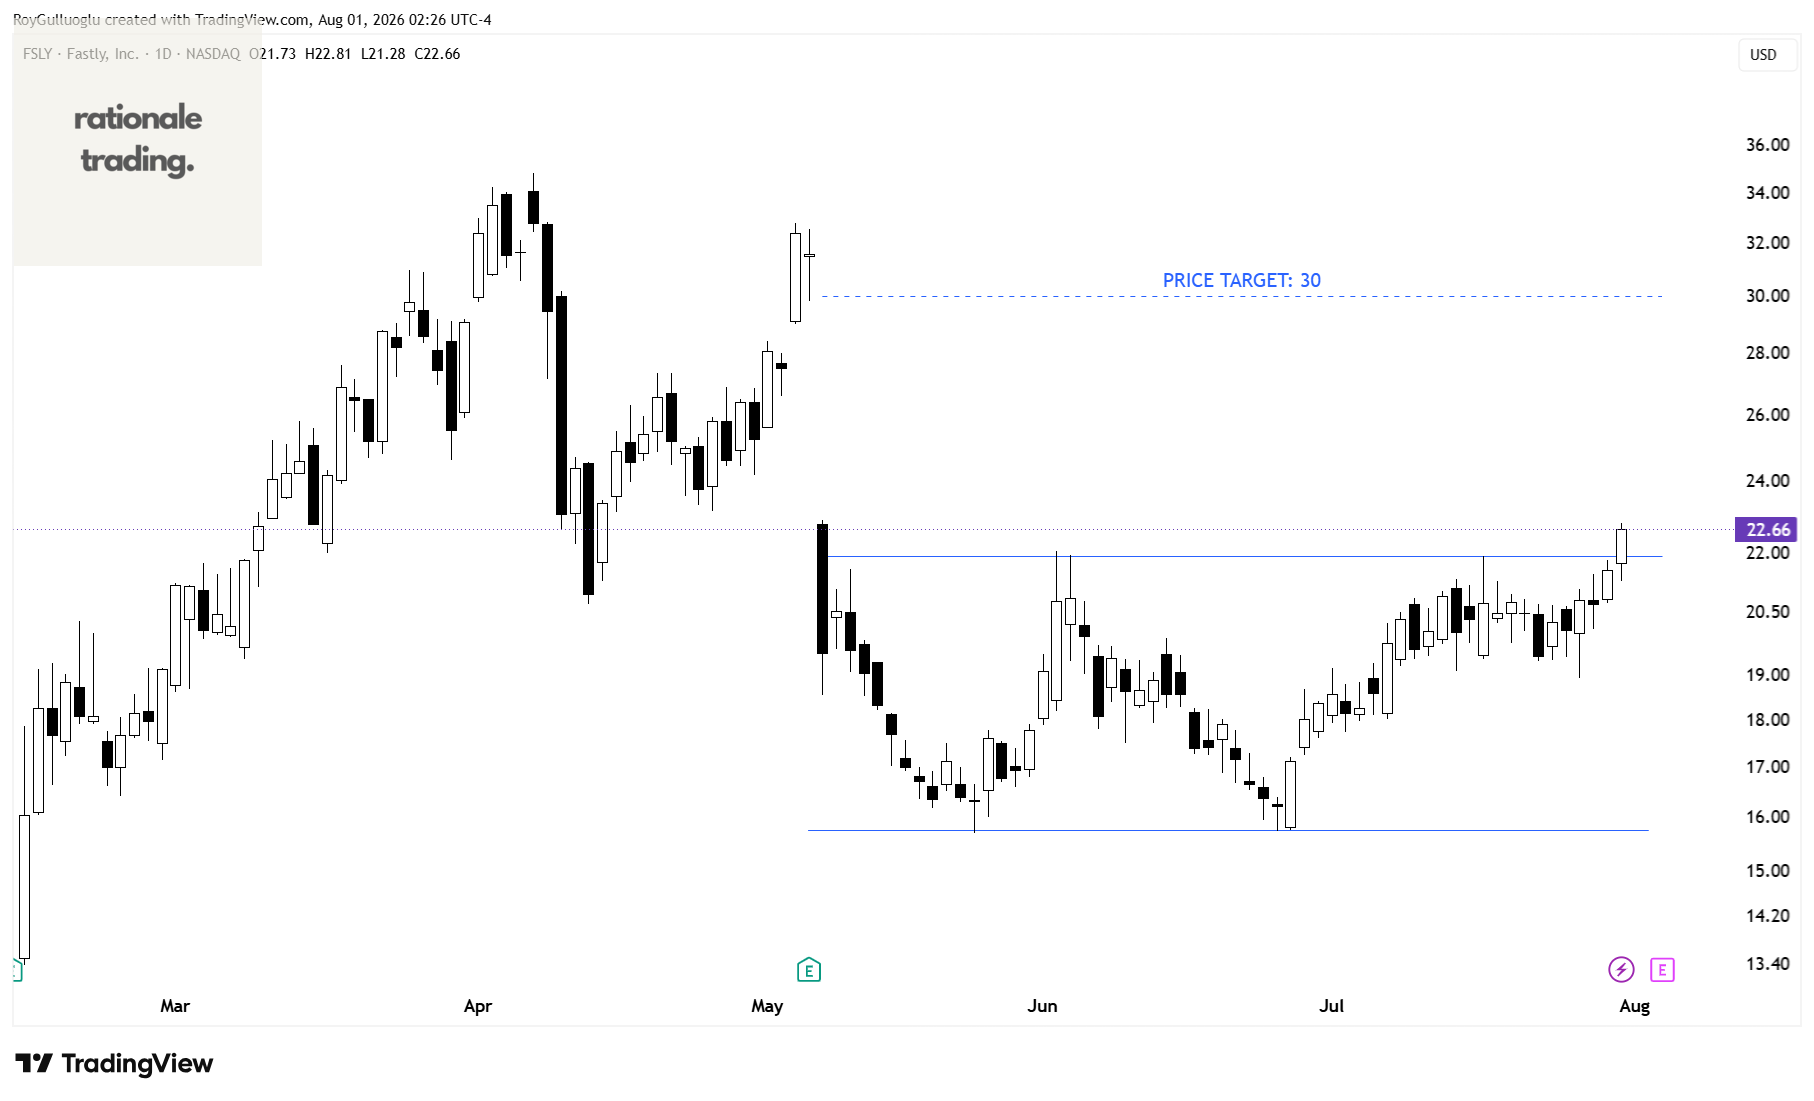
The above daily chart formed an approximately 2-month-long rectangle chart pattern as a bullish reversal after a downtrend.
Within this pattern, the horizontal boundary at 21.93 levels acted as a resistance.
A daily close above 22.58 levels validated the breakout from the 2-month-long rectangle chart pattern.
Based on this chart pattern, the potential price target is 30 levels.
ServiceTitan, Inc.-(TTAN/NASDAQ)-Long Idea
ServiceTitan, Inc. provides an end-to-end cloud-based software platform in the United States, Armenia, and Canada.
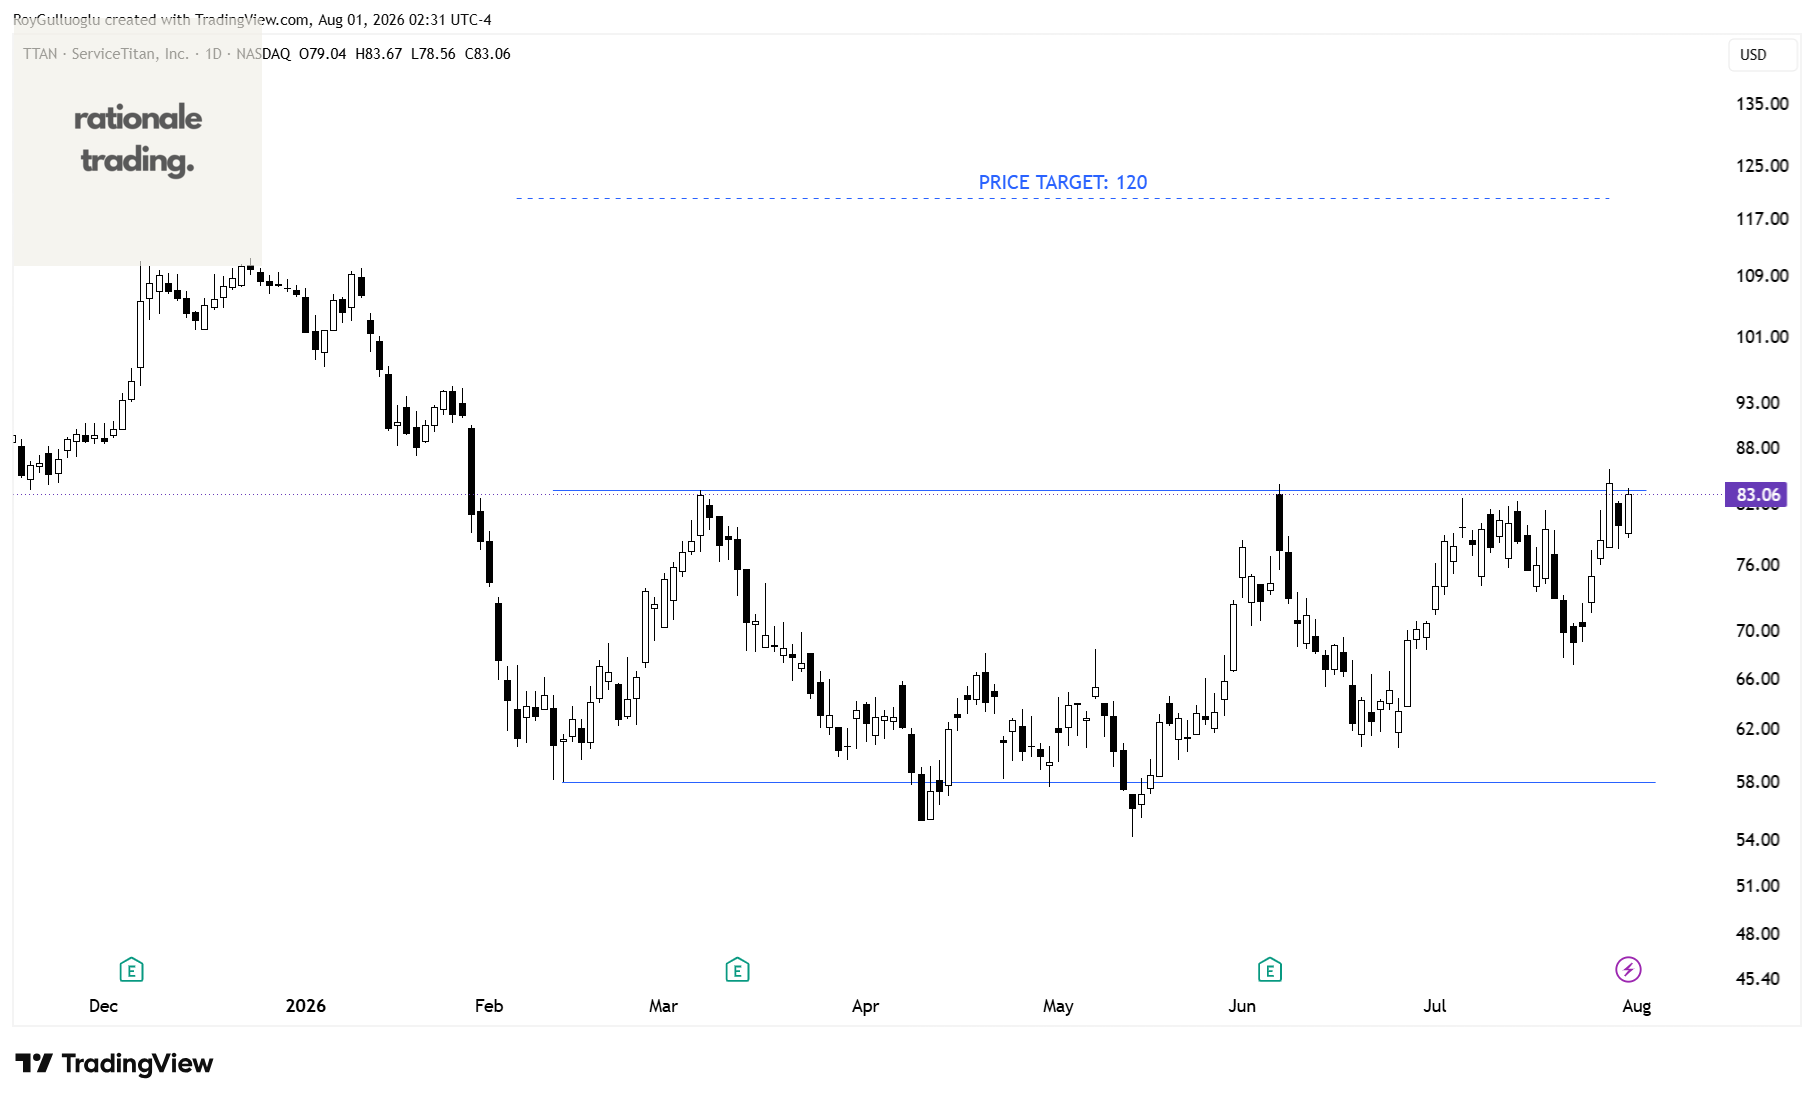
The above daily chart formed an approximately 4-month-long rectangle chart pattern as a bullish reversal after a downtrend.
Within this pattern, the horizontal boundary at 83.45 levels acts as a resistance.
A daily close above 85.95 levels would validate the breakout from the 4-month-long rectangle chart pattern.
Based on this chart pattern, the potential price target is 120 levels.
Okeanis Eco Tankers Corp.-(ECO/NYSE)-Long Idea
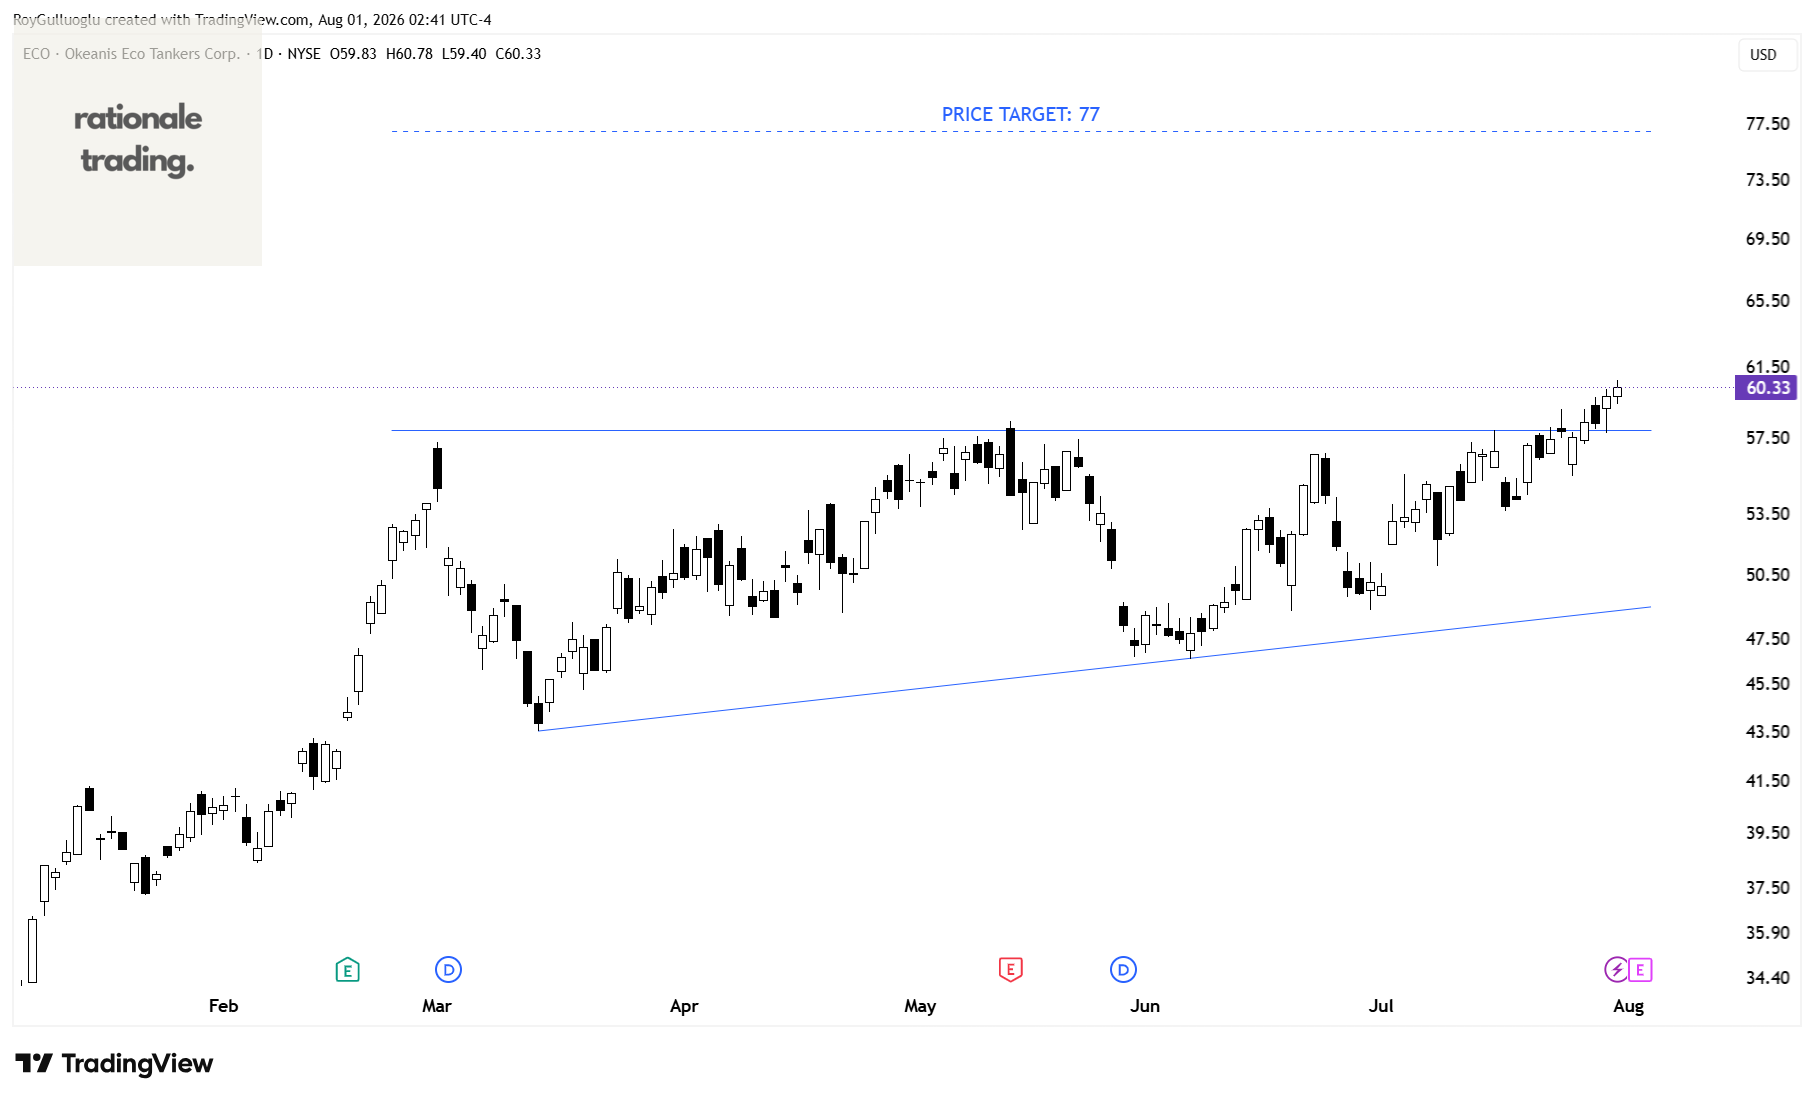
Okeanis Eco Tankers Corp., a shipping company, owns and operates tanker vessels worldwide.
The above daily chart formed an approximately 3-month-long ascending triangle chart pattern as a bullish continuation after an uptrend.
Within this pattern, the horizontal boundary at 57.93 levels acts as a resistance.
A daily close above 59.65 levels would validate the breakout from the 3-month-long ascending triangle chart pattern.
Based on this chart pattern, the potential price target is 77 levels.
ePlus inc.-(PLUS/NASDAQ)-Long Idea
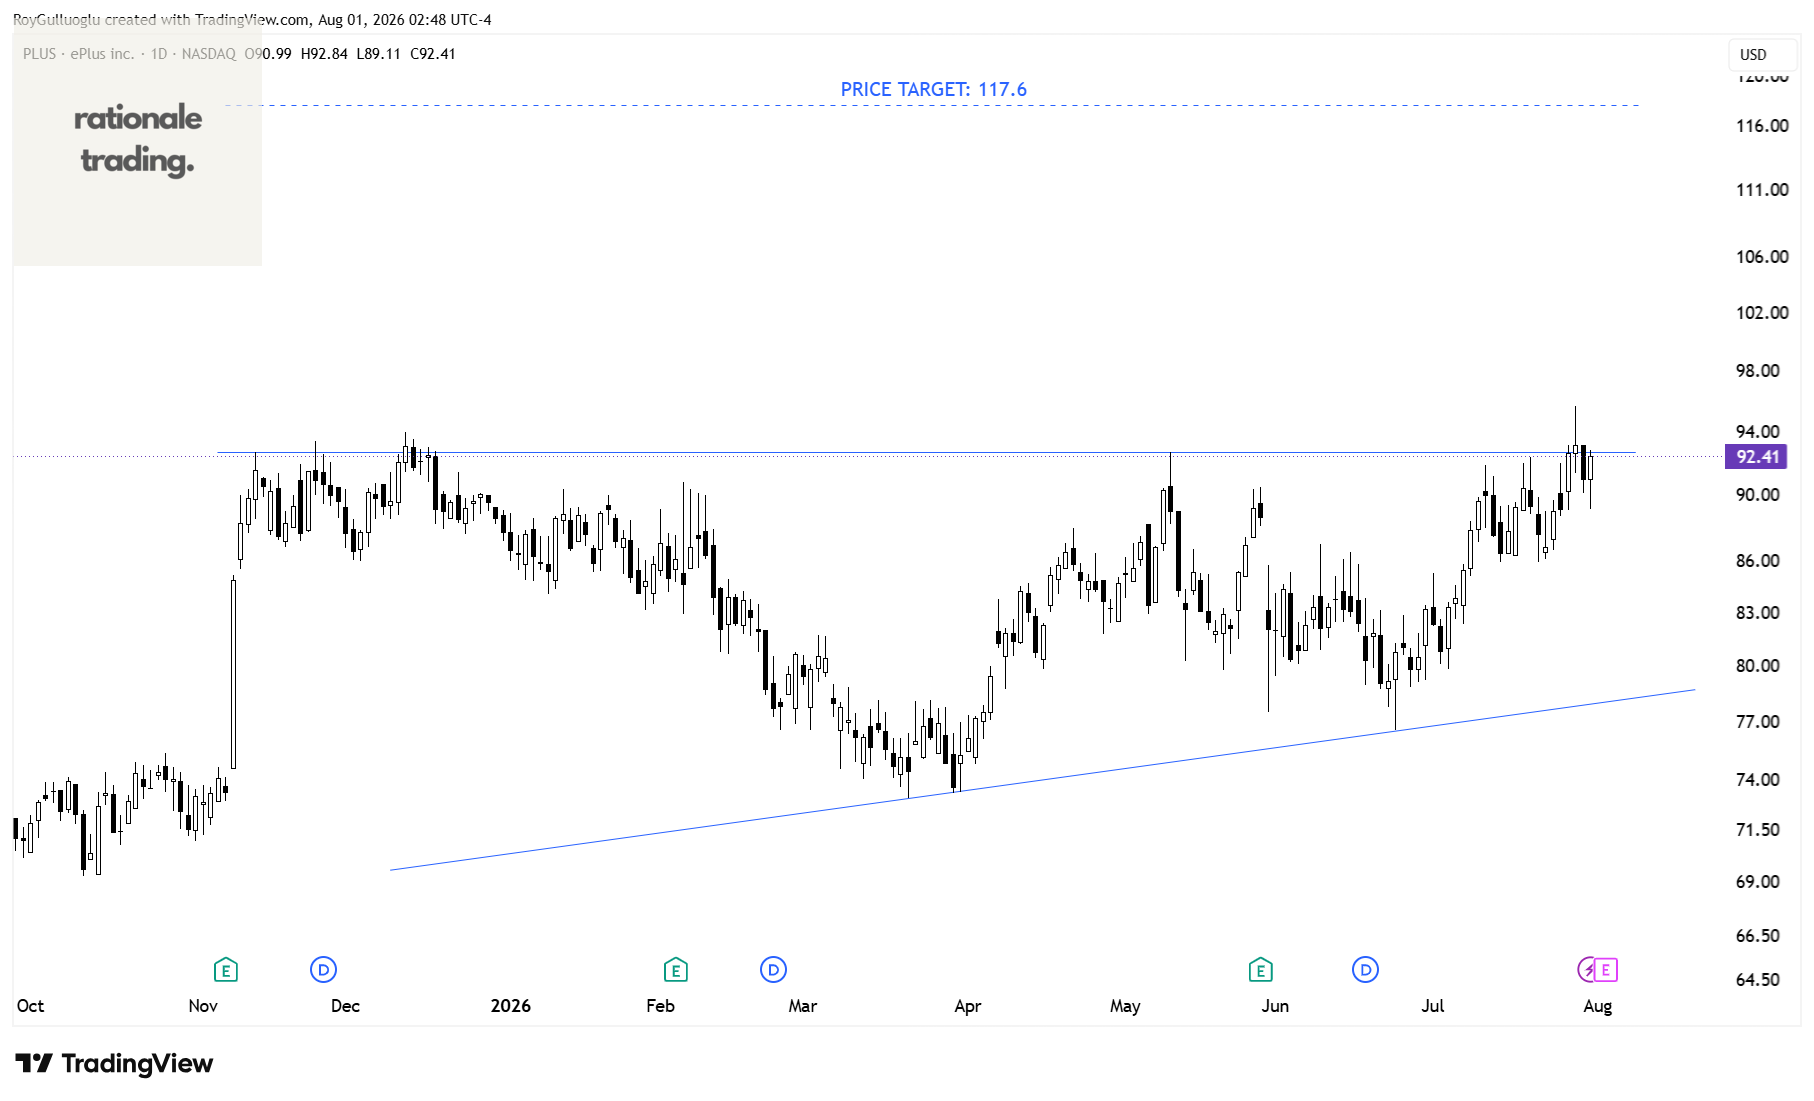
ePlus inc., together with its subsidiaries, provides information technology (IT) solutions that enable organizations to optimize IT environment and supply chain processes in the United States and internationally.
The above daily chart formed an approximately 6-month-long ascending triangle chart pattern as a bullish continuation after an uptrend.
Within this pattern, the horizontal boundary at 92.67 levels acts as a resistance.
A daily close above 95.45 levels would validate the breakout from the 6-month-long ascending triangle chart pattern.
Based on this chart pattern, the potential price target is 117.6 levels.
Honeywell International Inc.-(HON/NASDAQ)-Long Idea
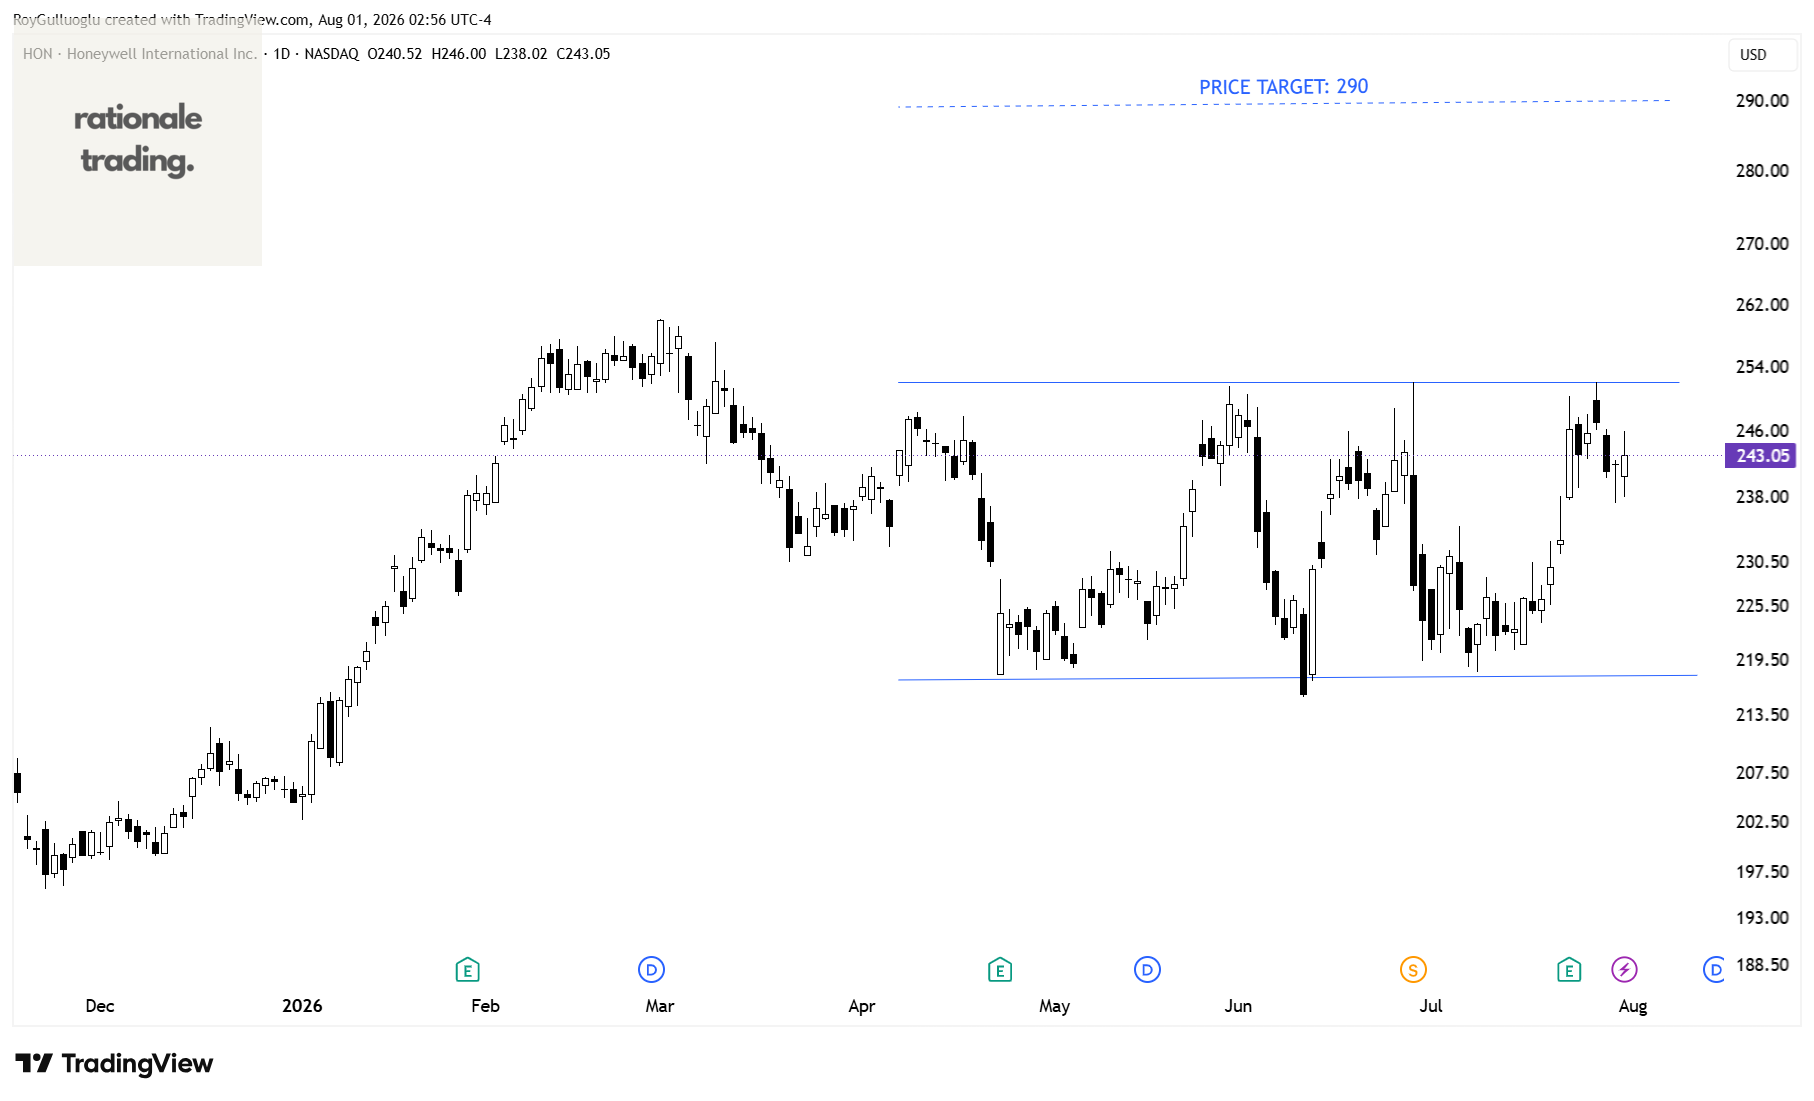
Honeywell International Inc. engages in the industrial automation, building automation, and energy and sustainability solutions businesses in the United States, Europe, and internationally.
The above daily chart formed an approximately 3-month-long rectangle chart pattern.
Within this pattern, the horizontal boundary at 252 levels acts as a resistance.
A daily close above 259.5 levels would validate the breakout from the 3-month-long rectangle chart pattern.
Based on this chart pattern, the potential price target is 290 levels.
Hi Roy, good to be here! These classical charting setups will be a welcome addition to my existing membership with a very similar approach. Is there a current Rationale watch list? Or do I simply just flick through past reports? Thanks!