

Trade Ideas Equities
CDRE(NYSE), TOST(NYSE), NVDA(NASDAQ), DSV(OMXCOP), NEM(XETR), ALO(EURONEXT)

Cadre Holdings, Inc.-(CDRE/NYSE)-Long Idea
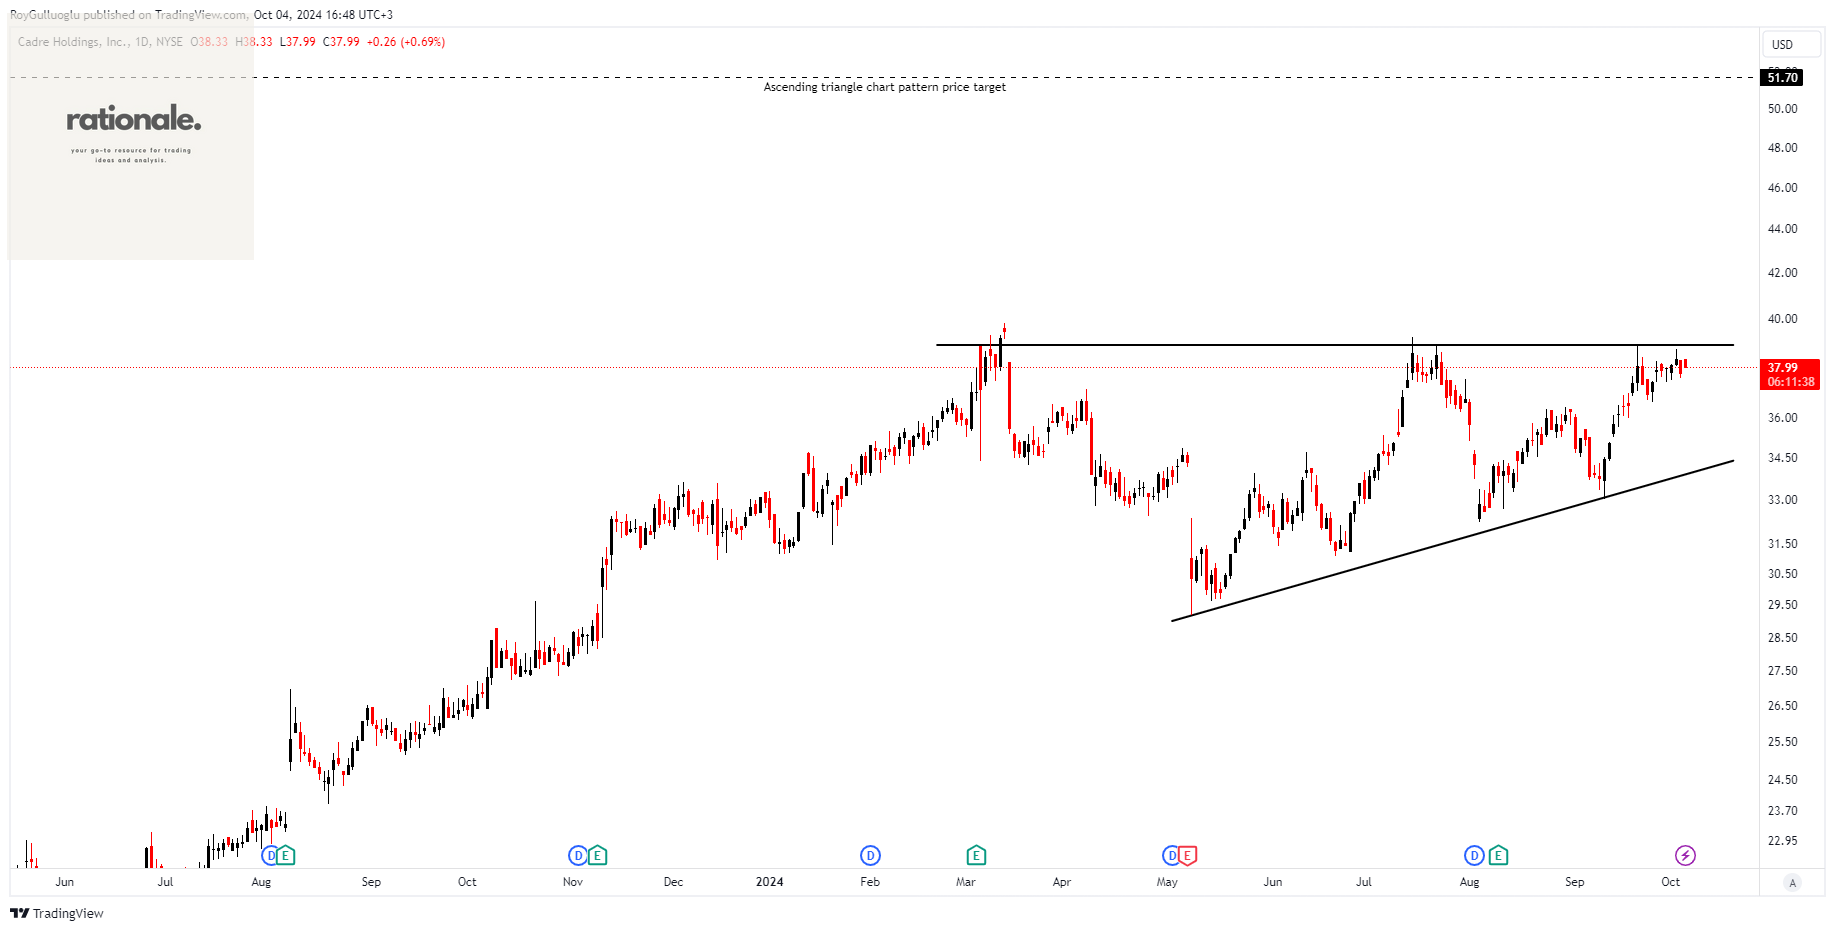
Cadre Holdings, Inc. manufactures and distributes safety that provides protection to users in hazardous or life-threatening situations in the United States and internationally.
The above daily chart formed an approximately 5-month-long ascending triangle chart pattern as a bullish continuation after an uptrend.
The horizontal boundary at 38.9 levels acts as a resistance within this pattern.
A daily close above 40 levels would validate the breakout from the 5-month-long ascending triangle chart pattern.
Based on this chart pattern, the potential price target is 51.7 levels.
CDRE, classified under the "industrials" sector, falls under the “Small Cap - Value” stock category.
Toast, Inc.-(TOST/NYSE)-Long Idea
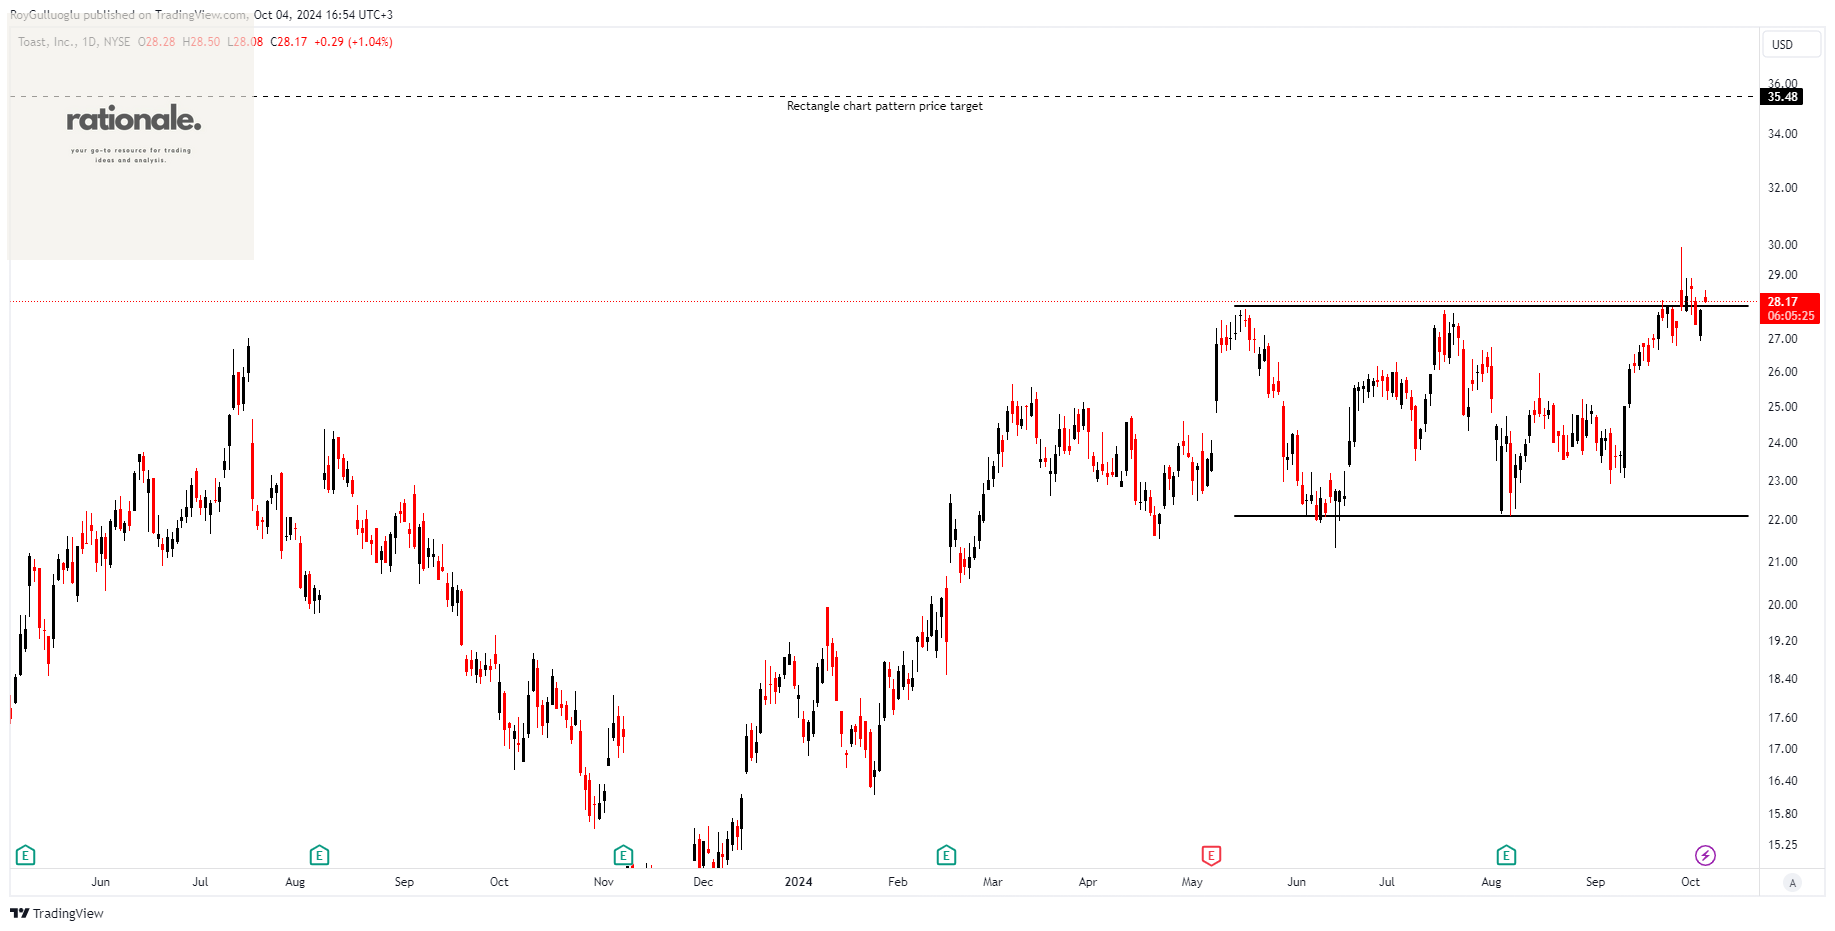
Toast, Inc. operates a cloud-based digital technology platform for the restaurant industry in the United States, Ireland, and India.
The above daily chart formed an approximately 3-month-long rectangle chart pattern as a bullish continuation after an uptrend.
The horizontal boundary at 28 levels acts as a resistance within this pattern.
A daily close above 28.84 levels would validate the breakout from the 3-month-long rectangle chart pattern.
Based on this chart pattern, the potential price target is 35.48 levels.
TOST, classified under the "technology" sector, falls under the “Large Cap - Growth” stock category.
NVIDIA Corporation-(NVDA/NASDAQ)-Long Idea
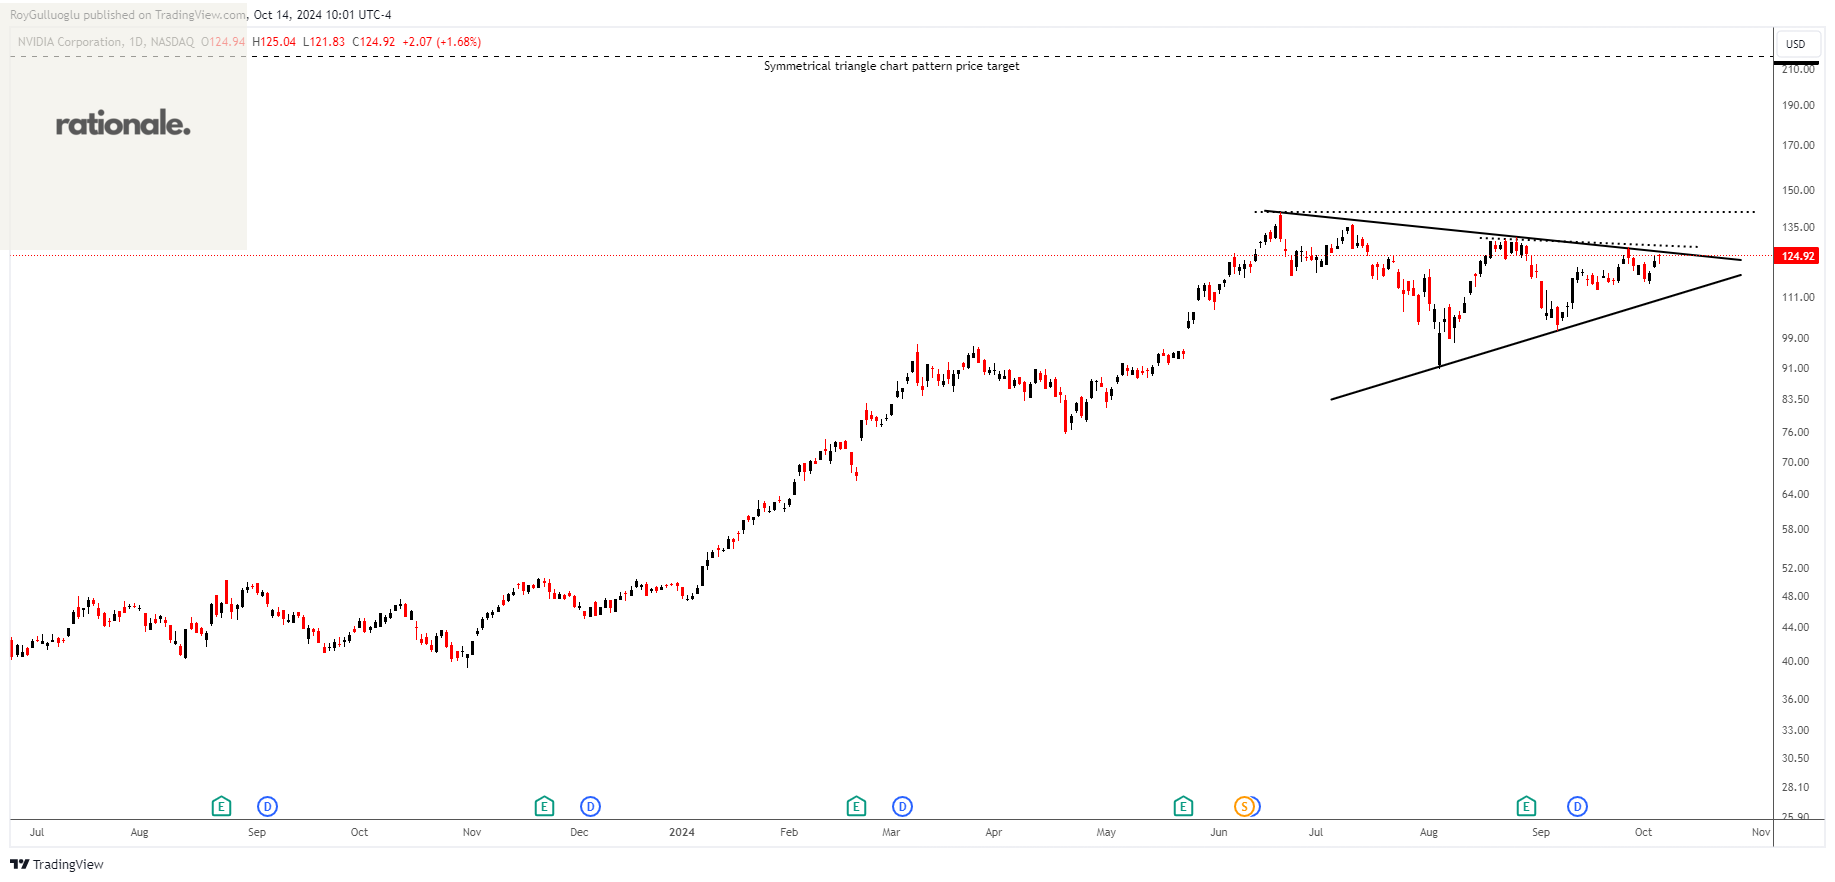
NVIDIA Corporation provides graphics and compute and networking solutions in the United States, Taiwan, China, Hong Kong, and internationally.
The above daily chart formed an approximately 3-month-long symmetrical triangle chart pattern as a bullish continuation after an uptrend.
The horizontal boundary at 127.67 levels acts as a resistance within this pattern.
A daily close above 131.5 levels would validate the breakout from the 3-month-long symmetrical triangle chart pattern.
Based on this chart pattern, the potential price target is 218 levels.
NVDA, classified under the "technology" sector, falls under the “Large Cap - Growth” stock category.
DSV A/S-(DSV/OMXCOP)-Long Idea
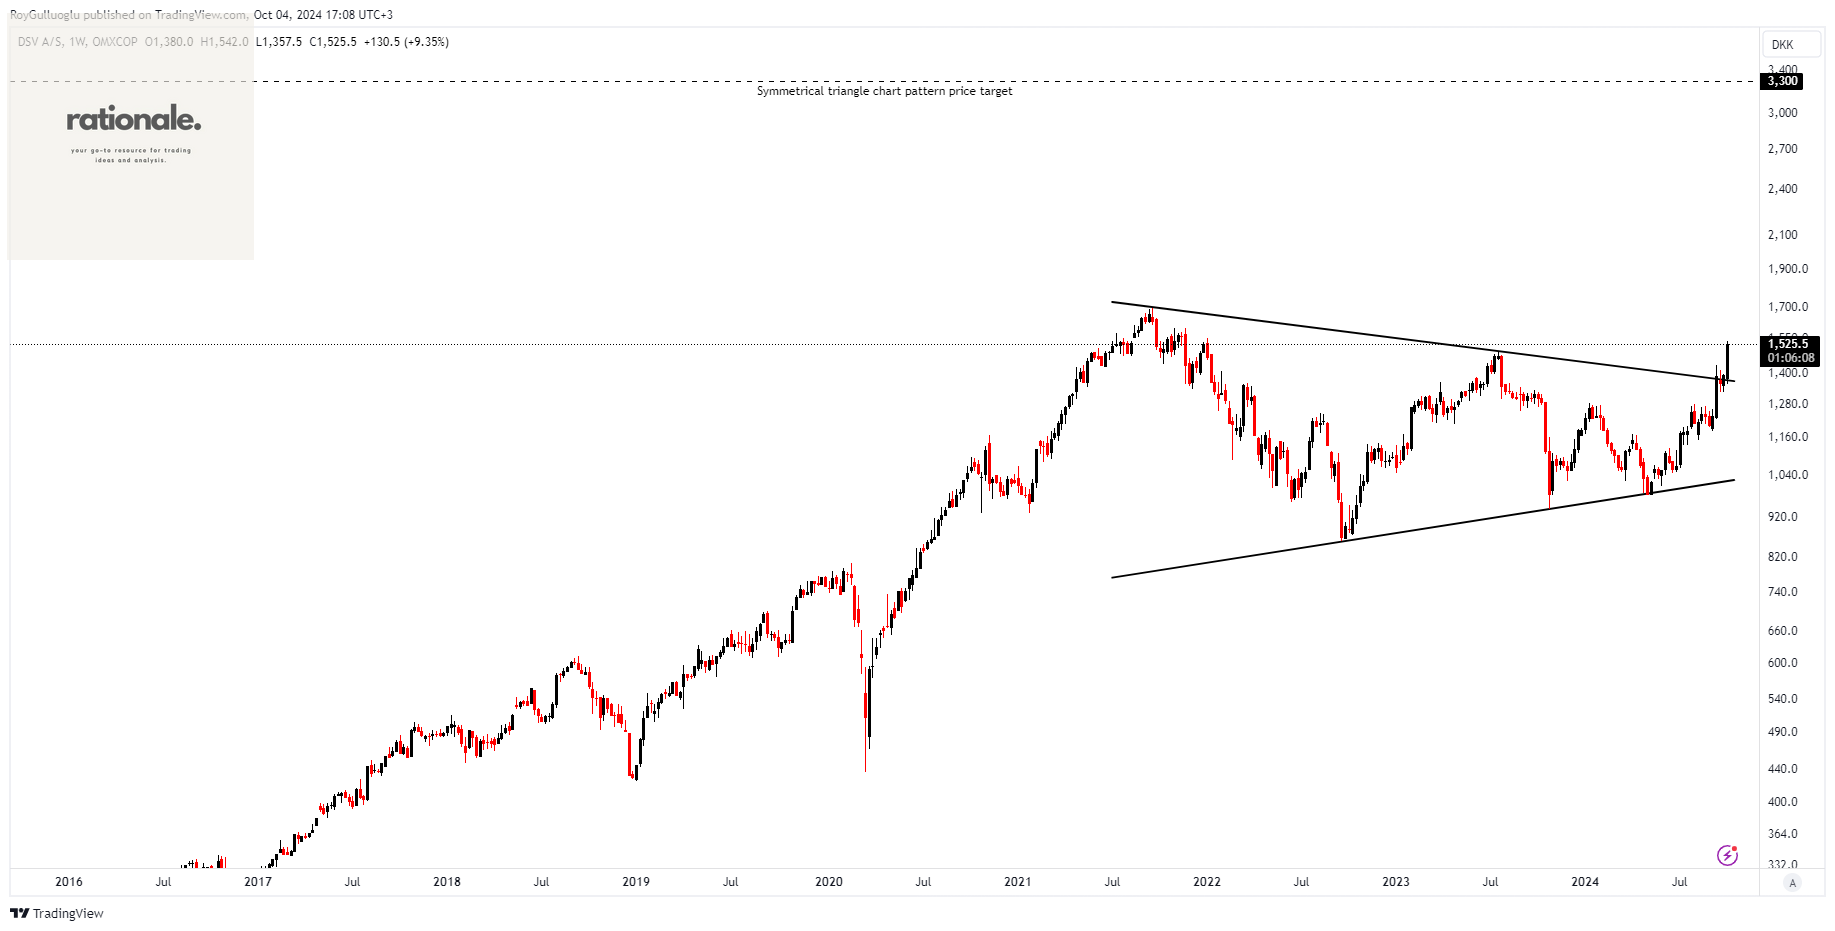
DSV A/S offers transport and logistics services in Europe, the Middle East, Africa, North America, South America, Asia, Australia, and the Pacific.
The above weekly chart formed an approximately 38-month-long symmetrical triangle chart pattern as a bullish continuation after an uptrend.
A daily close above 1450 levels validated the breakout from the 38-month-long symmetrical triangle chart pattern.
Based on this chart pattern, the potential price target is 3300 levels.
DSV, classified under the "industrials" sector, falls under the “Large Cap - Value” stock category.
Nemetschek SE-(NEM/XETR)-Long Idea
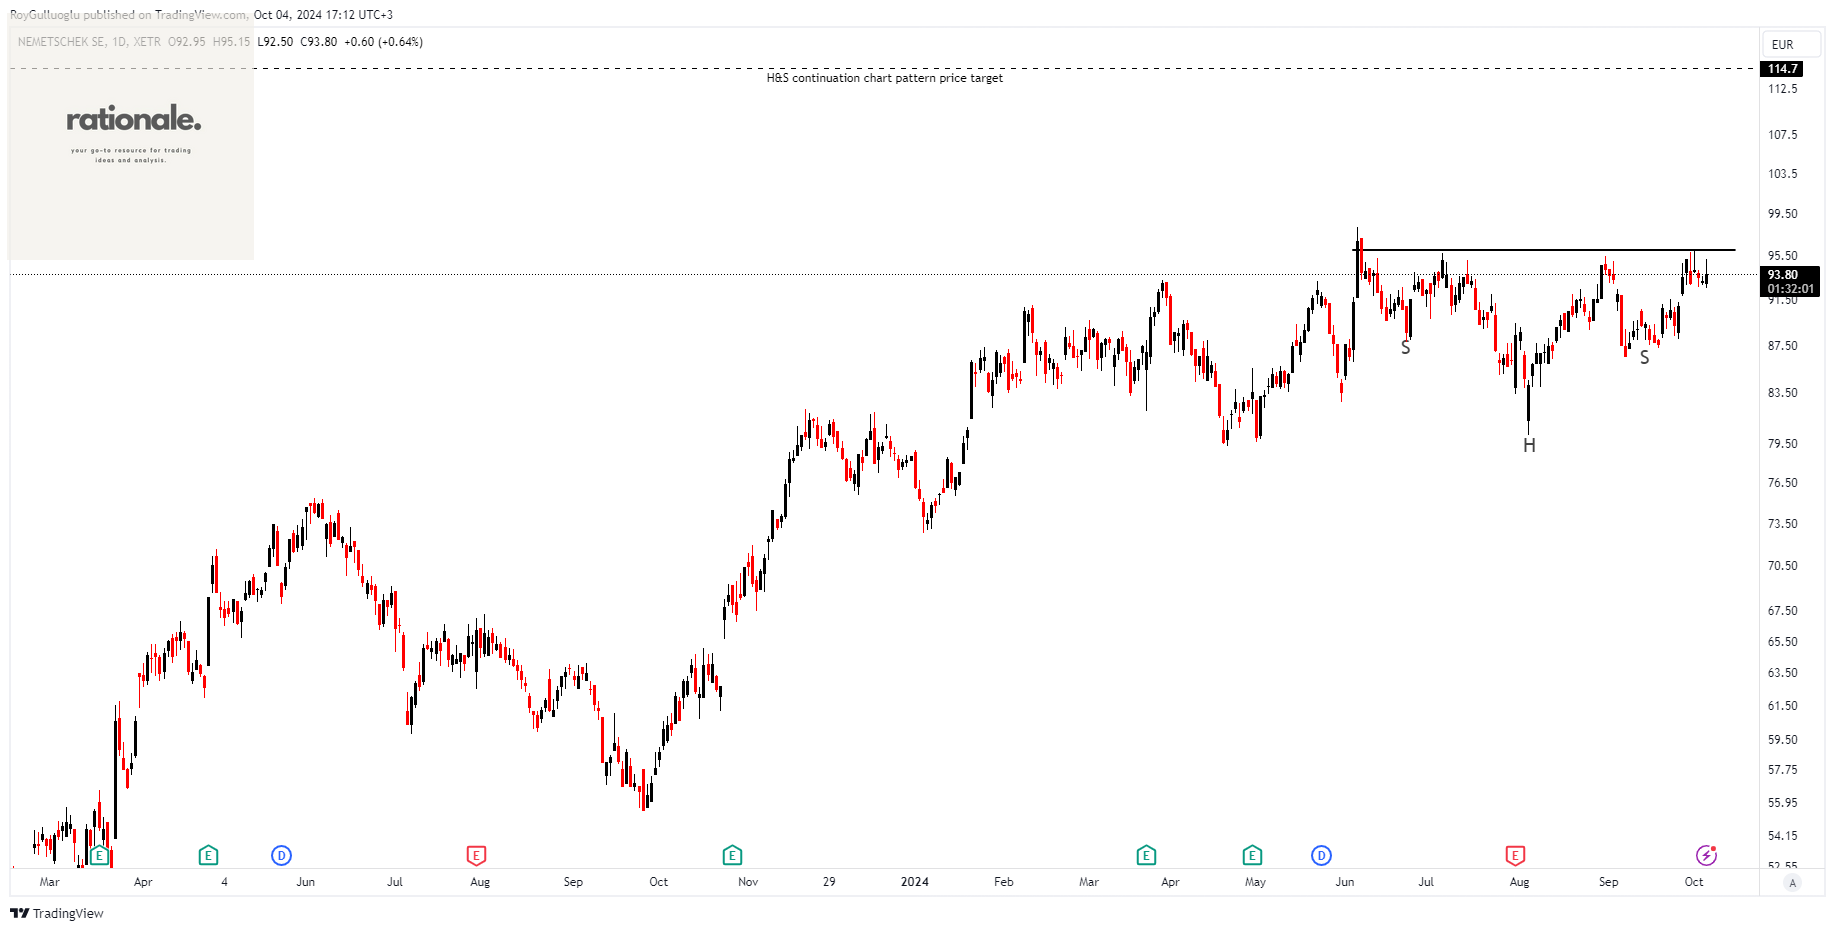
Nemetschek SE provides software solutions for architecture, engineering, construction, media, and entertainment markets in Germany, rest of Europe, the Americas, the Asia Pacific, and internationally.
The above daily chart formed an approximately 3-month-long H&S continuation chart pattern as a bullish continuation after an uptrend.
The horizontal boundary at 96 levels acts as a support within this pattern.
A daily close below 98.88 levels would validate the breakout from the 3-month-long H&S continuation chart pattern.
Based on this chart pattern, the potential price target is 114.7 levels.
NEM, classified under the "technology" sector, falls under the “Large Cap - Growth” stock category.
Alstom SA-(ALO/EURONEXT)-Long Idea
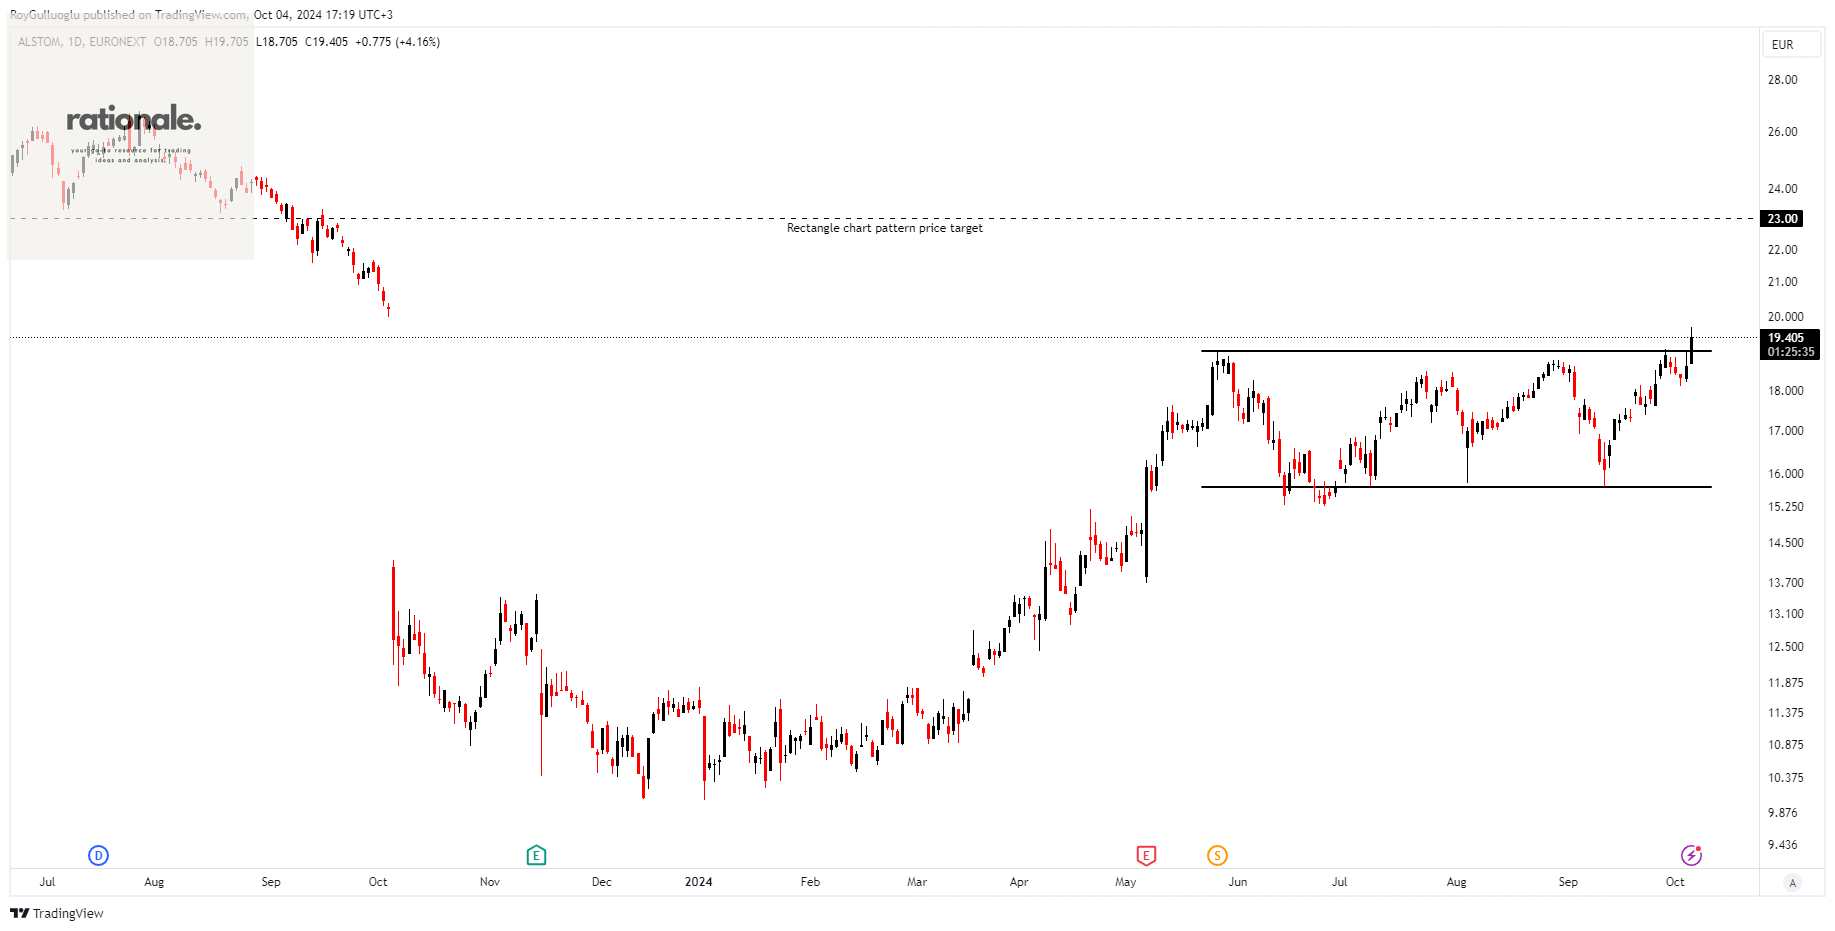
Alstom SA provides solutions for the rail transport industry in Europe, the Americas, Asia and the Pacific, the Middle East, Central Asia, and Africa.
The above daily chart formed an approximately 3-month-long rectangle chart pattern as a bullish continuation after an uptrend.
The horizontal boundary at 19 levels acts as a resistance within this pattern.
A daily close above 19.57 levels would validate the breakout from the 3-month-long rectangle chart pattern.
Based on this chart pattern, the potential price target is 23 levels.
ALO, classified under the "industrials" sector, falls under the “Mid Cap - Value” stock category.
ROY , thank you so much for shared charts, ,your every charts are very good setups.