


HealthEquity, Inc.-(HQY/NASDAQ)-Long Idea
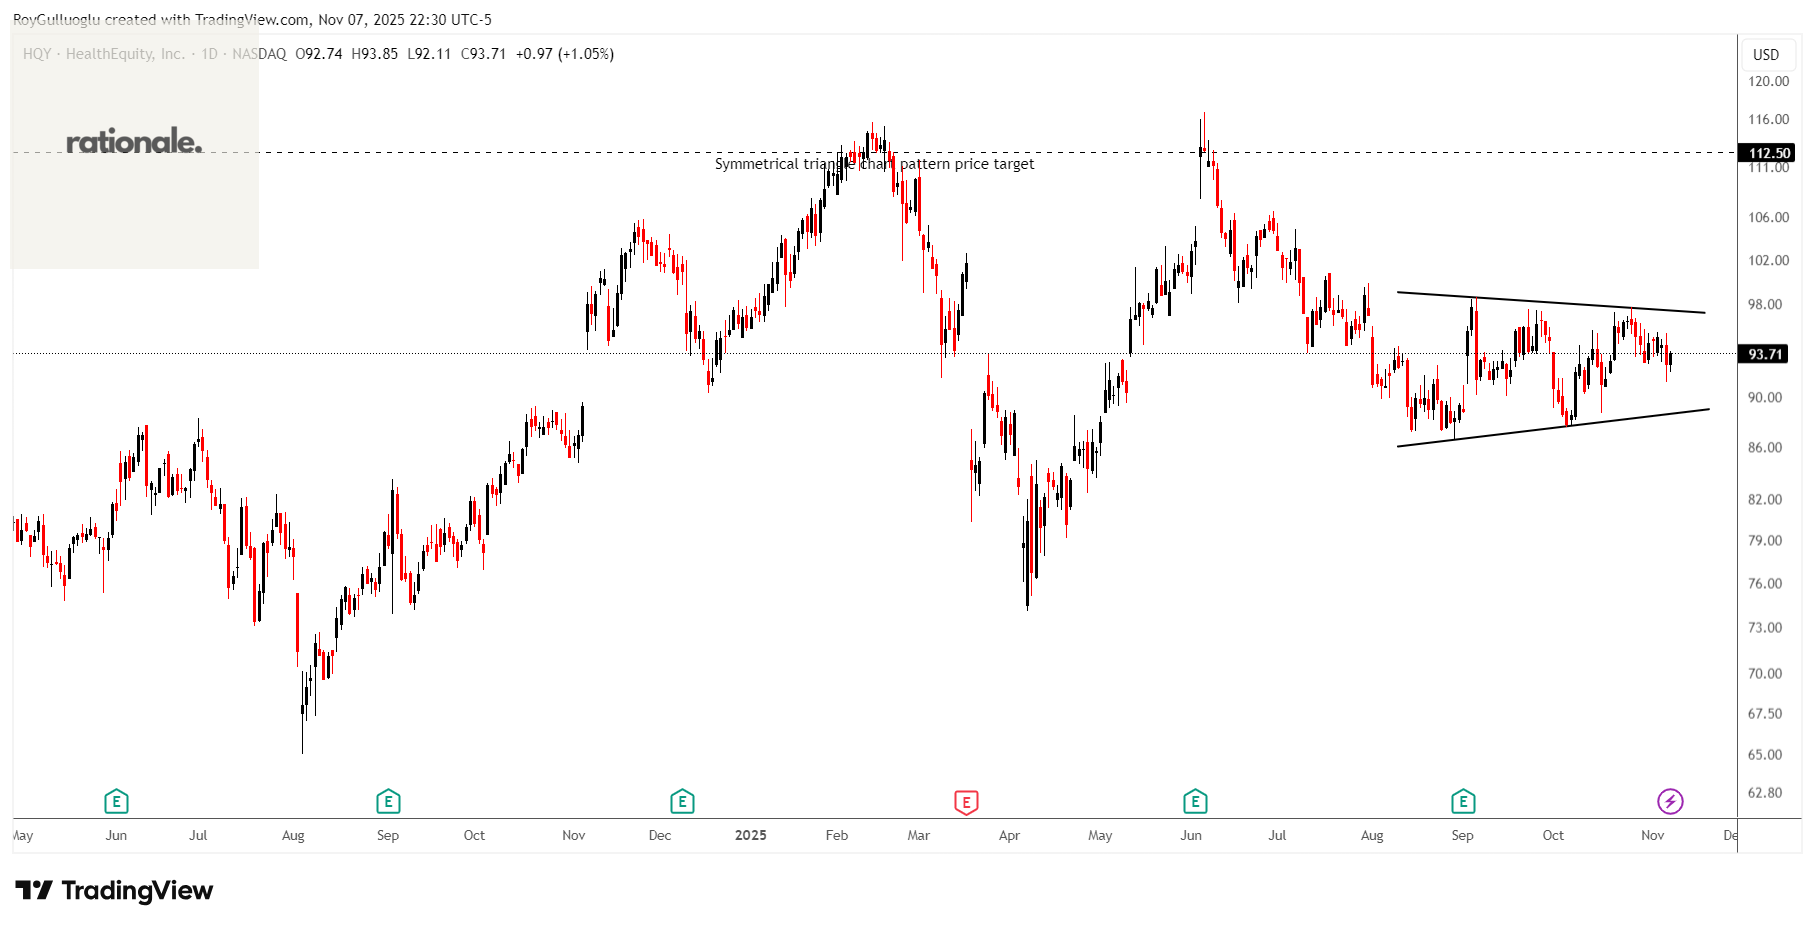
HealthEquity, Inc. provides technology-enabled services platforms to consumers and employers in the United States.
The above daily chart formed an approximately 2-month-long symmetrical triangle chart pattern as a bullish reversal after a downtrend.
A daily close above 100.5 levels would validate the breakout from the 2-month-long cup & handle chart pattern.
Based on this chart pattern, the potential price target is 112.5 levels.
Rollins, Inc-(ROL/NYSE)-Long Idea
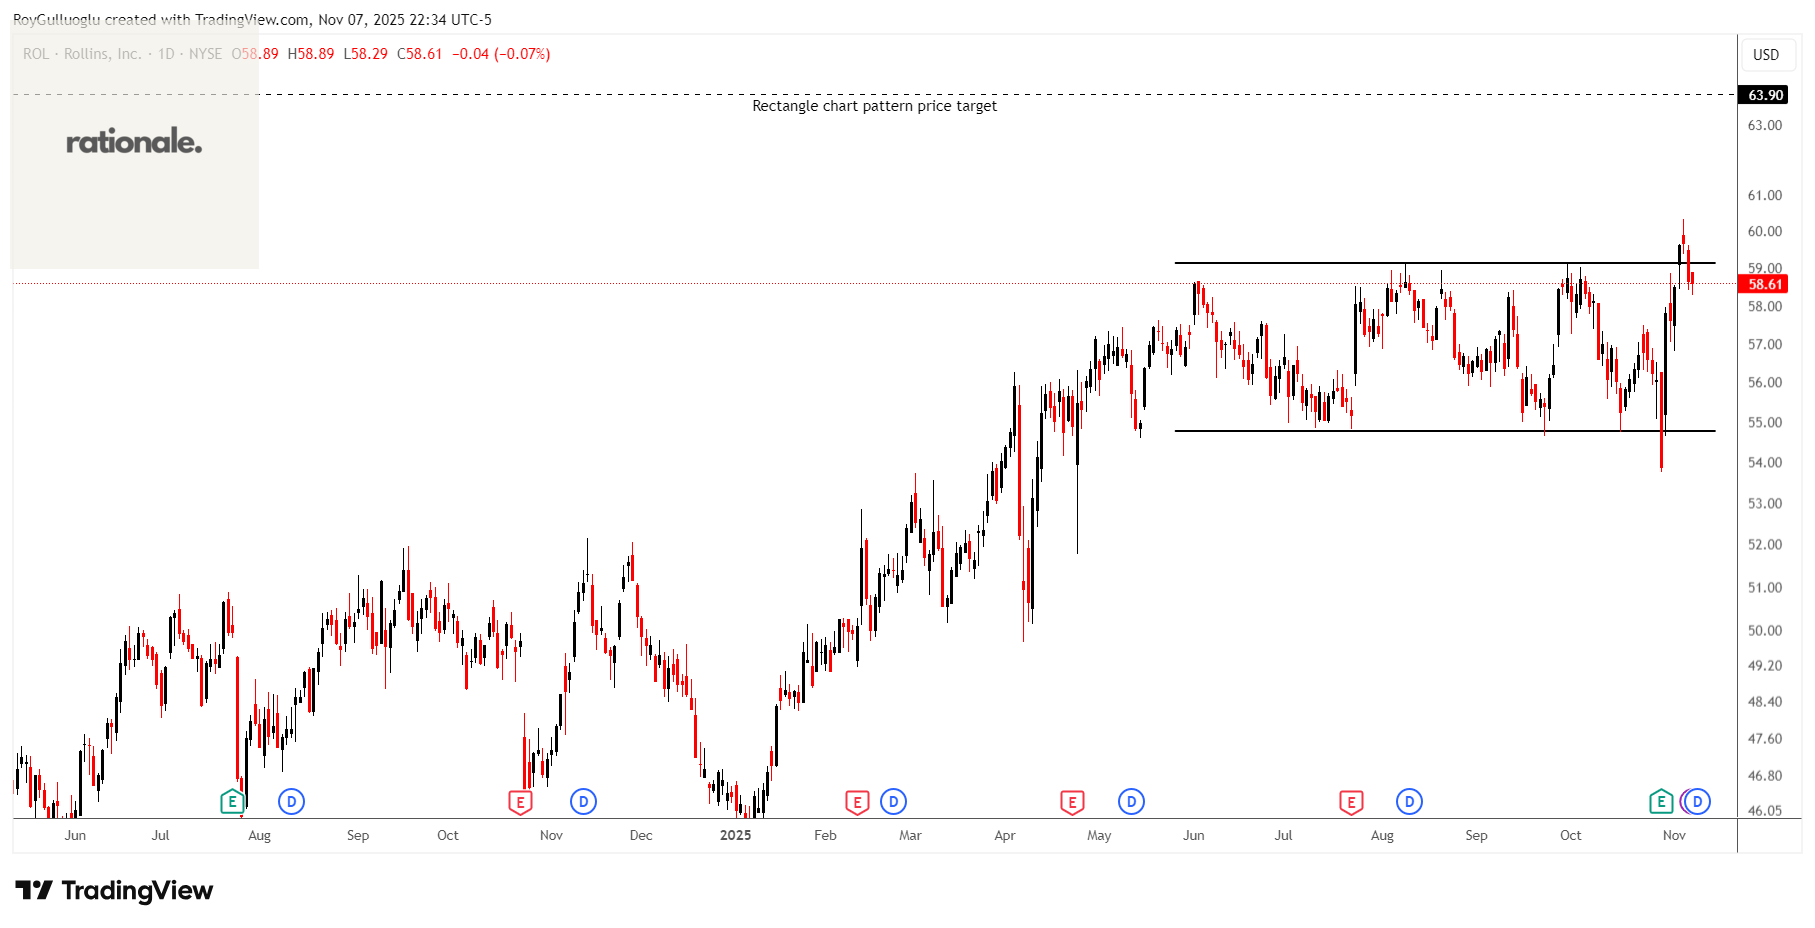
Rollins, Inc., through its subsidiaries, provides pest and wildlife control services to residential and commercial customers in the United States and internationally.
The above daily chart formed an approximately 4-month-long rectangle chart pattern as a bullish continuation after an uptrend.
Within this pattern, the horizontal boundary at 59.14 levels acts as a resistance.
A daily close above 60.91 levels would validate the breakout from the 4-month-long rectangle chart pattern.
Based on this chart pattern, the potential price target is 63.9 levels.
Salesforce, Inc.-(CRM/NYSE)-Short Idea
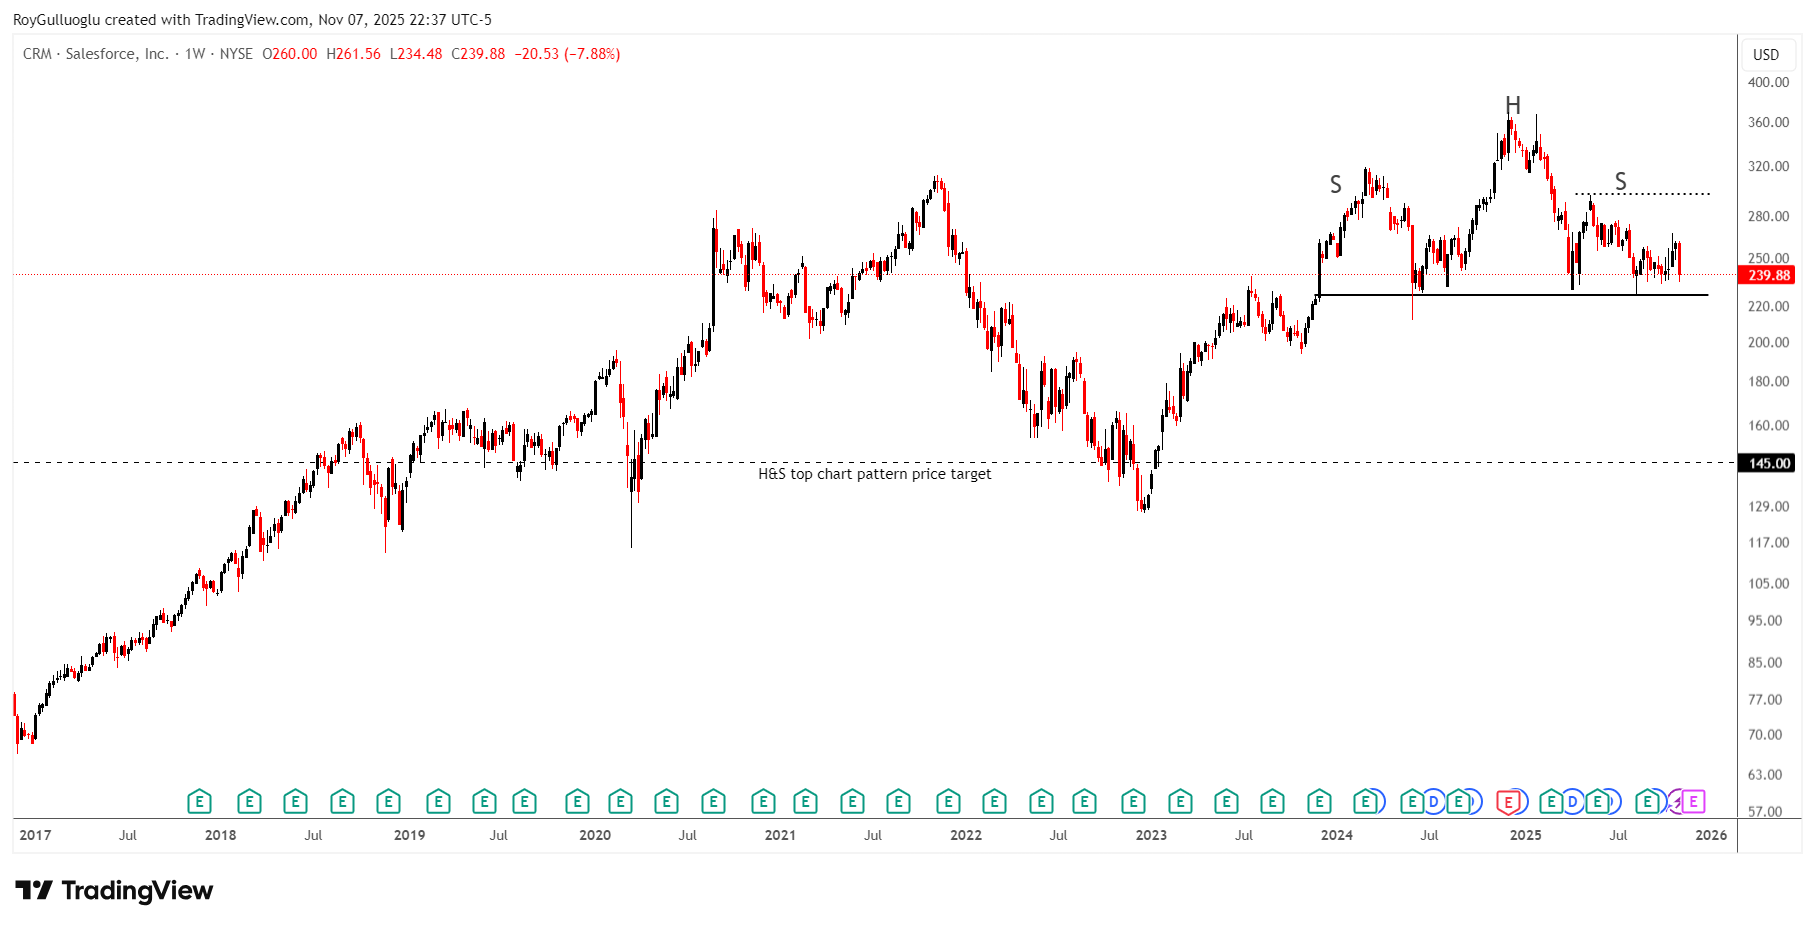
Salesforce, Inc. provides customer relationship management (CRM) technology that connects companies and customers together worldwide.
The above weekly chart formed an approximately 25-months-long H&S top chart pattern as a bearish reversal after an uptrend.
The boundary at 226.48 levels acts as a resistance within this pattern.
A daily close below 219.7 levels would validate the breakout from the 25-months-long H&S top chart pattern.
Based on this chart pattern, the potential price target is 145 levels.
Hims & Hers Health, Inc.-(HIMS/NYSE)-Short Idea
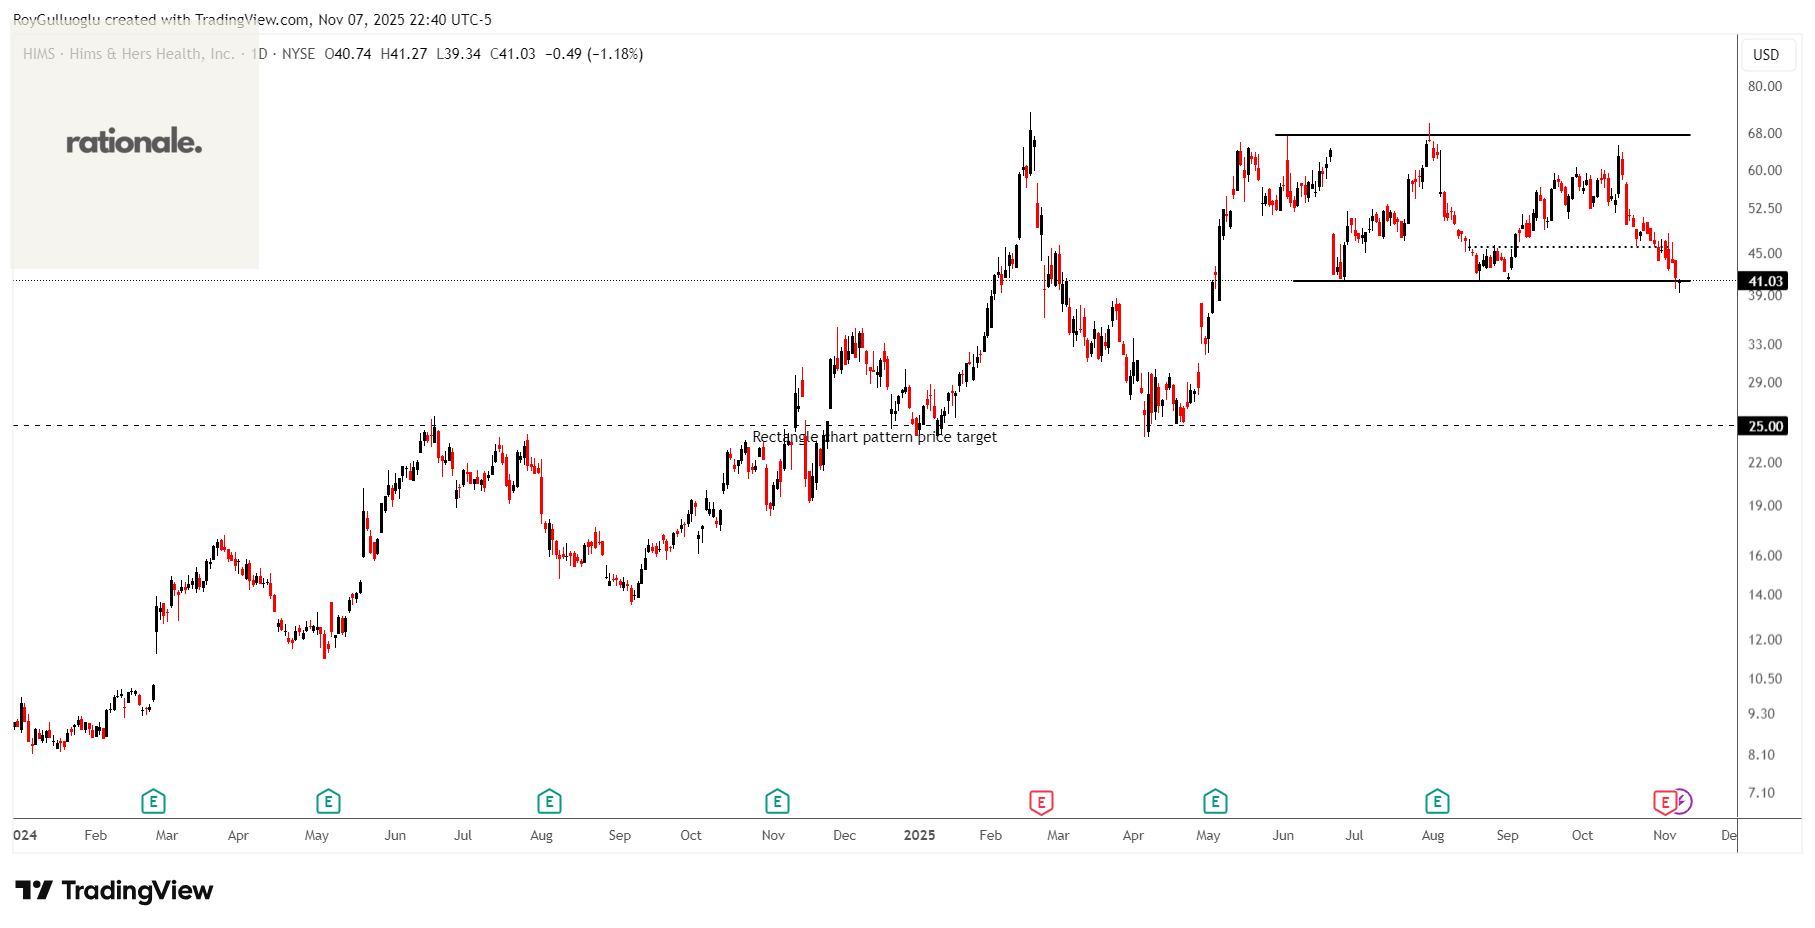
Hims & Hers Health, Inc. operates a telehealth platform that connects consumers to licensed healthcare professionals in the United States, the United Kingdom, and internationally.
The above daily chart formed an approximately 4-month-long rectangle chart pattern as a bearish reversal after an uptrend.
The horizontal boundary at 40.96 levels acts as a resistance within this pattern.
A daily close below 39.75 levels would validate the breakout from the 4-month-long rectangle chart pattern.
Based on this chart pattern, the potential price target is 25 levels.
SAP SE-(SAP/XETR)-Short Idea
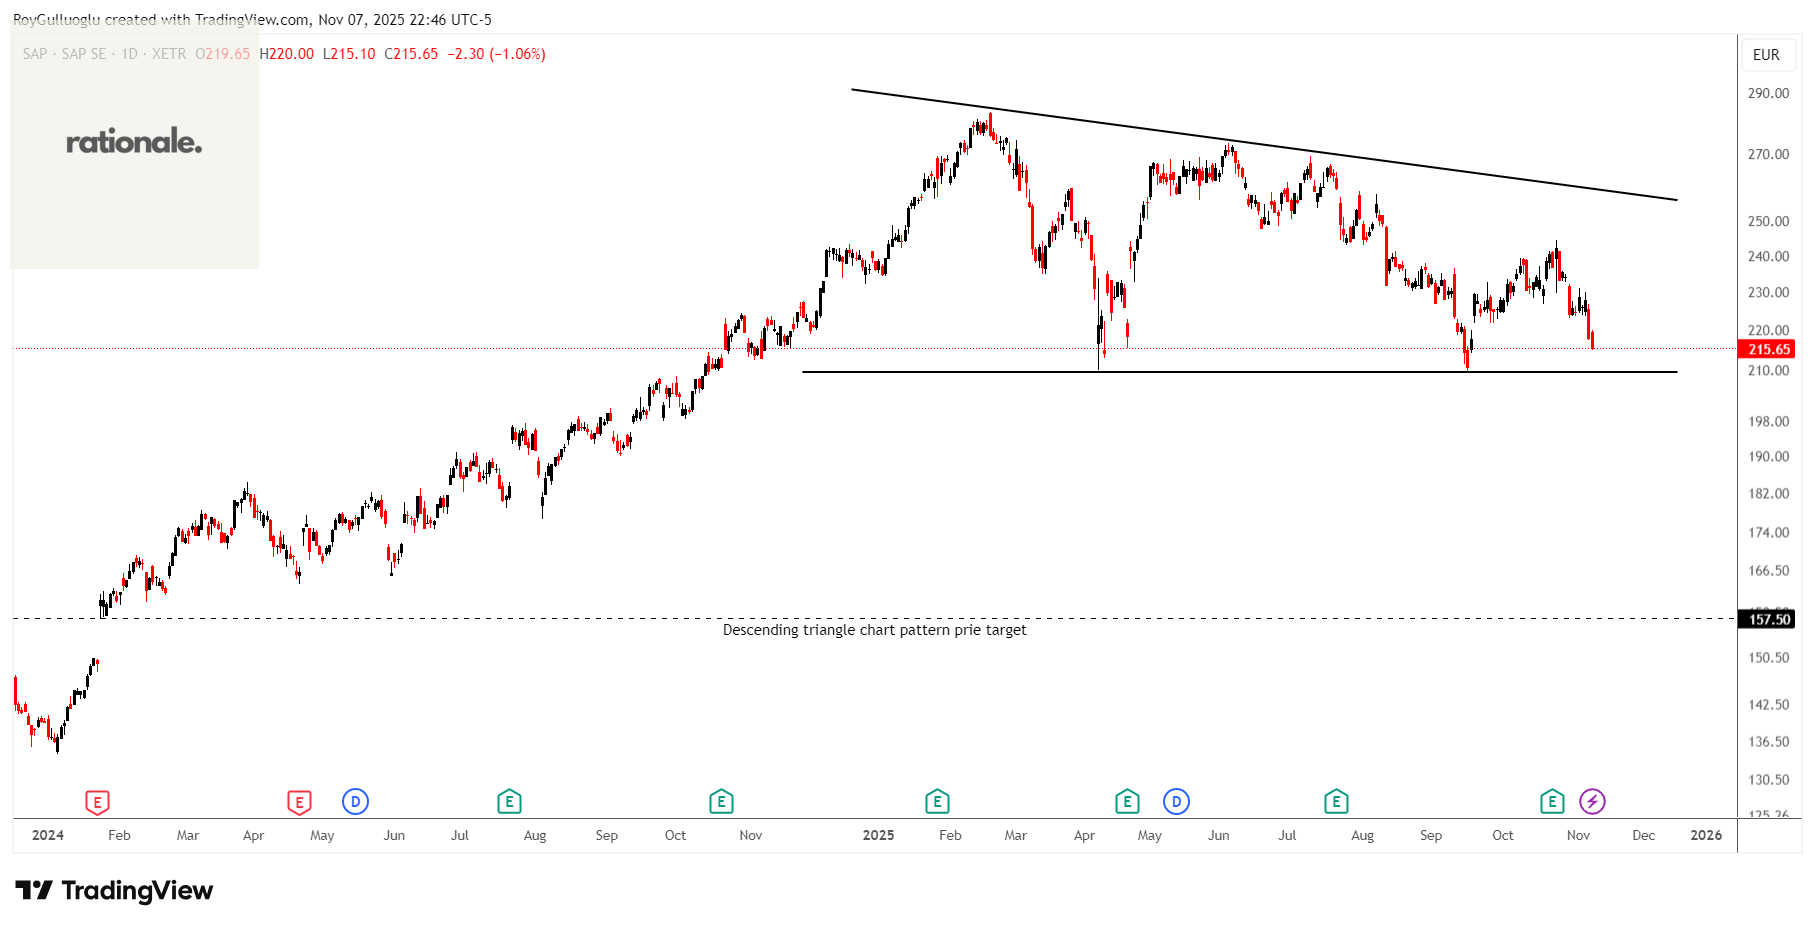
SAP SE, together with its subsidiaries, provides enterprise application and business solutions worldwide.
The above daily chart formed an approximately 6-month-long descending triangle chart pattern as a bearish reversal after an uptrend.
The horizontal boundary at 209.7 levels acts as a resistance within this pattern.
A daily close below 203.41 levels would validate the breakout from the 6-month-long descending triangle chart pattern.
Based on this chart pattern, the potential price target is 157.5 levels.