

Trade Ideas Equities
PATH(NYSE), GPI(NYSE), CRWD(NASDAQ), GIL(TSX), 3498(TSE), 5301(TSE), AMBU(OMXCOP)

UiPath Inc.-(PATH/NYSE)-Long Idea
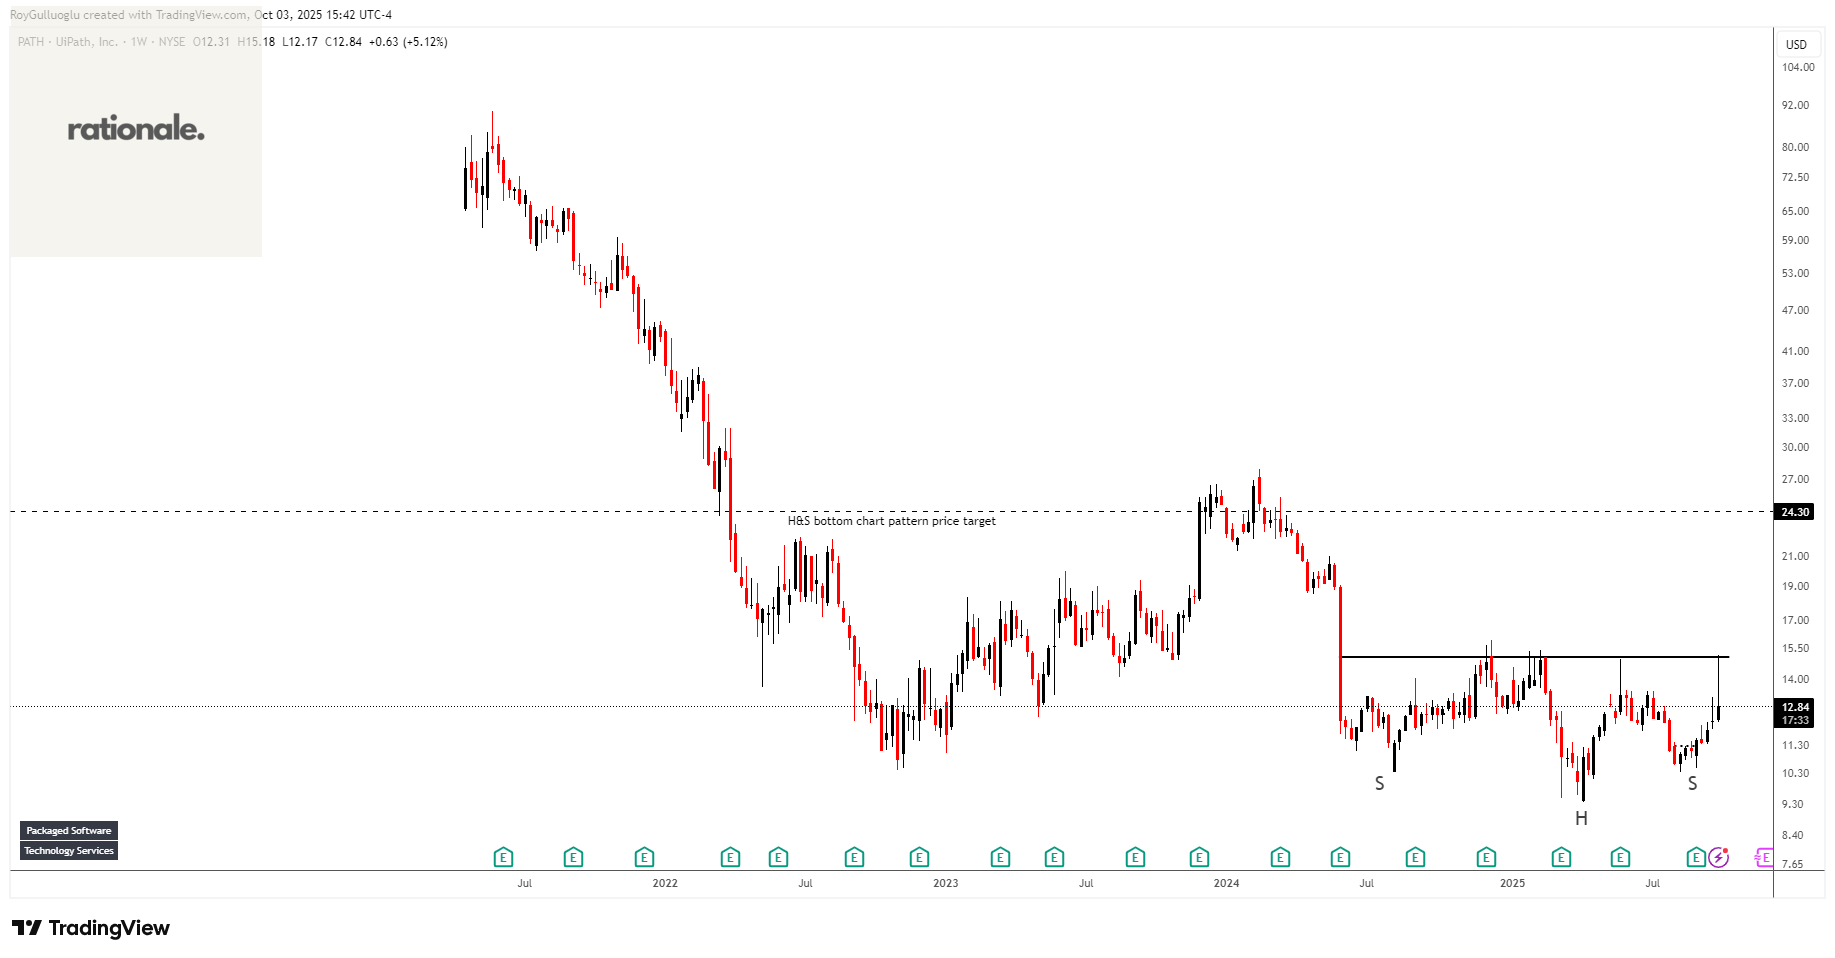
UiPath Inc. provides an end-to-end automation platform that offers a range of robotic process automation (RPA) solutions primarily in the United States, Romania, the United Kingdom, the Netherlands, and internationally.
The above weekly chart formed an approximately 17-month-long H&S bottom chart pattern as a bullish reversal after a downtrend.
The horizontal boundary at 15.04 levels acts as a resistance within this pattern.
A daily close above 15.49 levels would validate the breakout from the 17-month-long H&S bottom chart pattern.
Based on this chart pattern, the potential price target is 24.3 levels.
PATH, classified under the “technology” sector, falls under the “Mid Cap - Growth” stock category.
Group 1 Automotive, Inc.-(GPI/NYSE)-Long Idea
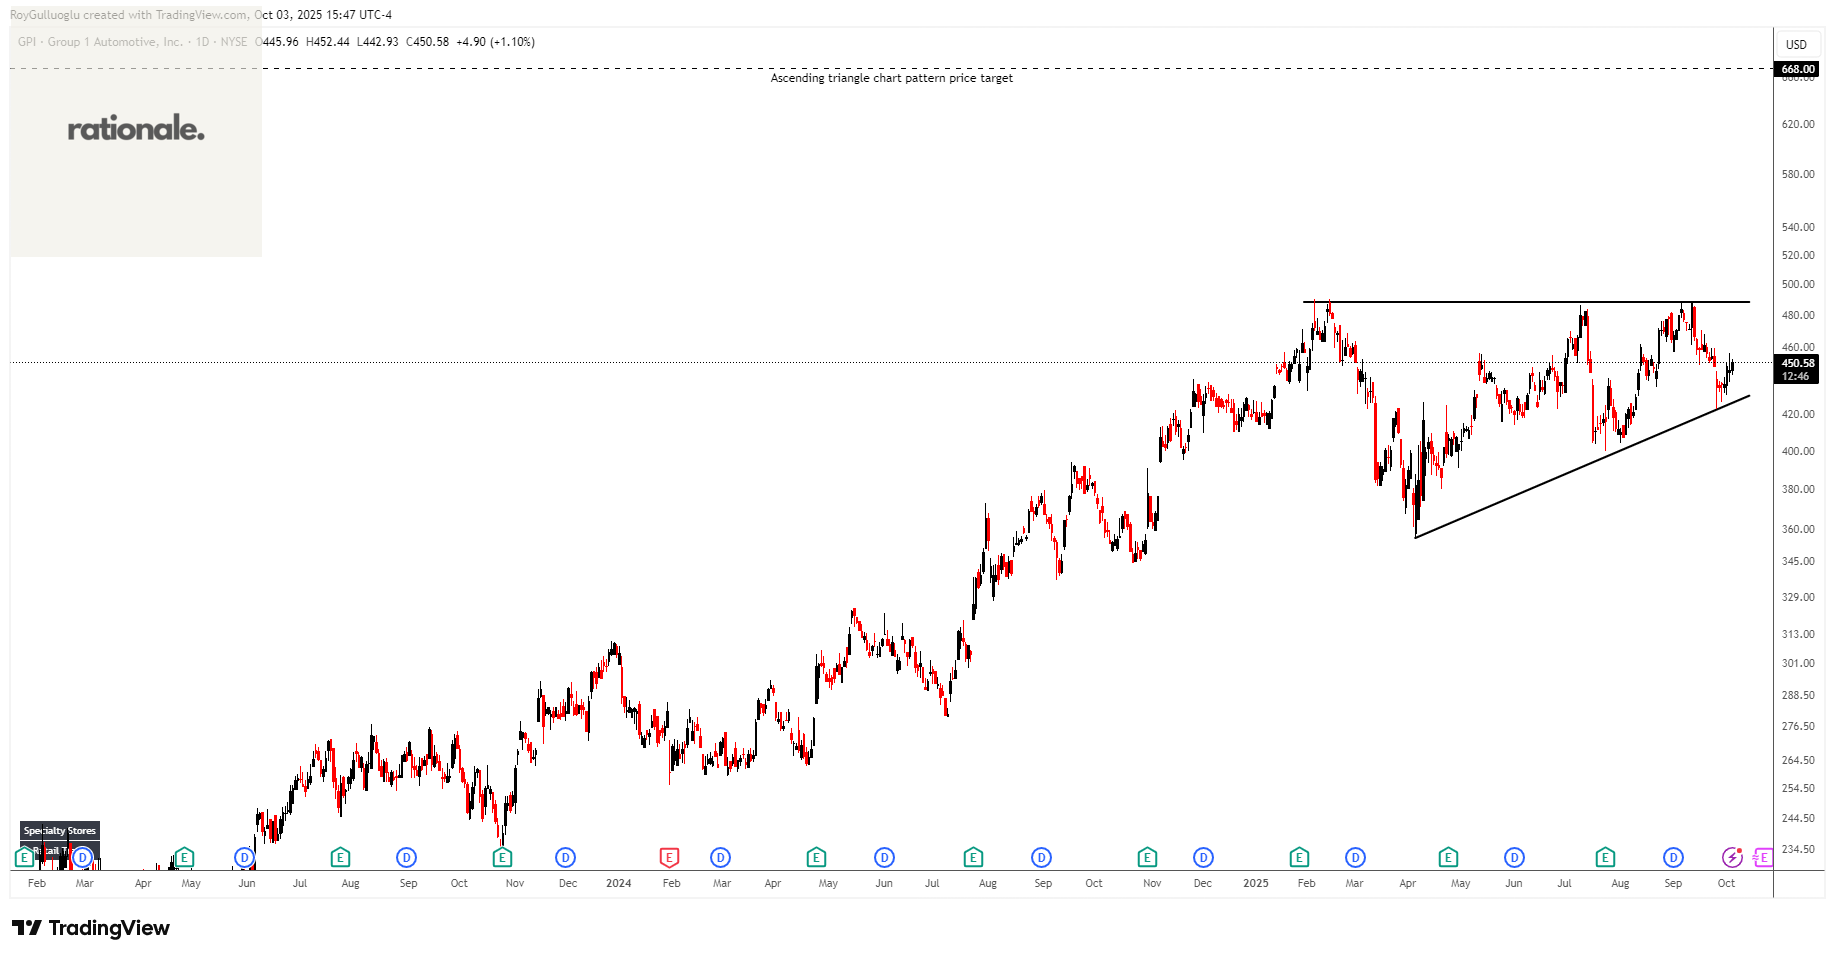
Group 1 Automotive, Inc., through its subsidiaries, operates in the automotive retail industry in the United States and the United Kingdom.
The above daily chart formed an approximately 5-month-long ascending triangle chart pattern as a bullish continuation after an uptrend.
The horizontal boundary at 488.25 levels acts as a resistance within this pattern.
A daily close above 502.9 levels would validate the breakout from the 5-month-long ascending triangle chart pattern.
Based on this chart pattern, the potential price target is 668 levels.
GPI, classified under the “consumer cyclicals” sector, falls under the “Mid Cap - Growth” stock category.
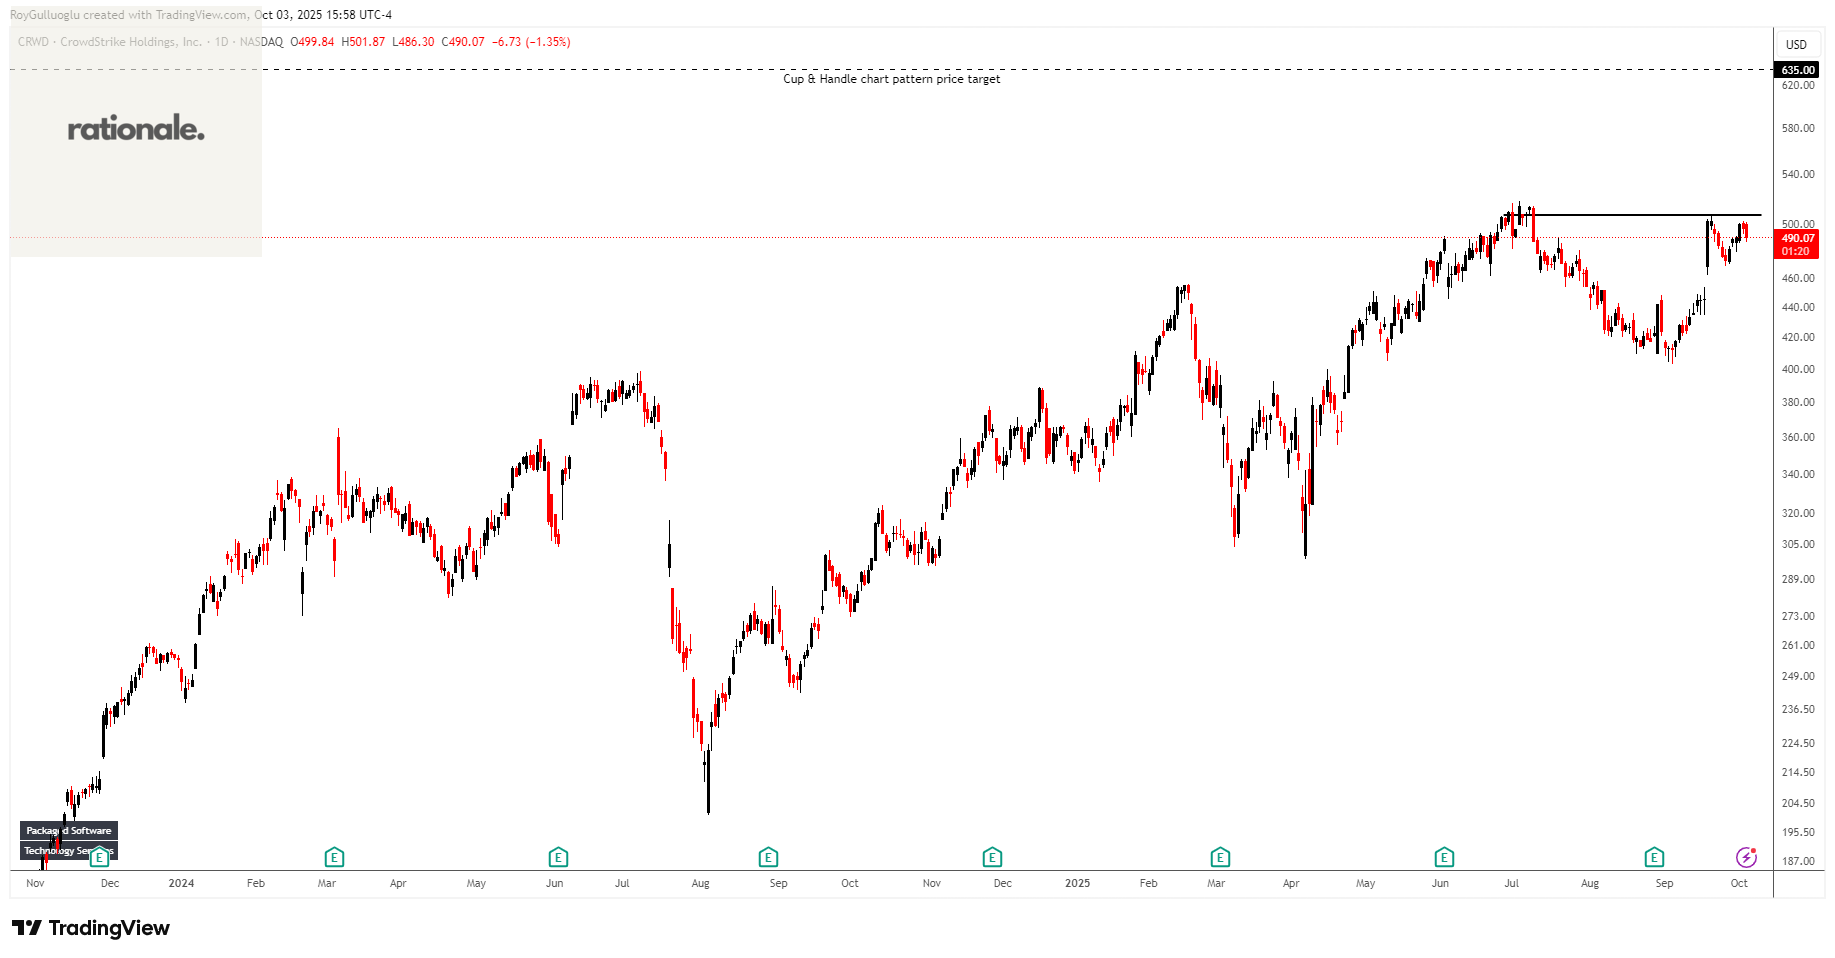
CrowdStrike Holdings, Inc.-(CRWD/NASDAQ)-Long Idea
Globalstar, Inc. provides mobile satellite services in the United States, Canada, Europe, Central and South America, and internationally.
The above daily chart formed an approximately 2-month-long cup & handle chart pattern as a bullish continuation after an uptrend.
The horizontal boundary at 507.2 levels acts as a resistance within this pattern.
A daily close above 522.4 levels would validate the breakout from the 2-month-long cup & handle chart pattern.
Based on this chart pattern, the potential price target is 635 levels.
CRWD, classified under the “technology” sector, falls under the “Large Cap - Growth” stock category.
Gildan Activewear Inc.-(GIL/TSX)-Long Idea
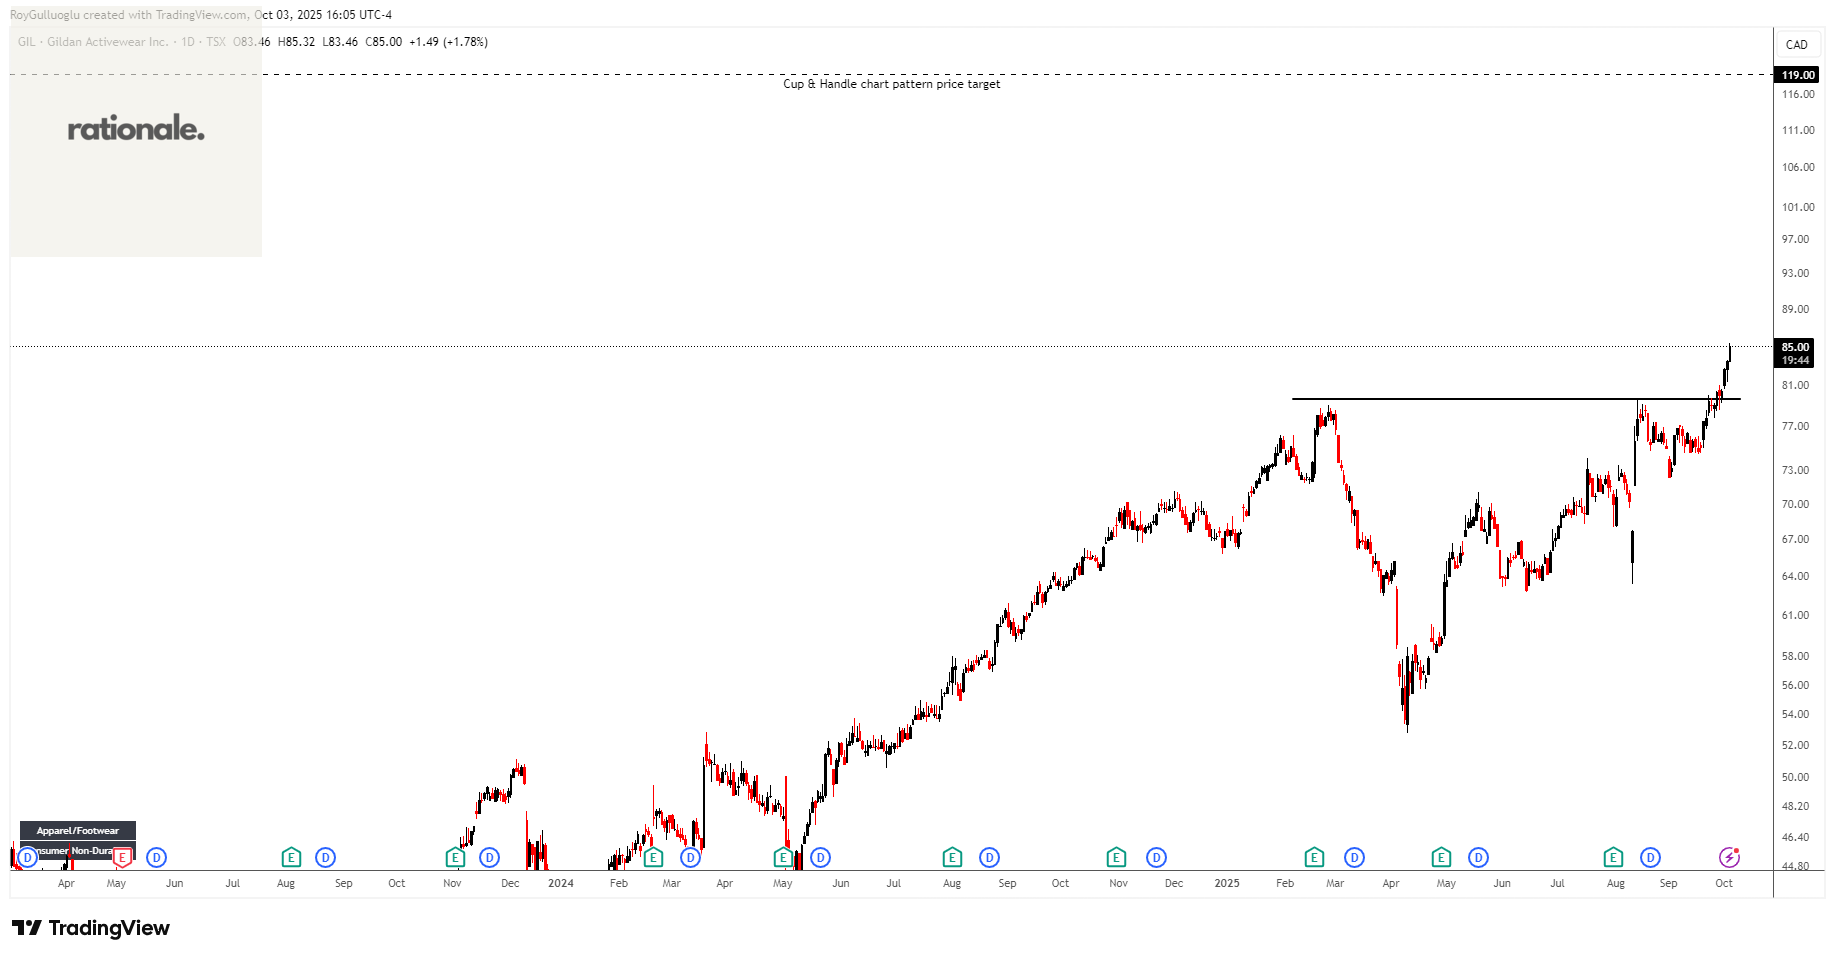
Gildan Activewear Inc. manufactures and sells various apparel products.
The above daily chart formed an approximately 2-month-long cup & handle chart pattern as a bullish continuation after an uptrend.
The horizontal boundary at 79.65 levels acted as a resistance within this pattern.
A daily close above 82 levels validated the breakout from the 2-month-long cup & handle chart pattern.
Based on this chart pattern, the potential price target is 119 levels.
GIL, classified under the “consumer cyclicals” sector, falls under the “Mid Cap - Growth” stock category.
Kasumigaseki Capital Co.,Ltd.-(3498/TSE)-Long Idea
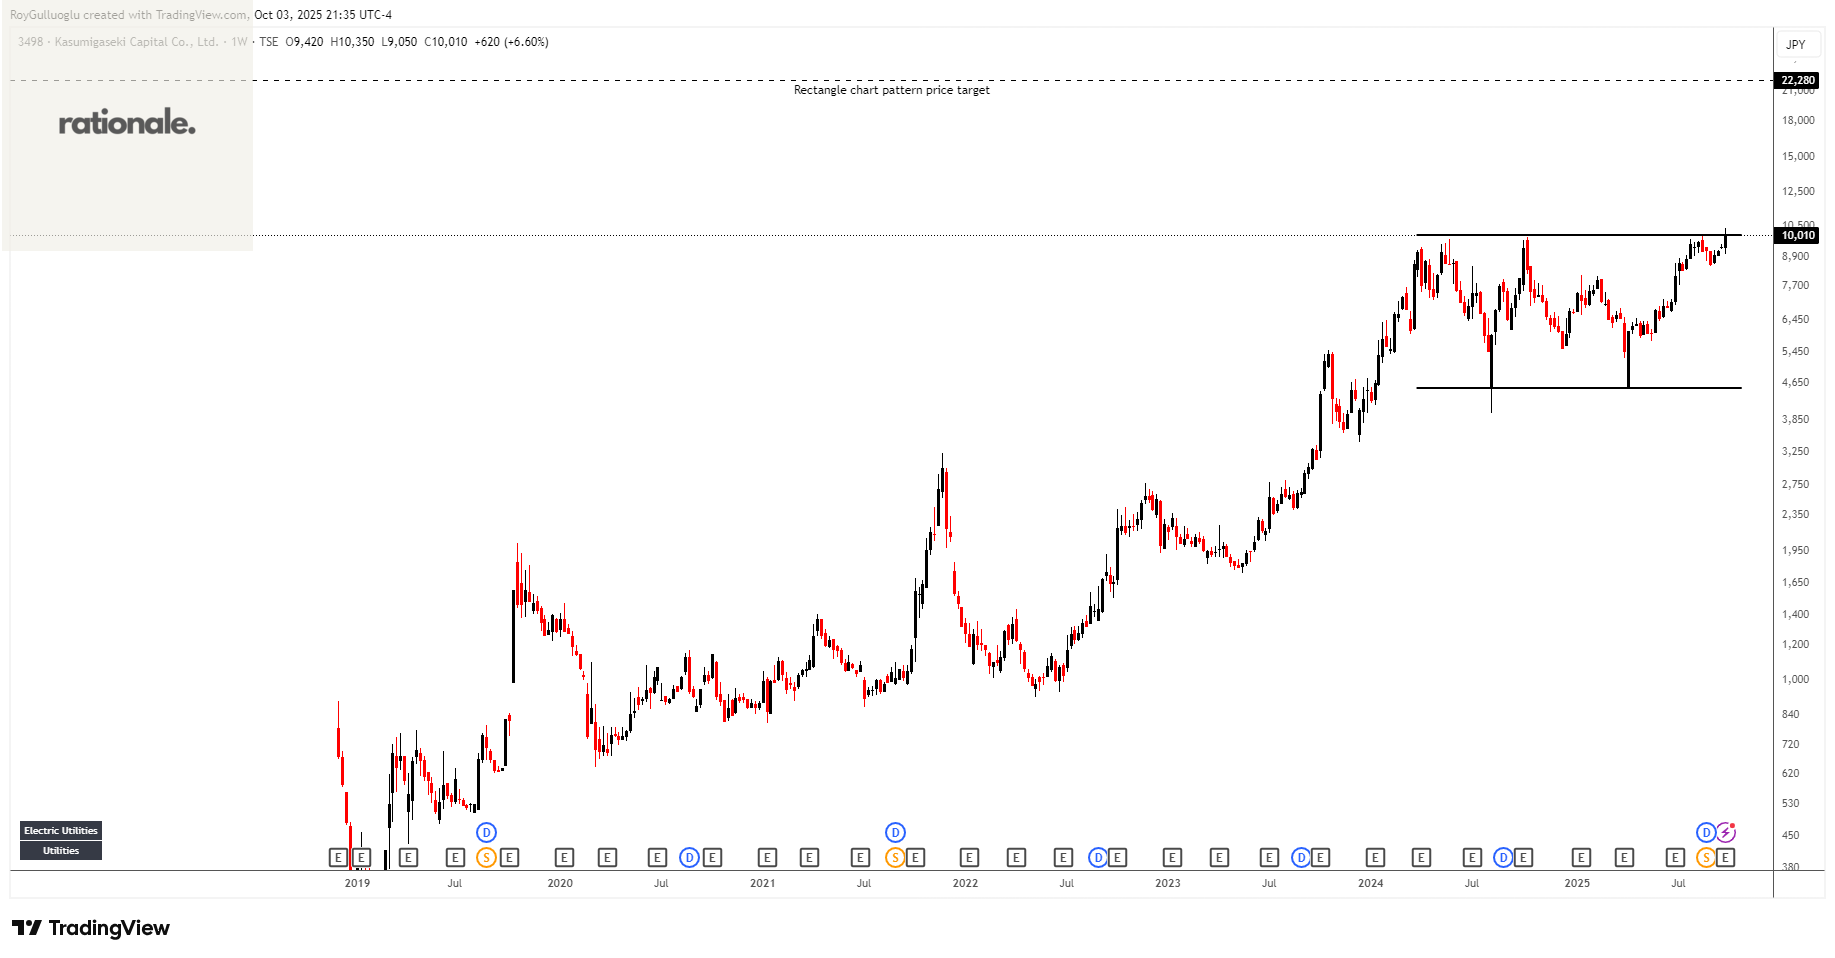
Kasumigaseki Capital Co.,Ltd. engages in real estate consulting businesses in Japan. The company develops and operates power generation business through natural energy sources, including solar, wind, and biomass power plants
The above weekly chart formed an approximately 20-month-long rectangle chart pattern as a bullish continuation after an uptrend.
The horizontal boundary at 9980 levels acts as a resistance within this pattern.
A daily close above 10280 levels would validate the breakout from the 20-month-long rectangle chart pattern.
Based on this chart pattern, the potential price target is 22280 levels.
3498, classified under the “industrials” sector, falls under the “Small Cap - Value” stock category.
Tokai Carbon Co., Ltd.-(5301/TSE)-Long Idea
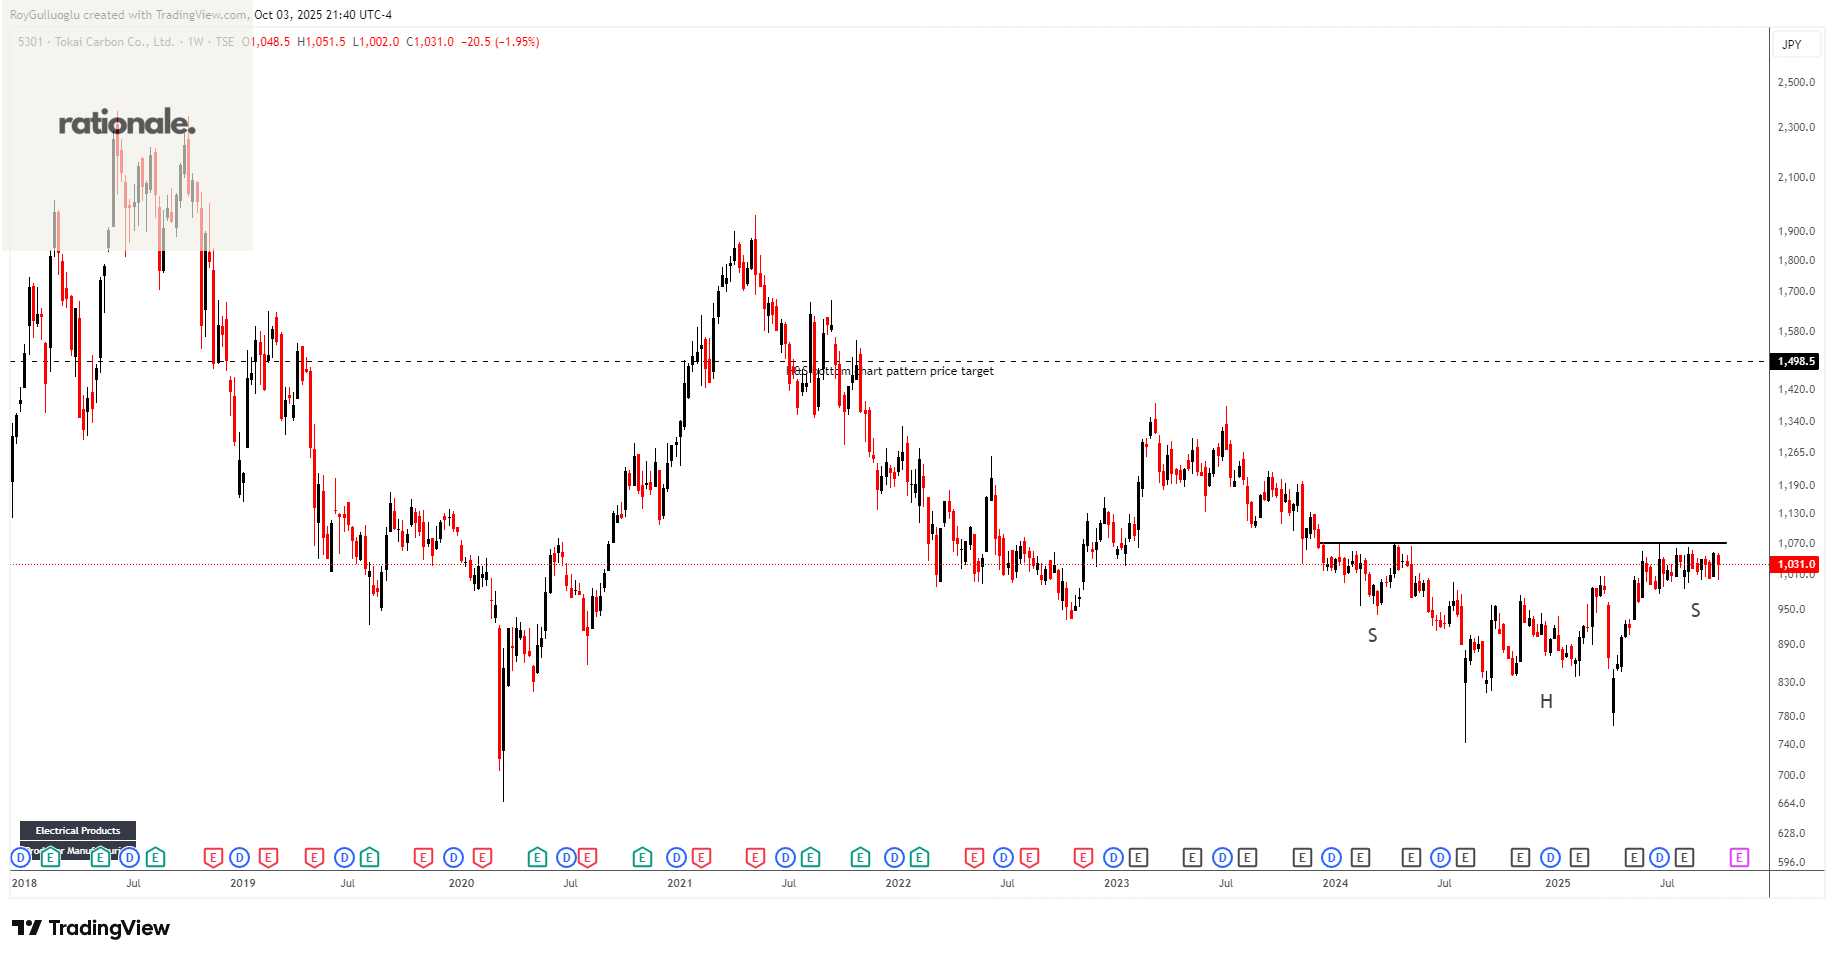
Tokai Carbon Co., Ltd. manufactures and sells carbon-related products and services in Japan.
The above weekly chart formed an approximately 22-month-long H&S bottom chart pattern as a bullish reversal after a downtrend.
The horizontal boundary at 1071 levels acts as a resistance within this pattern.
A daily close above 1103 levels would validate the breakout from the 22-month-long H&S bottom chart pattern.
Based on this chart pattern, the potential price target is 1498 levels.
5301, classified under the “basic materials” sector, falls under the “Small Cap - Value” stock category.
Ambu A/S-(AMBU/OMXCOP)-Long Idea
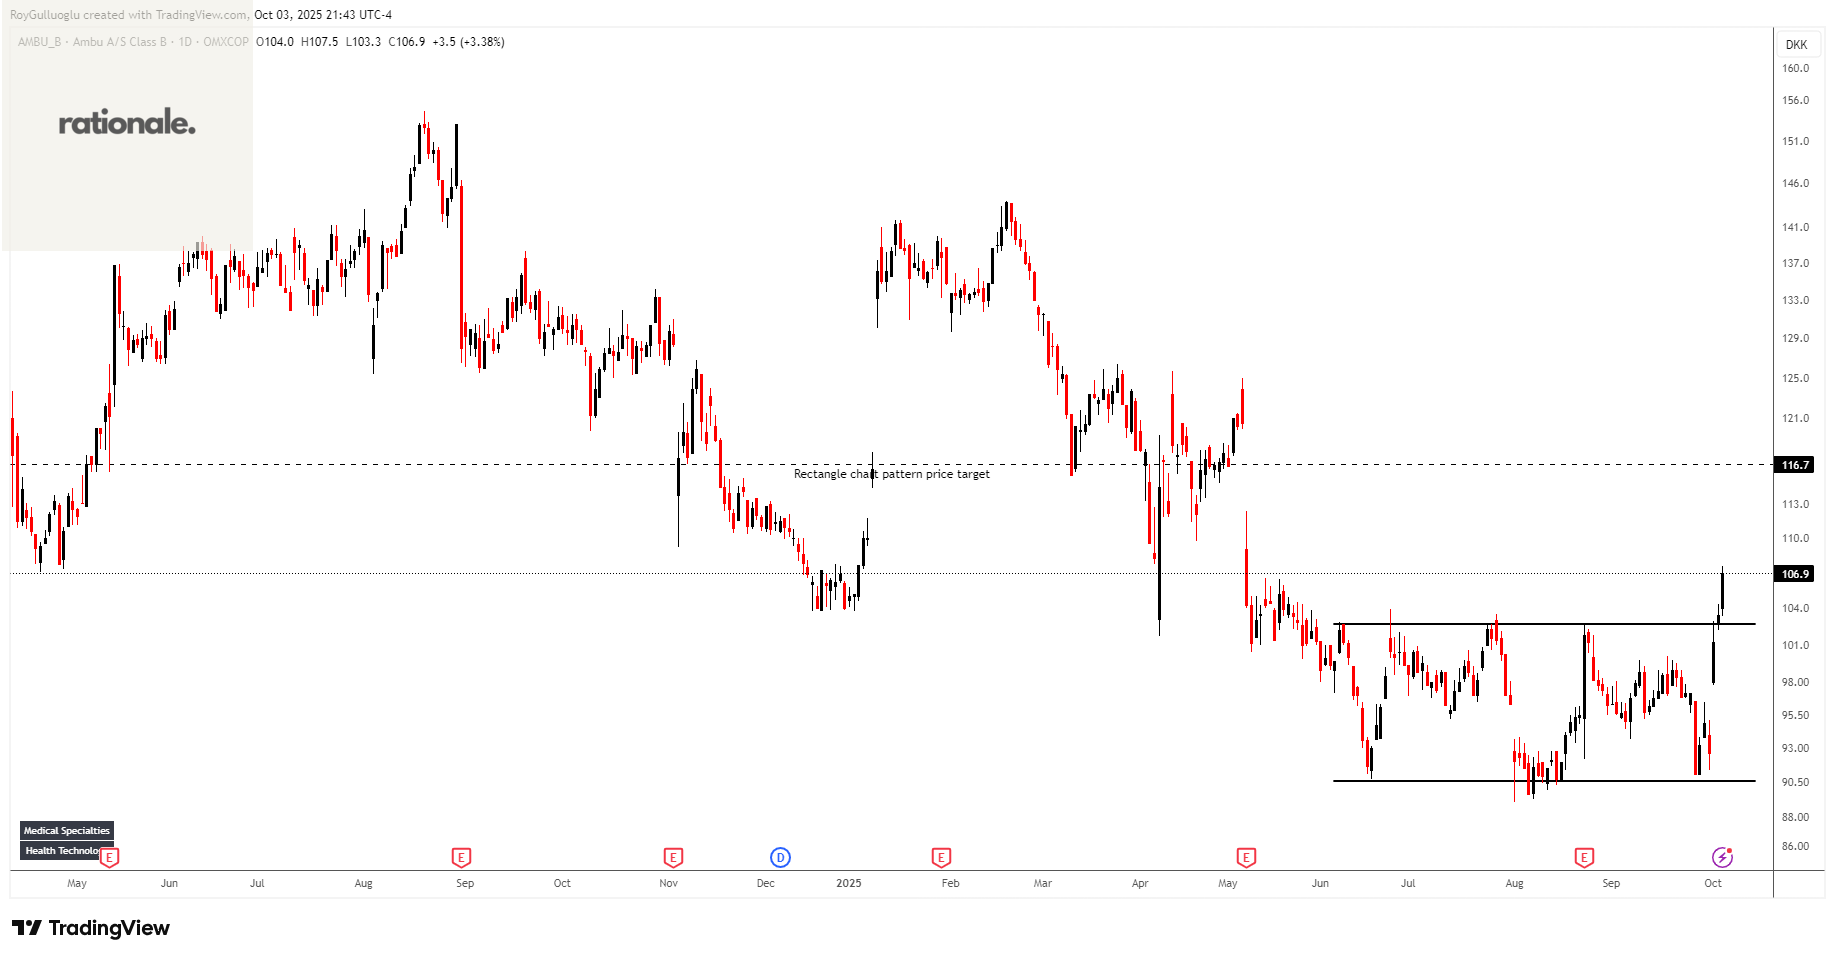
Ambu A/S, a medical technology company, develops, produces, and sells medical devices to hospitals, clinics, and rescue services worldwide.
The above daily chart formed an approximately 3-month-long rectangle chart pattern as a bullish reversal after a downtrend.
The horizontal boundary at 102.7 levels acted as a resistance within this pattern.
A daily close above 105.7 levels validated the breakout from the 3-month-long rectangle chart pattern.
Based on this chart pattern, the potential price target is 116.7 levels.
AMBU, classified under the “healthcare” sector, falls under the “Mid Cap - Value” stock category.
Teşekkürler Roy