


American Tower Corporation-(AMT/NYSE)-Short Idea
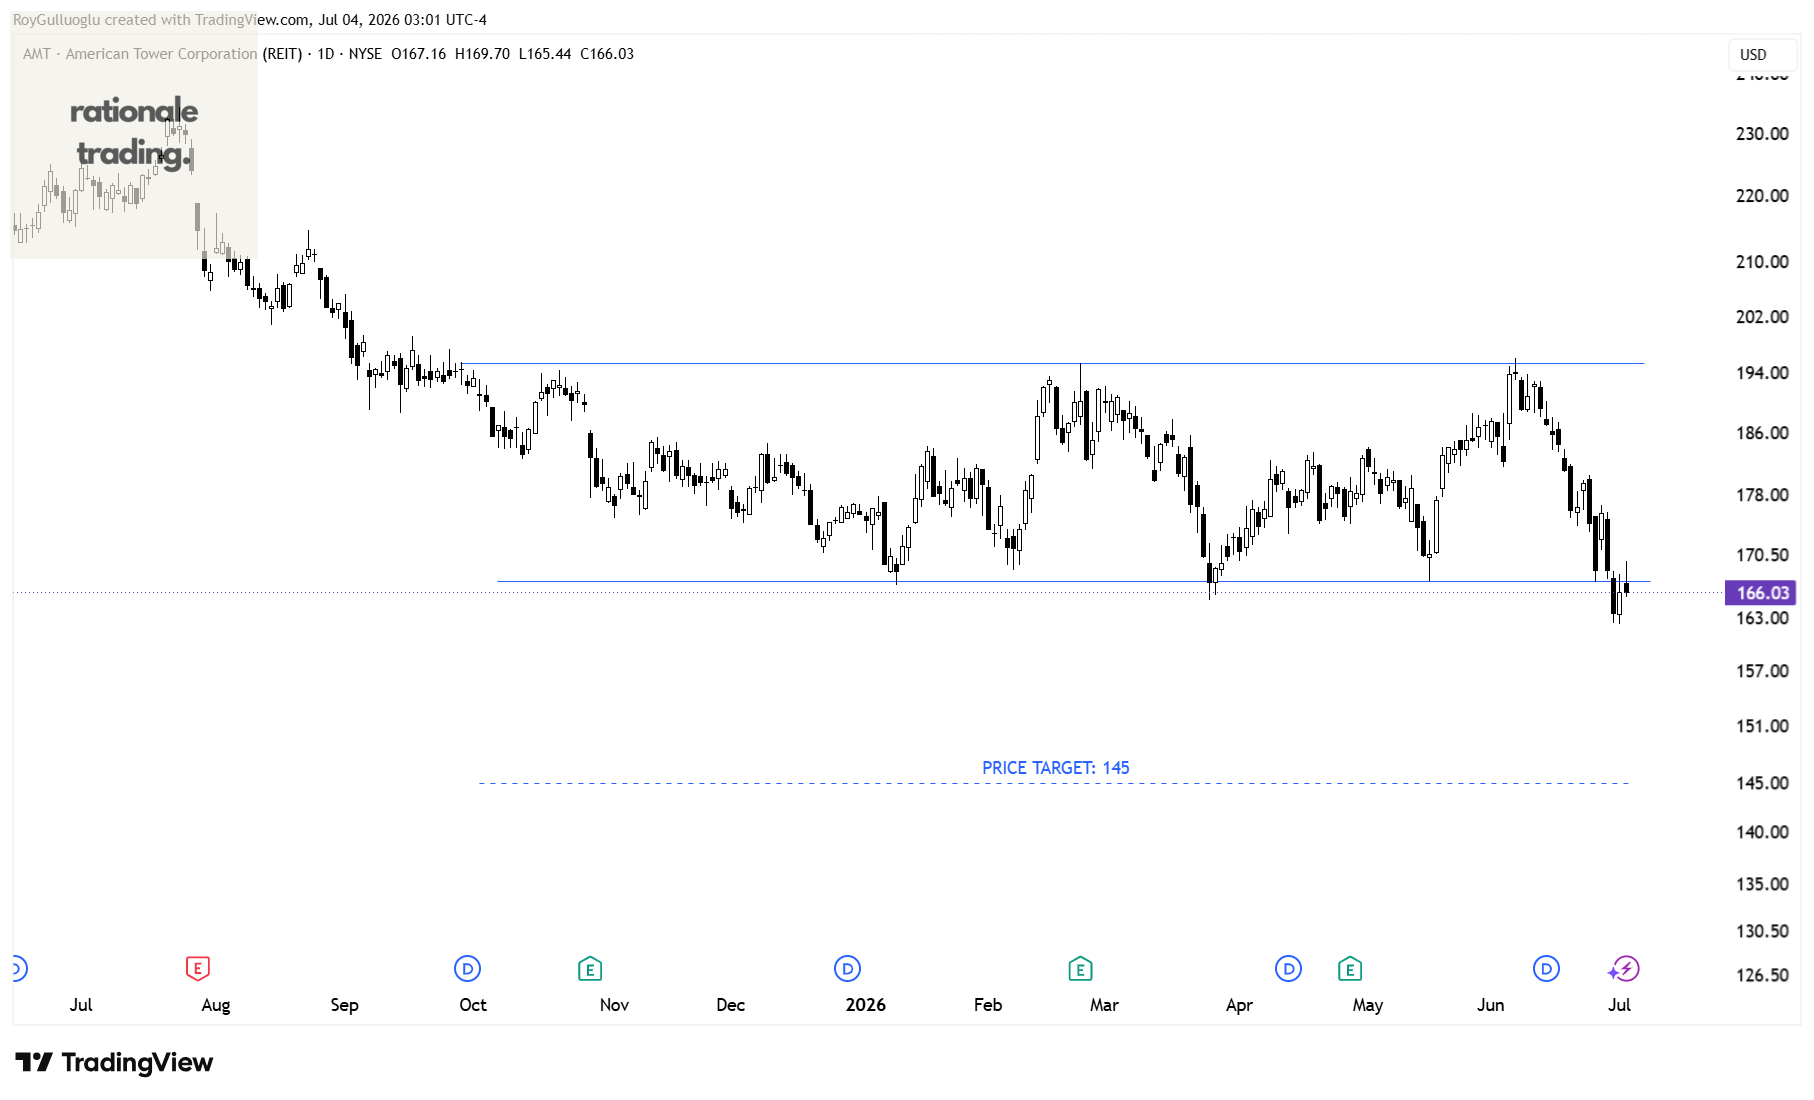
American Tower Corporation is one of the largest global real estate investment trusts. It is a leading independent owner, operator and developer of multitenant communications real estate.
The above daily chart formed an approximately 6-month-long rectangle chart pattern as a bearish continuation after a downtrend.
Within this pattern, the horizontal boundary at 167.3 levels acted as a support.
A daily close below 164.8 levels validated the breakdown from the 3-month-long rectangle chart pattern.
Based on this chart pattern, the potential price target is 145 levels.
Advanced Drainage Systems, Inc.-(WMS/NYSE)-Long Idea
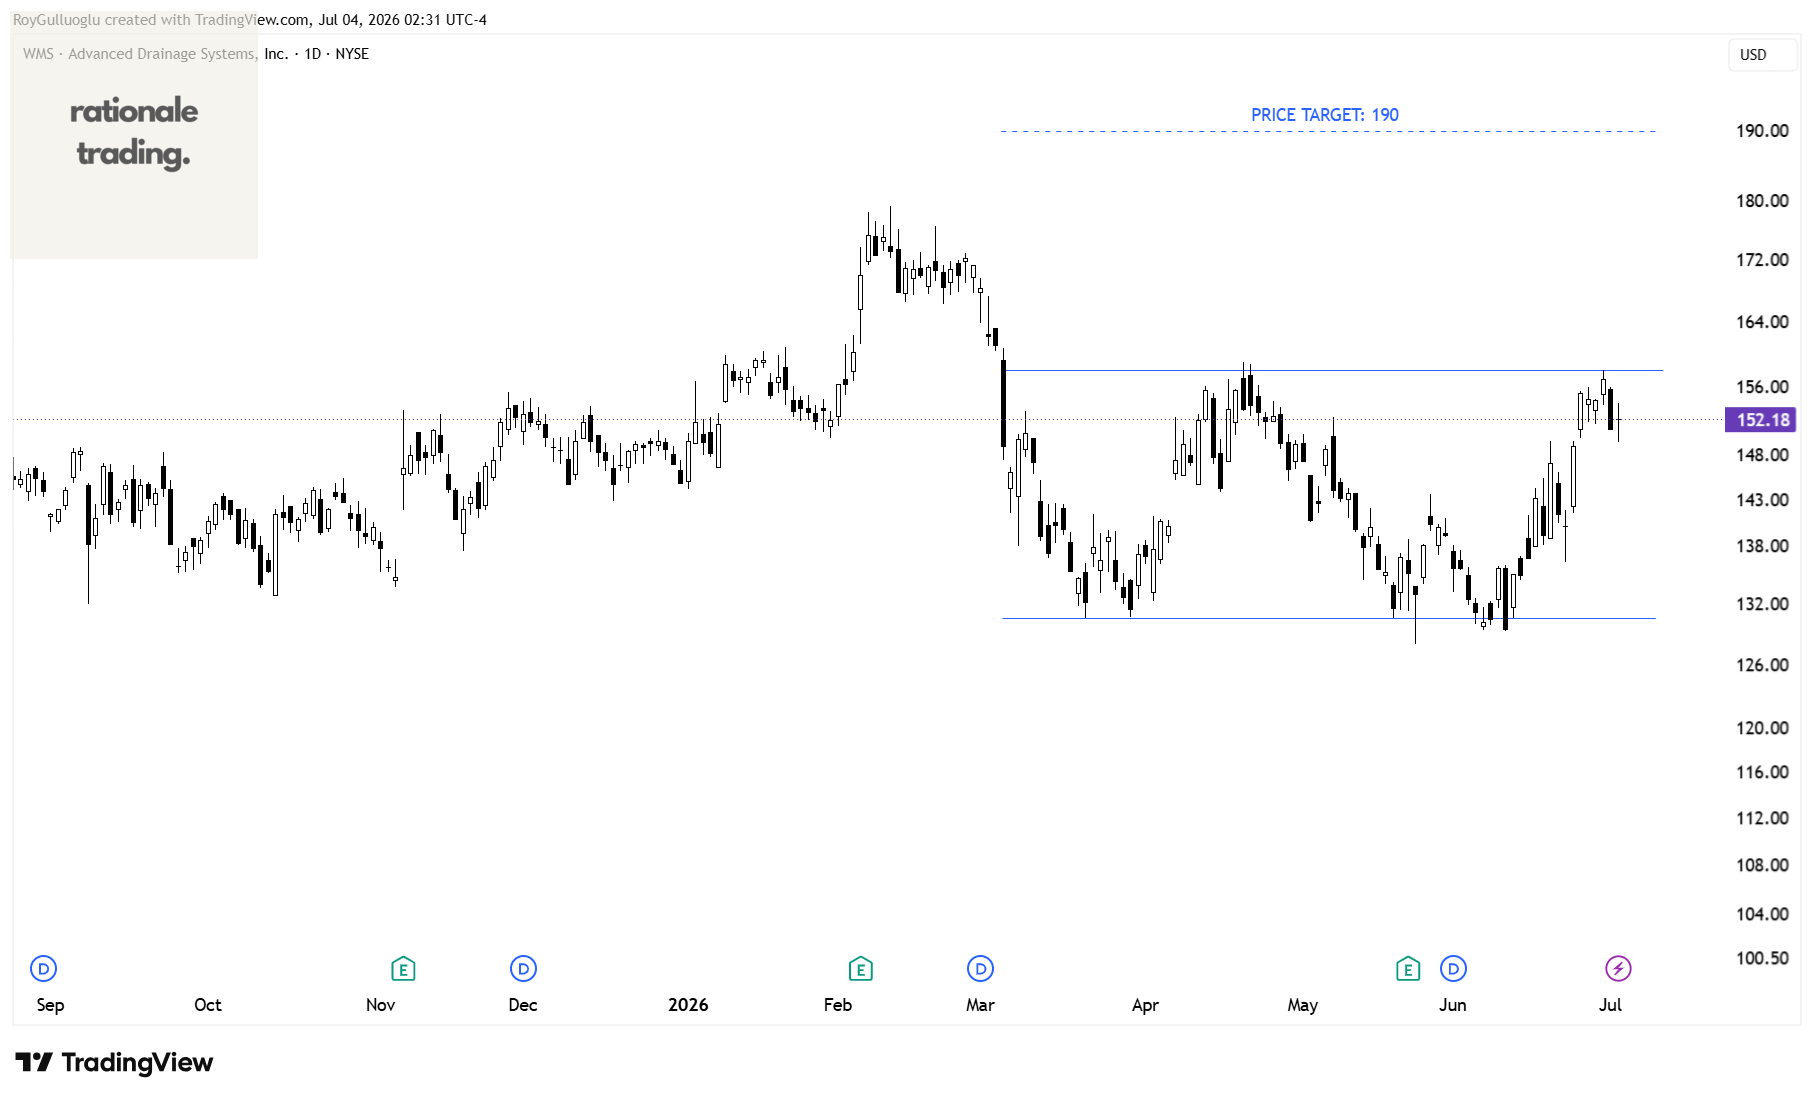
Advanced Drainage Systems, Inc. designs, manufactures, and markets thermoplastic corrugated pipes and related water management products in the United States, Canada, and internationally.
The above daily chart formed an approximately 3-month-long rectangle chart pattern as a bullish reversal after a downtrend.
Within this pattern, the horizontal boundary at 158 levels acts as a resistance.
A daily close above 160.7 levels would validate the breakout from the 3-month-long rectangle chart pattern .
Based on this chart pattern, the potential price target is 190 levels.
Rivian Automotive, Inc.-(RIVN/NASDAQ)-Long Idea
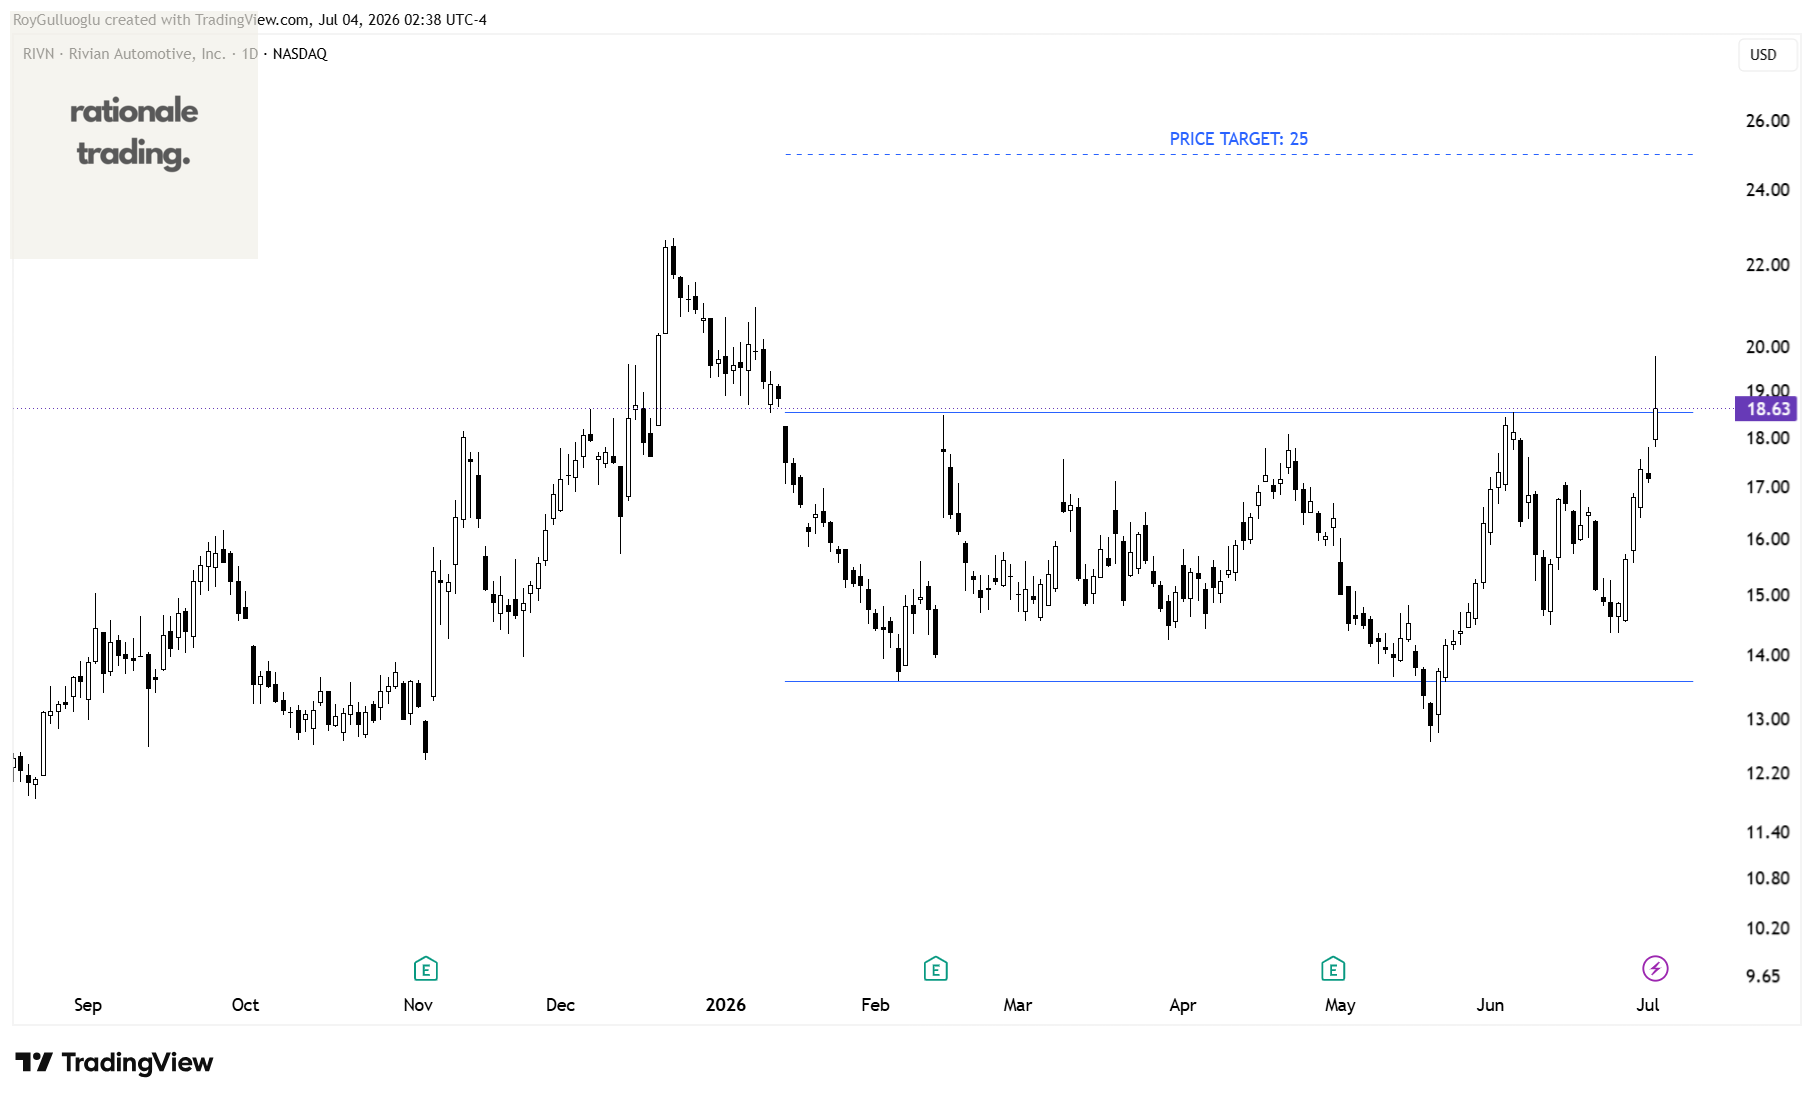
Rivian Automotive, Inc., together with its subsidiaries, develops, manufactures, and sells category-defining electric vehicles.
The above daily chart formed an approximately 4-month-long rectangle chart pattern as a bullish reversal after a downtrend.
Within this pattern, the horizontal boundary at 18.55 levels acts as a resistance.
A daily close above 19.12 levels would validate the breakout from the 4-month-long rectangle chart pattern .
Based on this chart pattern, the potential price target is 25 levels.
Knorr-Bremse AG-(KBX/XETR)-Long Idea
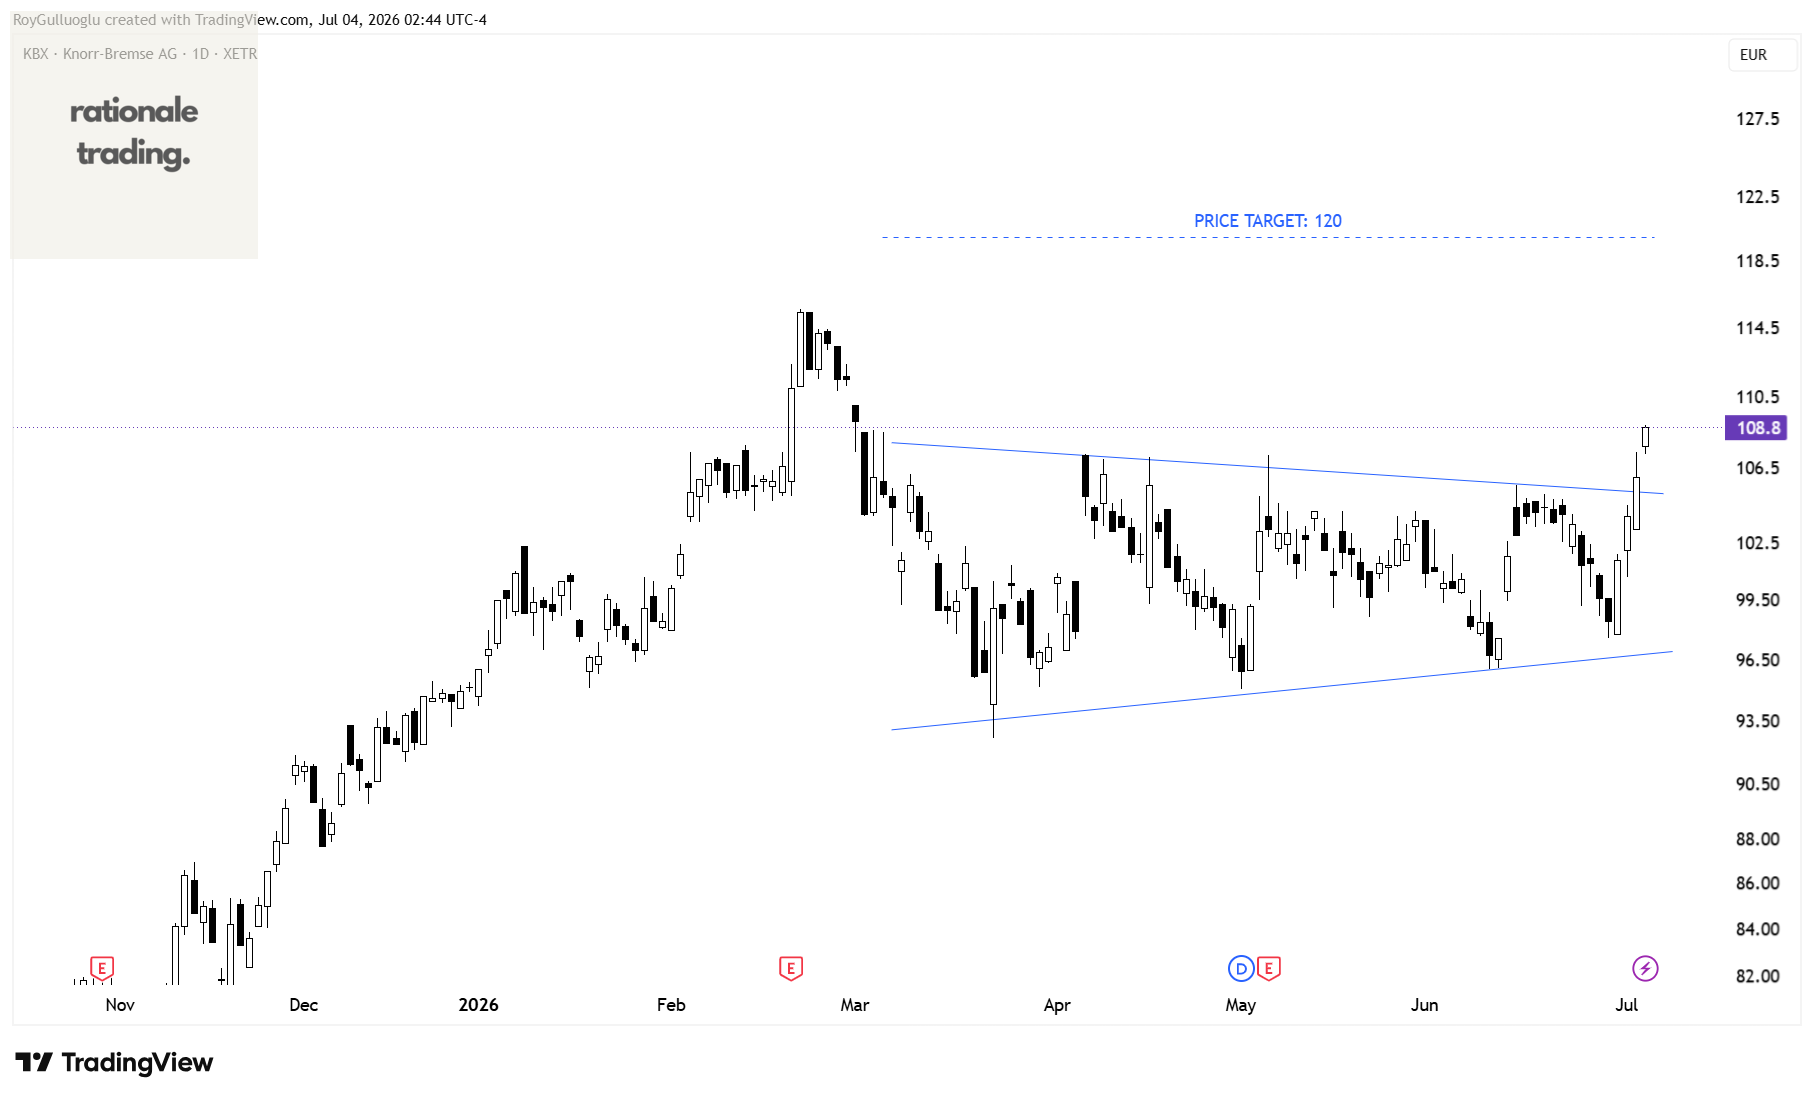
Knorr-Bremse AG, together with its subsidiaries, develops, produces, and markets brake systems for rail and commercial vehicles and other safety-critical systems worldwide.
The above daily chart formed an approximately 2-month-long symmetrical triangle chart pattern as a bullish reversal after a downtrend.
A daily close above 106.8 levels validated the breakout from the 2-month-long symmetrical triangle chart pattern.
Based on this chart pattern, the potential price target is 120 levels.
The Karur Vysya Bank Limited-(KARURVYSA/NSE)-Long Idea
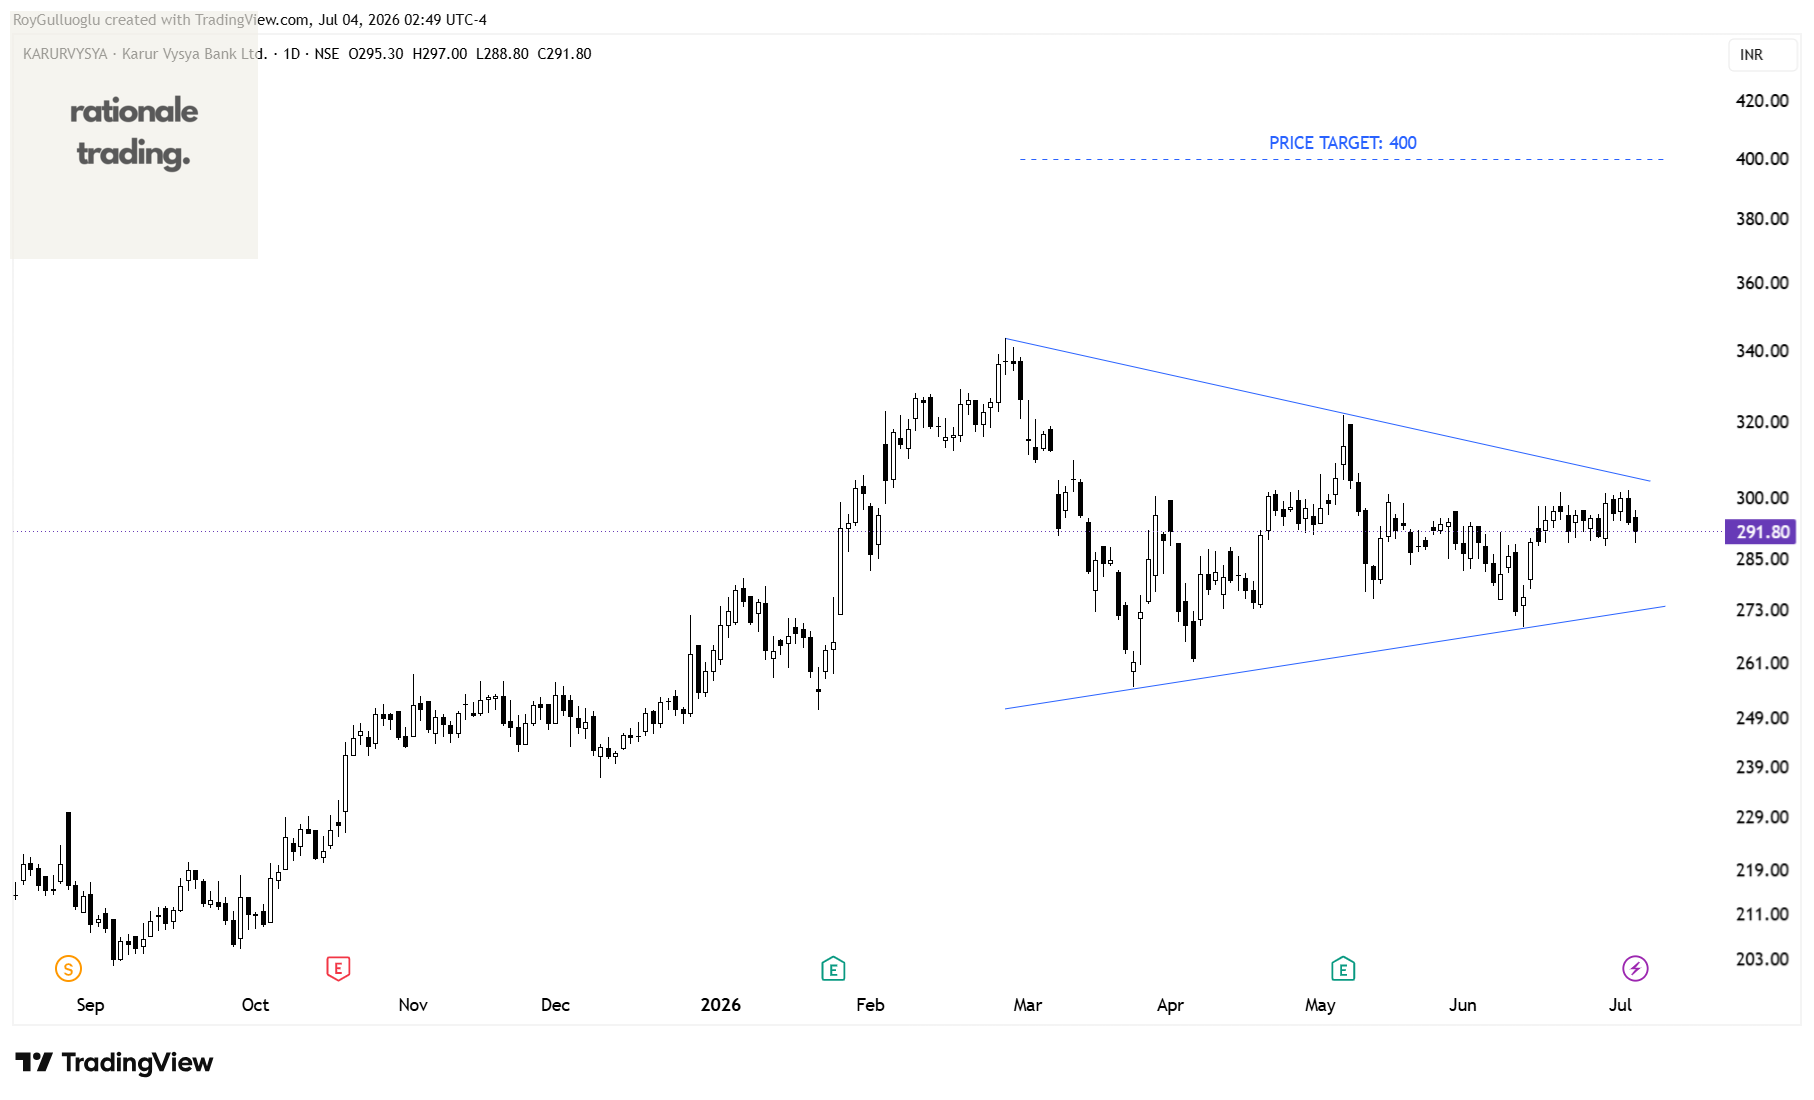
The Karur Vysya Bank Limited provides various banking and financial services for personal and corporate customers in India
The above daily chart formed an approximately 3-month-long symmetrical triangle chart pattern as a bullish reversal after a downtrend.
A daily close above 311 levels would validate the breakout from the 3-month-long symmetrical triangle chart pattern.
Based on this chart pattern, the potential price target is 400 levels.