


Federated Hermes, Inc.-(FHI/NYSE)-Long Idea
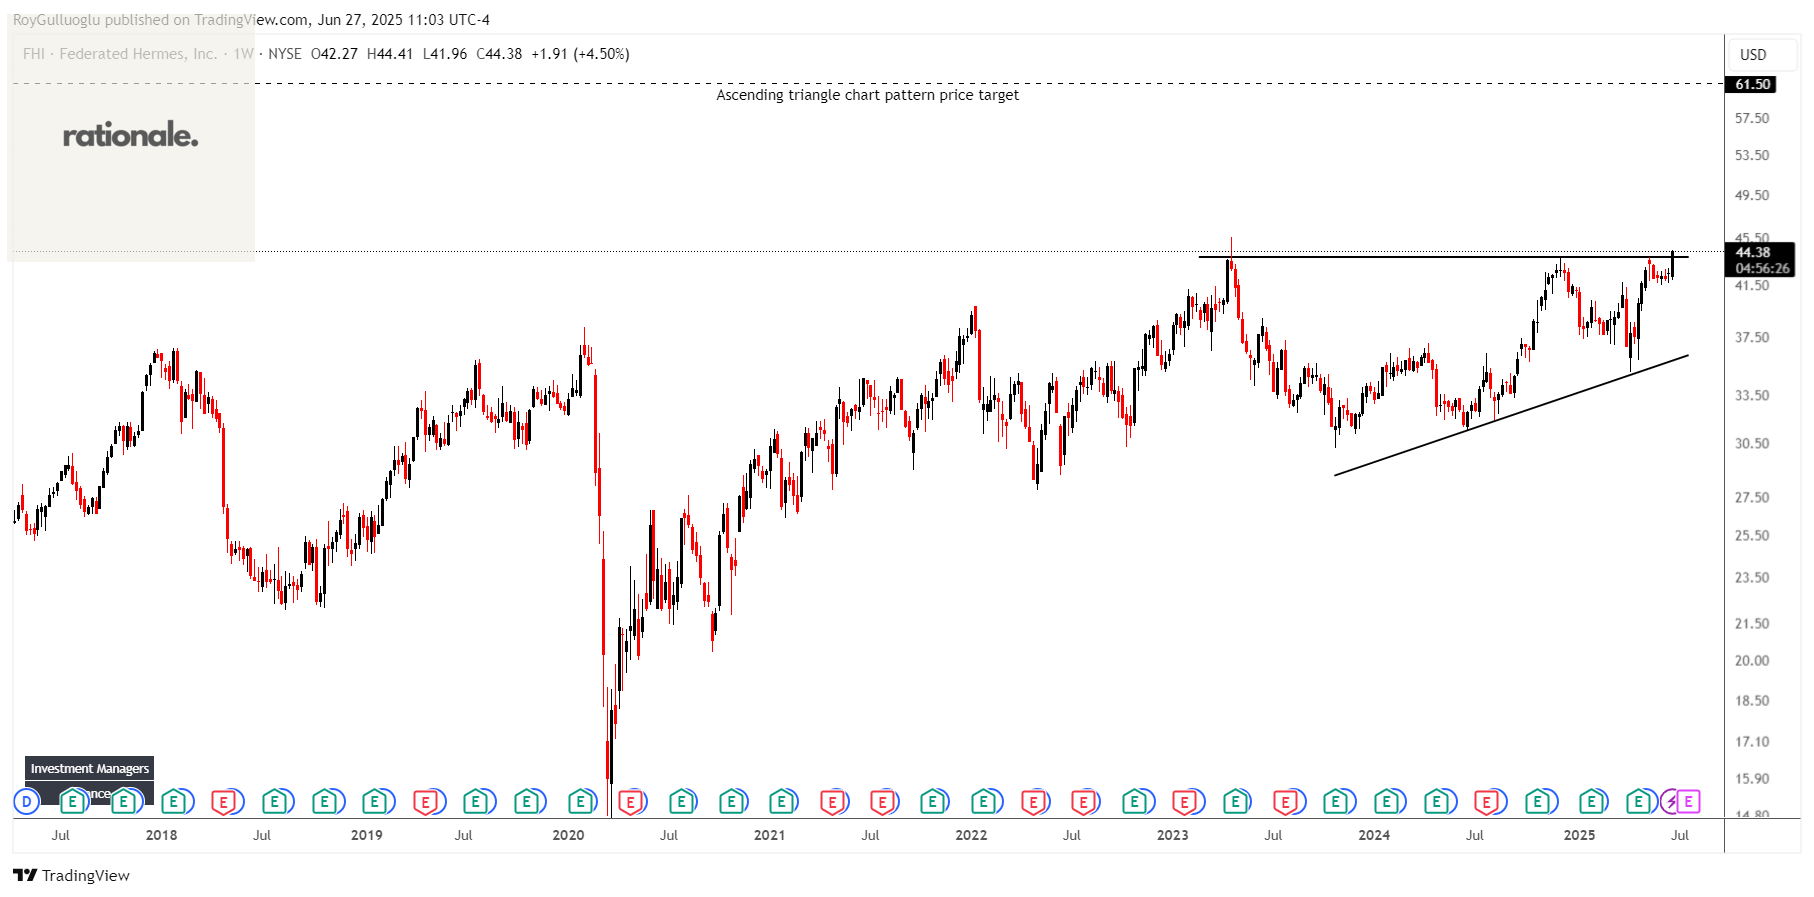
Federated Hermes, Inc. is a publicly owned investment manager.
The above weekly chart formed an approximately 28-month-long ascending triangle chart pattern as a bullish continuation after an uptrend.
The horizontal boundary at 43.87 levels acts as a resistance within this pattern.
A daily close above 45.18 levels would validate the breakout from the 28-month-long ascending triangle chart pattern.
Based on this chart pattern, the potential price target is 61.5 levels.
FHI, classified under the "financial services" sector, falls under the “Mid Cap - Income” stock category.
FirstCash Holdings, Inc.-(FCFS/NASDAQ)-Long Idea
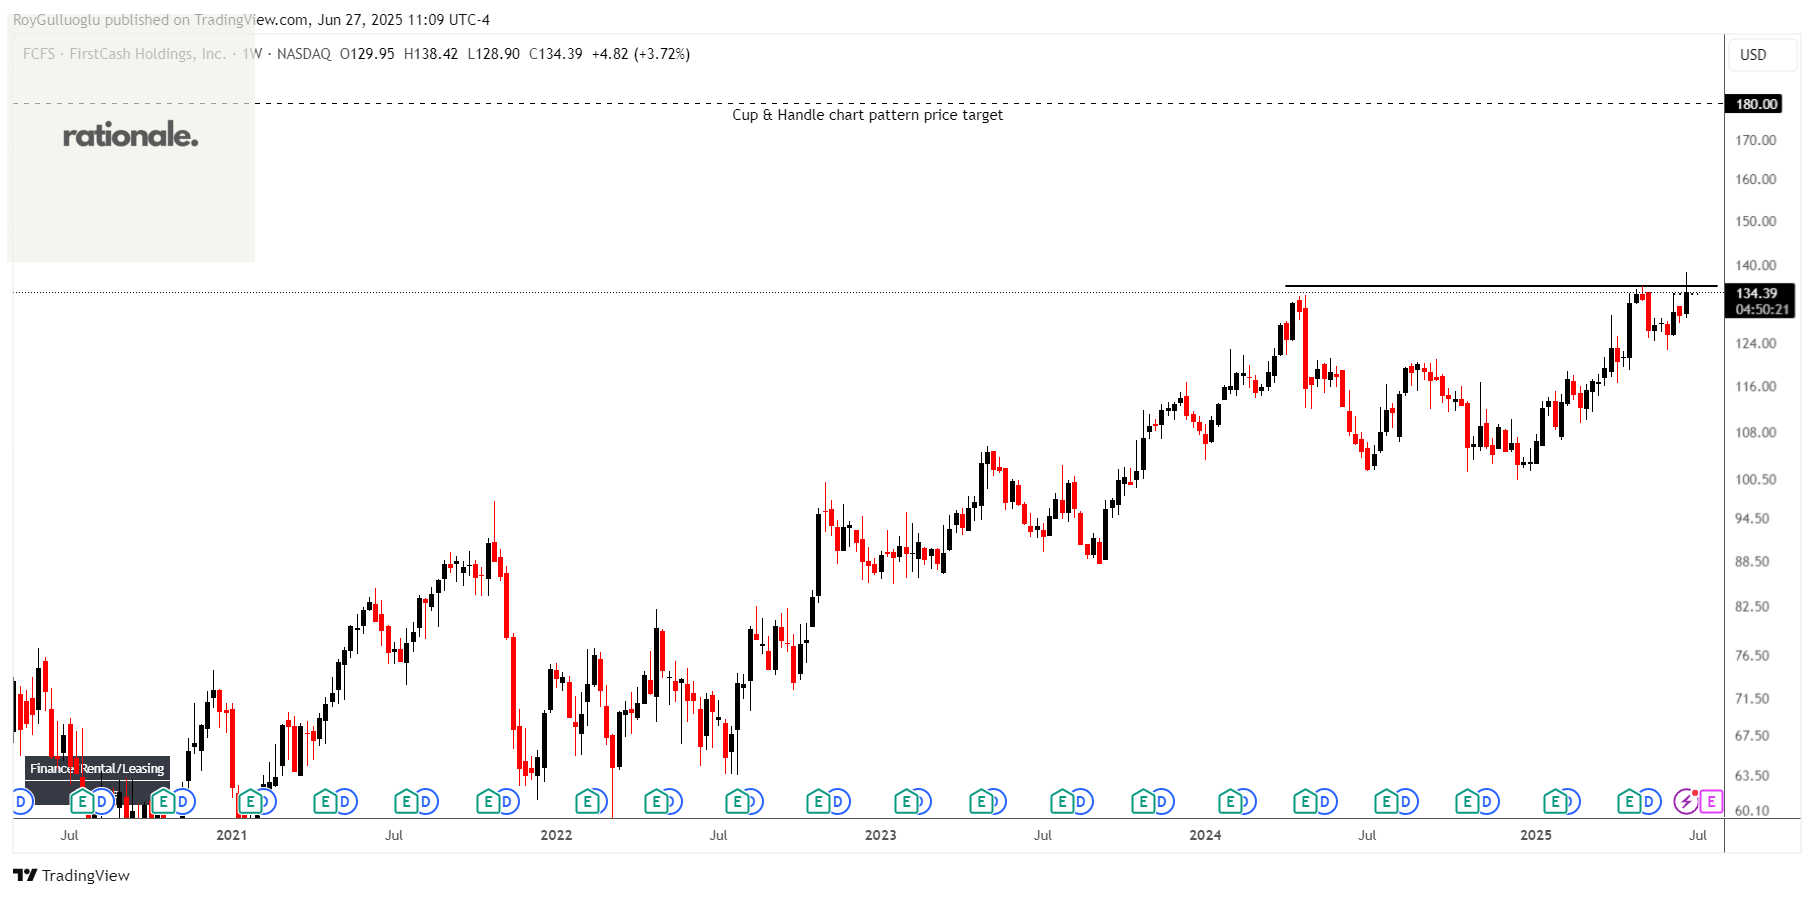
FirstCash Holdings, Inc., together with its subsidiaries, operates retail pawn stores in the United States, Mexico, and rest of Latin America.
The above weekly chart formed an approximately 15-month-long Cup & Handle chart pattern as a bullish continuation after an uptrend.
The horizontal boundary at 135.57 levels acts as a resistance within this pattern.
A daily close above 139.63 levels would validate the breakout from the 15-month-long Cup & Handle chart pattern.
Based on this chart pattern, the potential price target is 180 levels.
FCFS, classified under the "financial services" sector, falls under the “Mid Cap - Income” stock category.
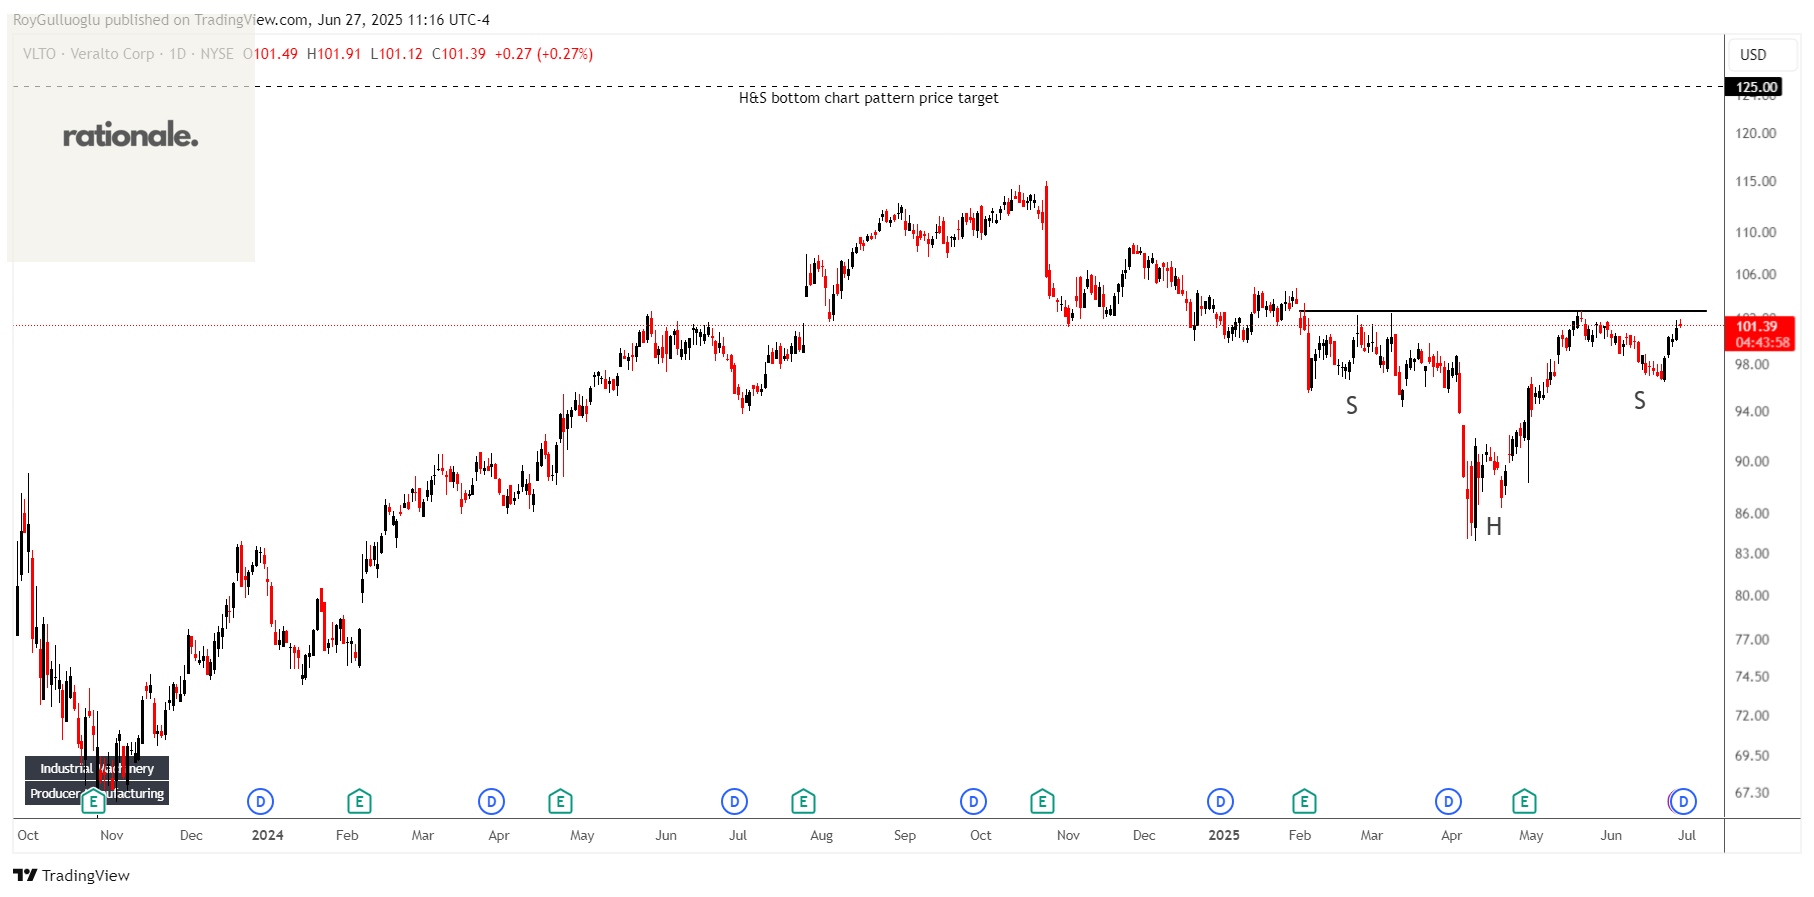
Veralto Corporation-(VLTO/NYSE)-Long Idea
McGrath RentCorp operates as a business-to-business rental company in the United States and internationally.
The above daily chart formed an approximately 3-month-long H&S bottom chart pattern as a bullish reversal after a downtrend.
The horizontal boundary at 102.6 levels acts as a resistance within this pattern.
A daily close above 105.6 levels would validate the breakout from the 3-month-long H&S bottom chart pattern.
Based on this chart pattern, the potential price target is 125 levels.
VLTO, classified under the "industrials" sector, falls under the “Large Cap - Value” stock category.
NextNav Inc.-(NN/NASDAQ)-Long Idea
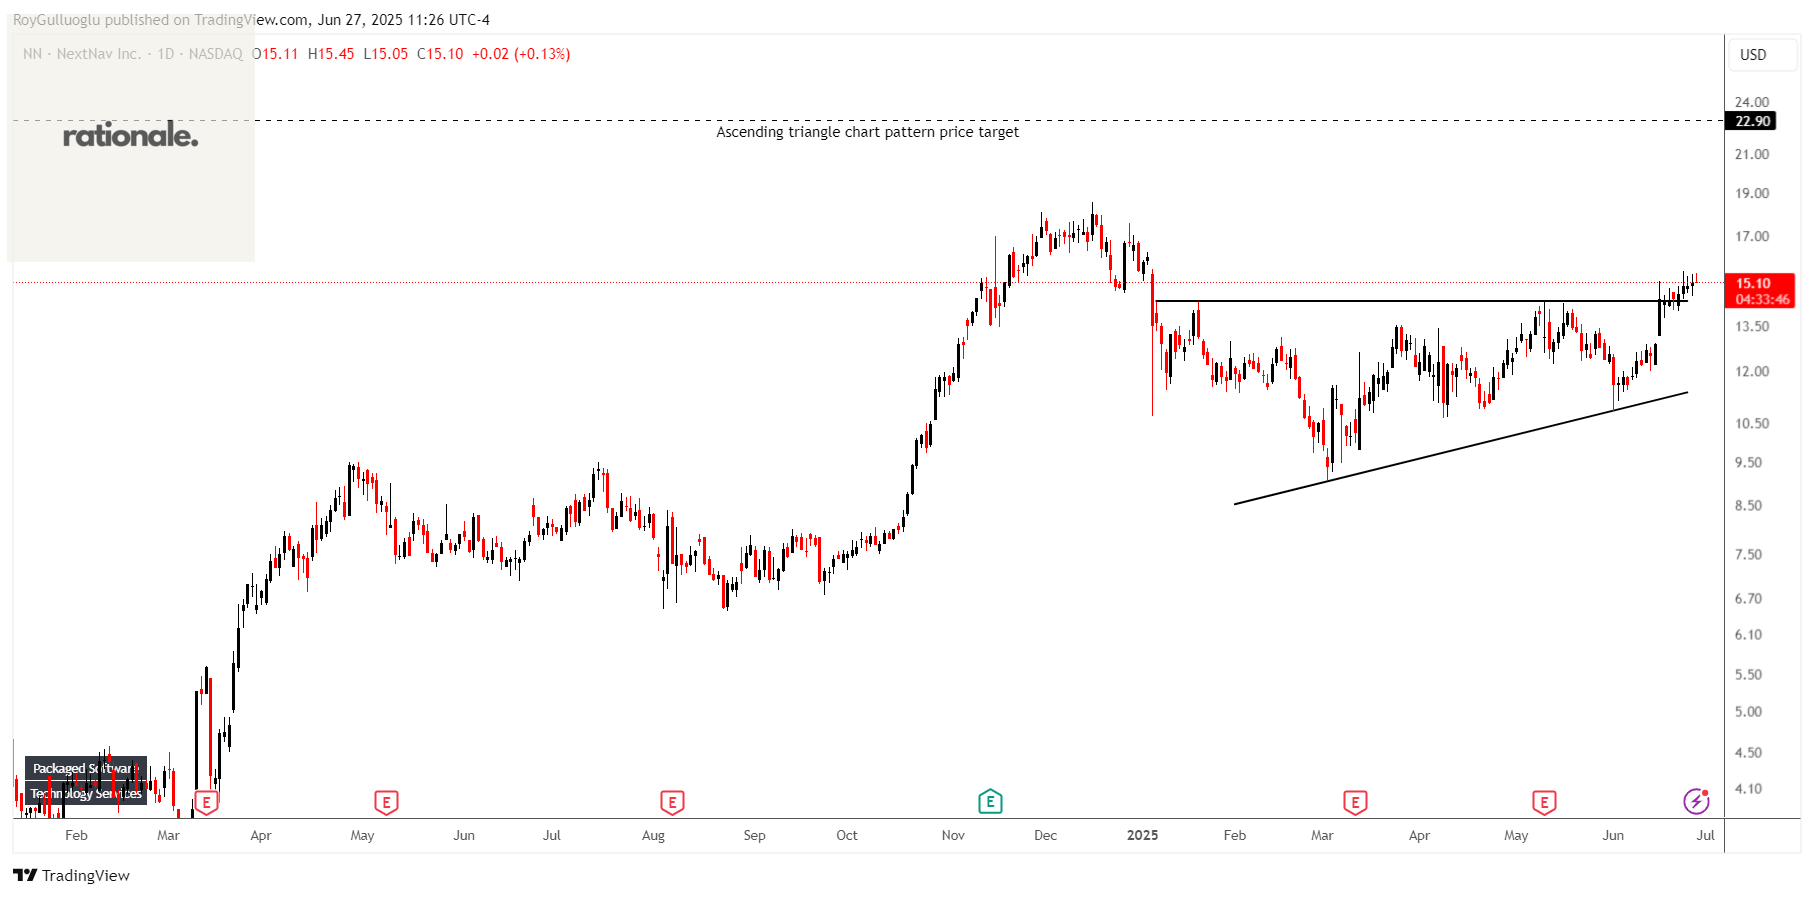
NextNav Inc. provides positioning, navigation, and timing (PNT) solutions in the United States.
The above daily chart formed an approximately 3-month-long ascending triangle chart pattern as a bullish reversal after a downtrend.
The horizontal boundary at 14.37 levels acted as a resistance within this pattern.
A daily close above 14.8 levels validated the breakout from the 3-month-long ascending triangle chart pattern.
Based on this chart pattern, the potential price target is 22.9 levels.
NN, classified under the "technology" sector, falls under the “Small Cap - Growth” stock category.
Matrix Service Company-(MTRX/NASDAQ)-Long Idea
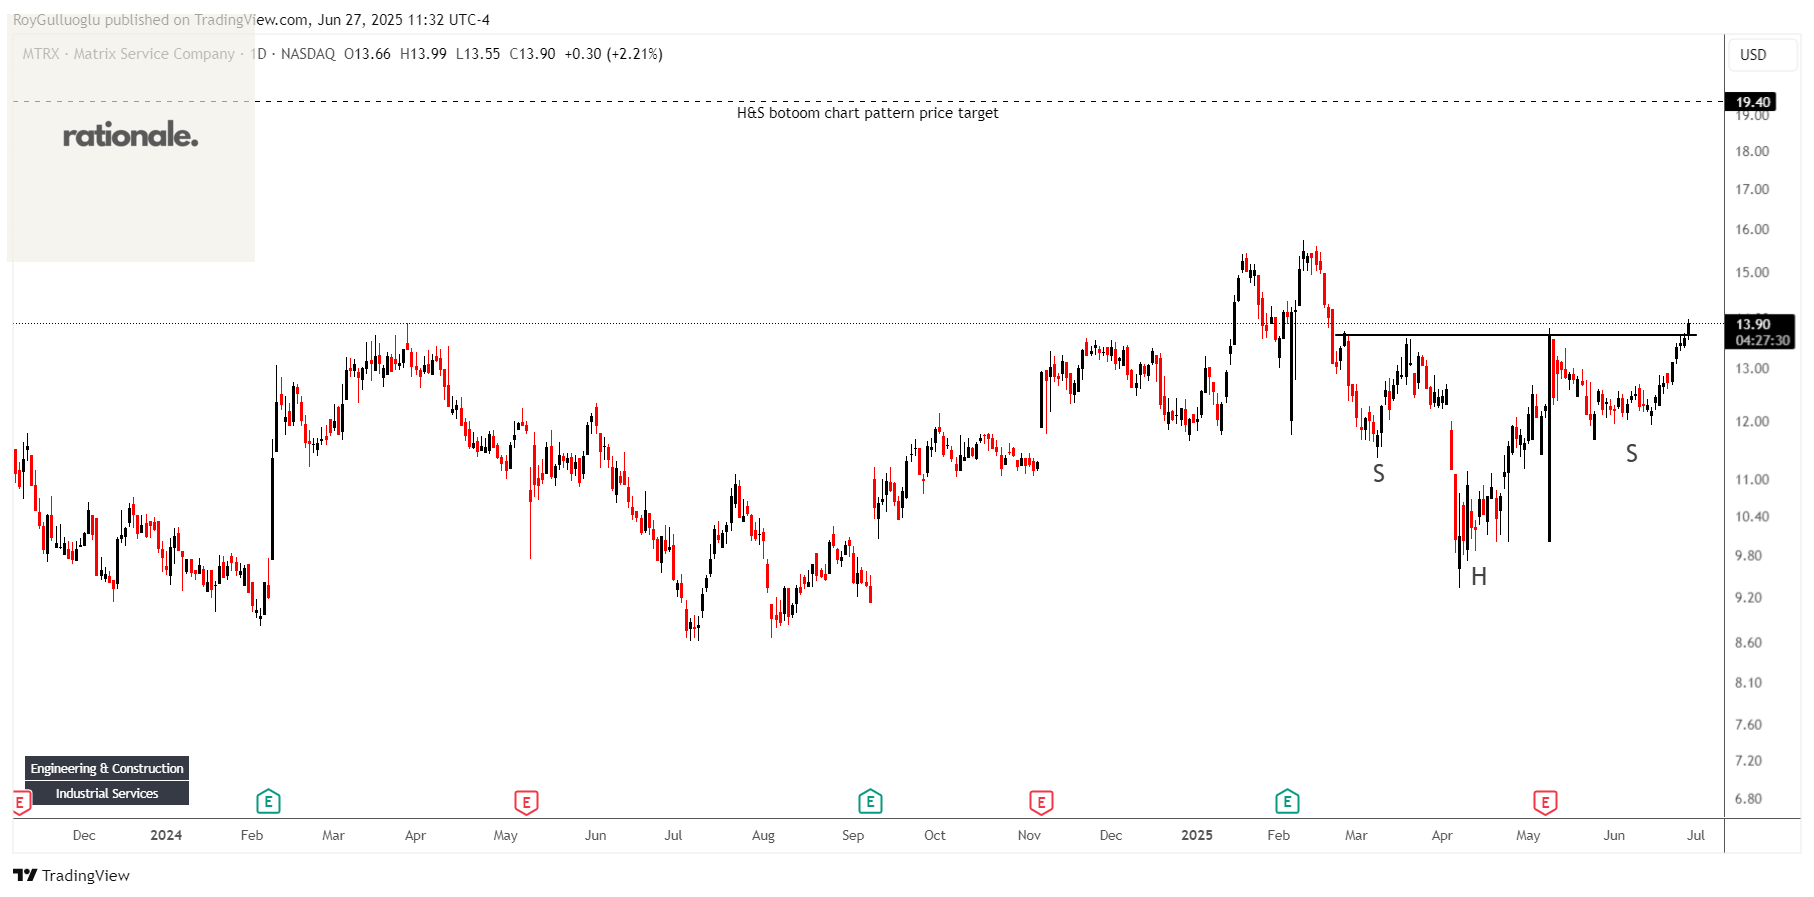
Matrix Service Company provides engineering, fabrication, construction, and maintenance services to support critical energy infrastructure and industrial markets in the United States, Canada, and internationally.
The above daily chart formed an approximately 3-month-long H&S bottom chart pattern as a bullish reversal after a downtrend.
The horizontal boundary at 13.65 levels acts as a resistance within this pattern.
A daily close above 14.05 levels would validate the breakout from the 3-month-long H&S bottom chart pattern.
Based on this chart pattern, the potential price target is 19.4 levels.
MTRX, classified under the "industrials" sector, falls under the “Small Cap - Value” stock category.
Teşekkürler Roy. Analizleri yayinlamadan önce, çizimini yaptıktan sonra verileri tam ekrana sığdır olarak ayarlarsan; 1- formasyonları daha net görürüz. 2- Mum formasyonları daha belirgin olur ve formasyonu yorumlama kalitemiz artar.