


GE Vernova Inc.-(GEV/NYSE)-Short Idea
GE Vernova Inc., an energy company, engages in the provision of various products and services that generate, transfer, orchestrate, convert, and store electricity in the United States, Europe, Asia, the Middle East, and Africa.
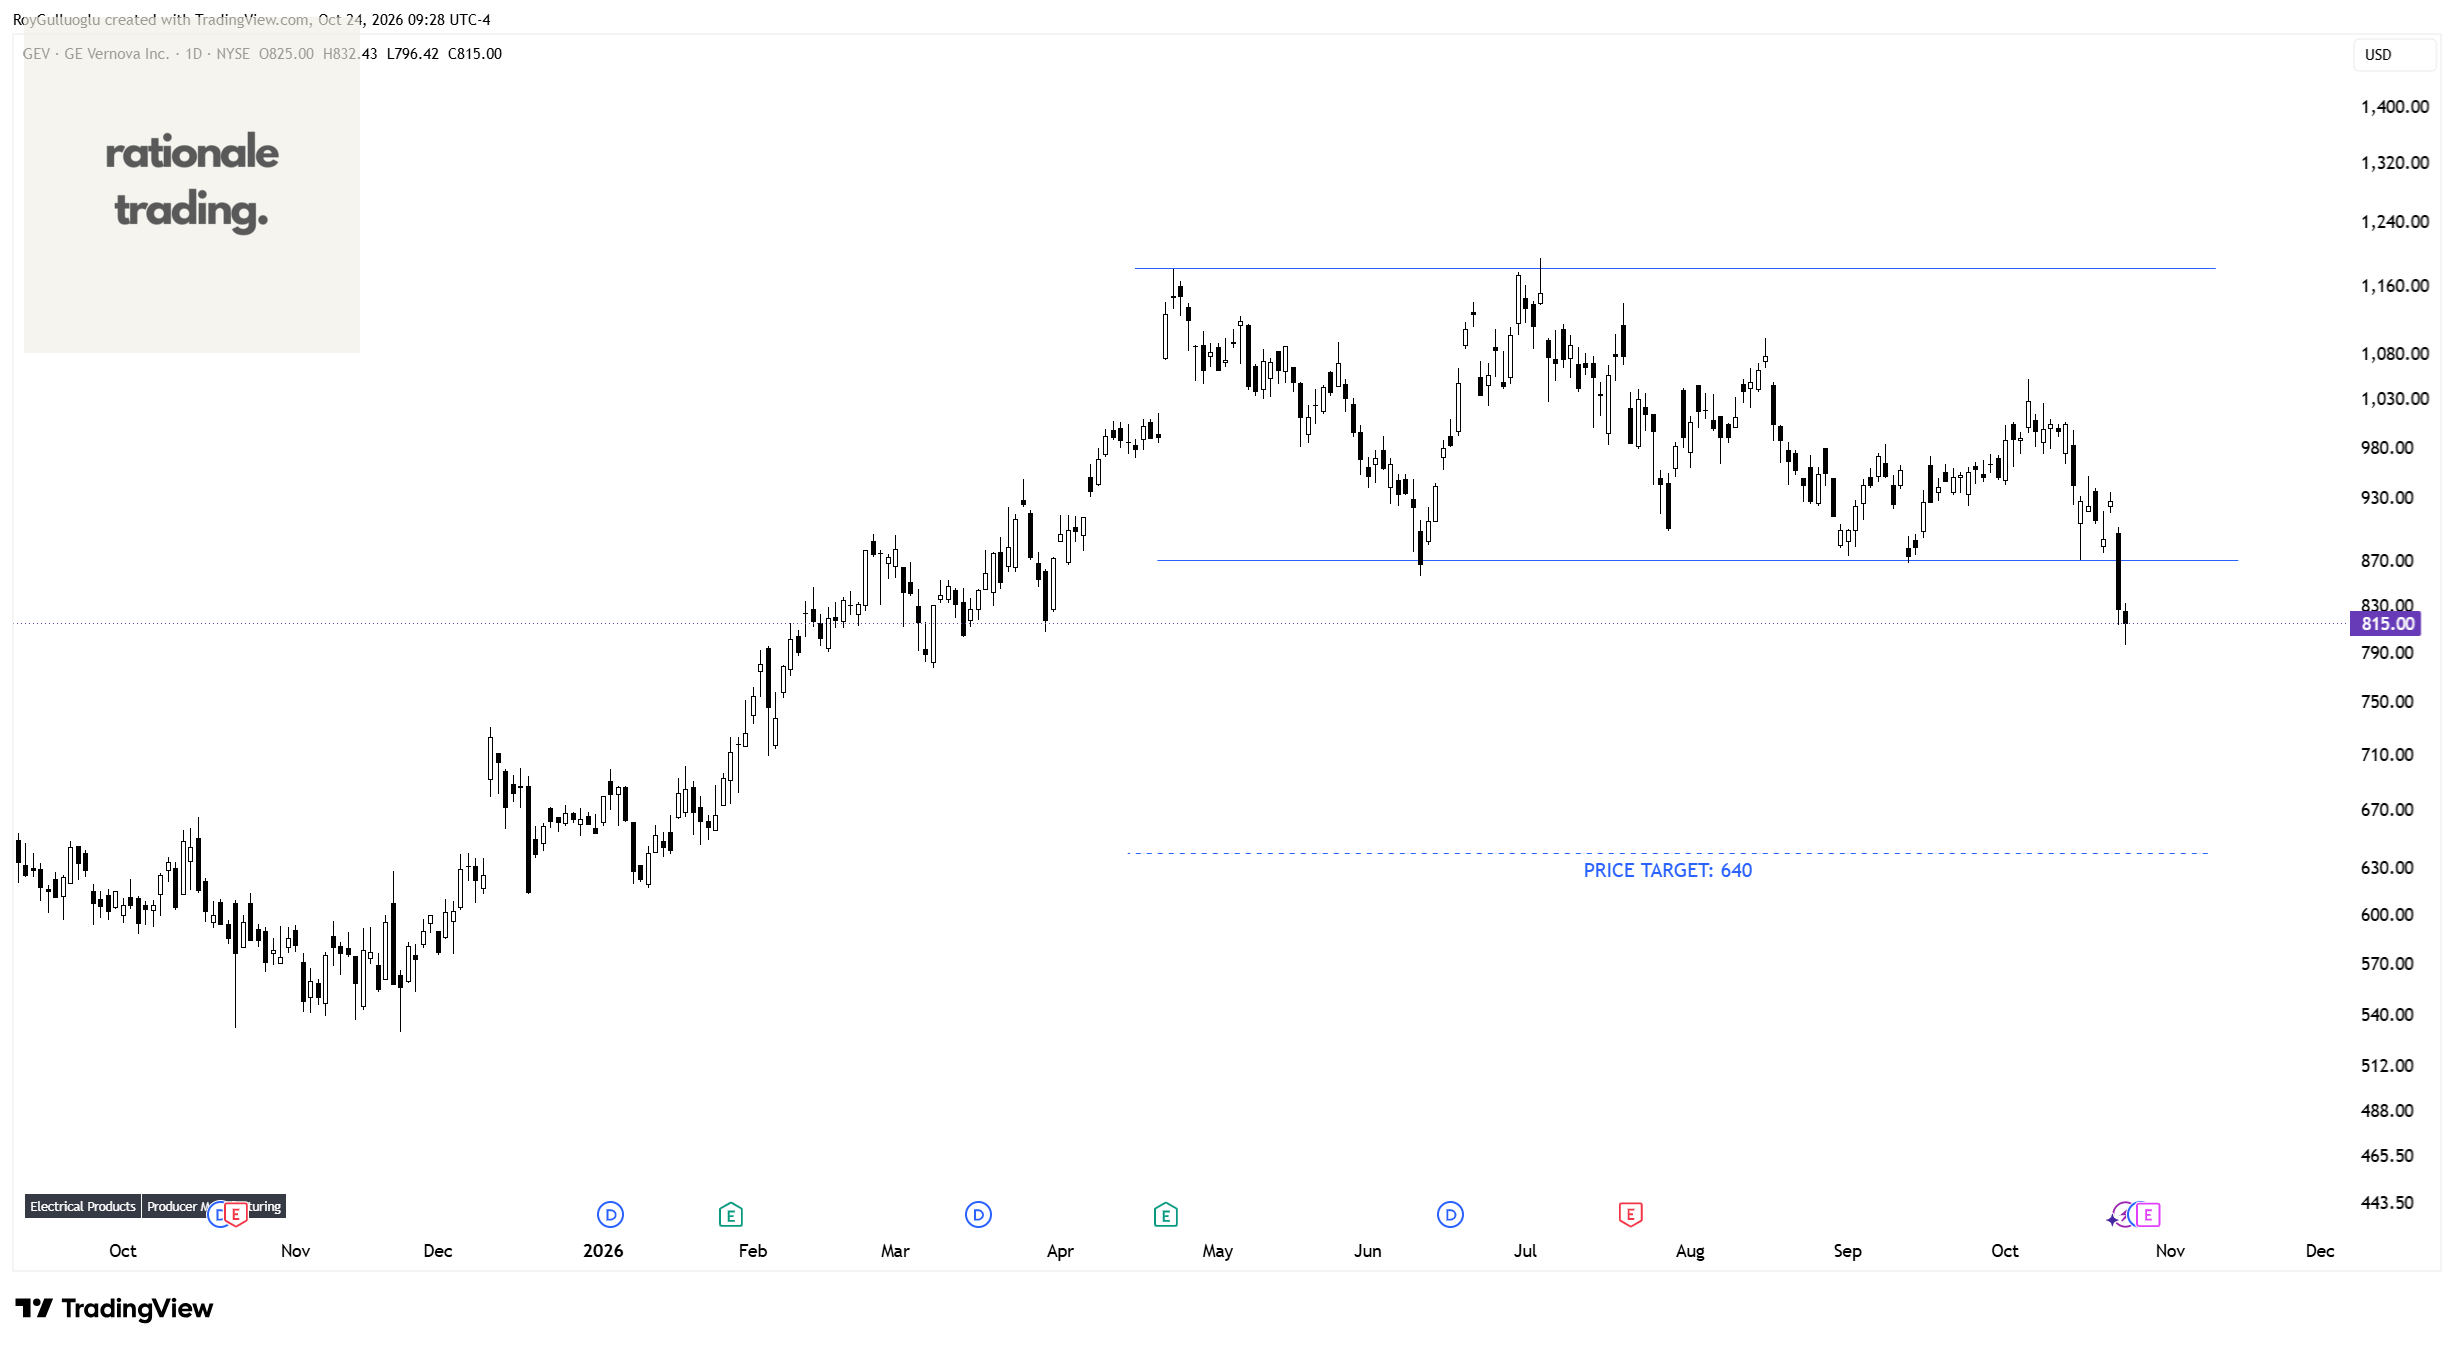
The above daily chart formed an approximately 4-month-long rectangle chart pattern as a bearish reversal after a n uptrend.
Within this pattern, the horizontal boundary at 871.16 levels acted as a resistance.
A daily close below 845 levels validated the breakout from the 4-month-long rectangle chart pattern.
Based on this chart pattern, the potential price target is 640 levels.
Balchem Corporation-(BCPC/NASDAQ)-Long Idea
Balchem Corporation develops, manufactures, and distributes specialty performance ingredients and products for the nutritional, food, pharmaceutical, animal health, medical device sterilization, plant nutrition, and industrial markets worldwide.
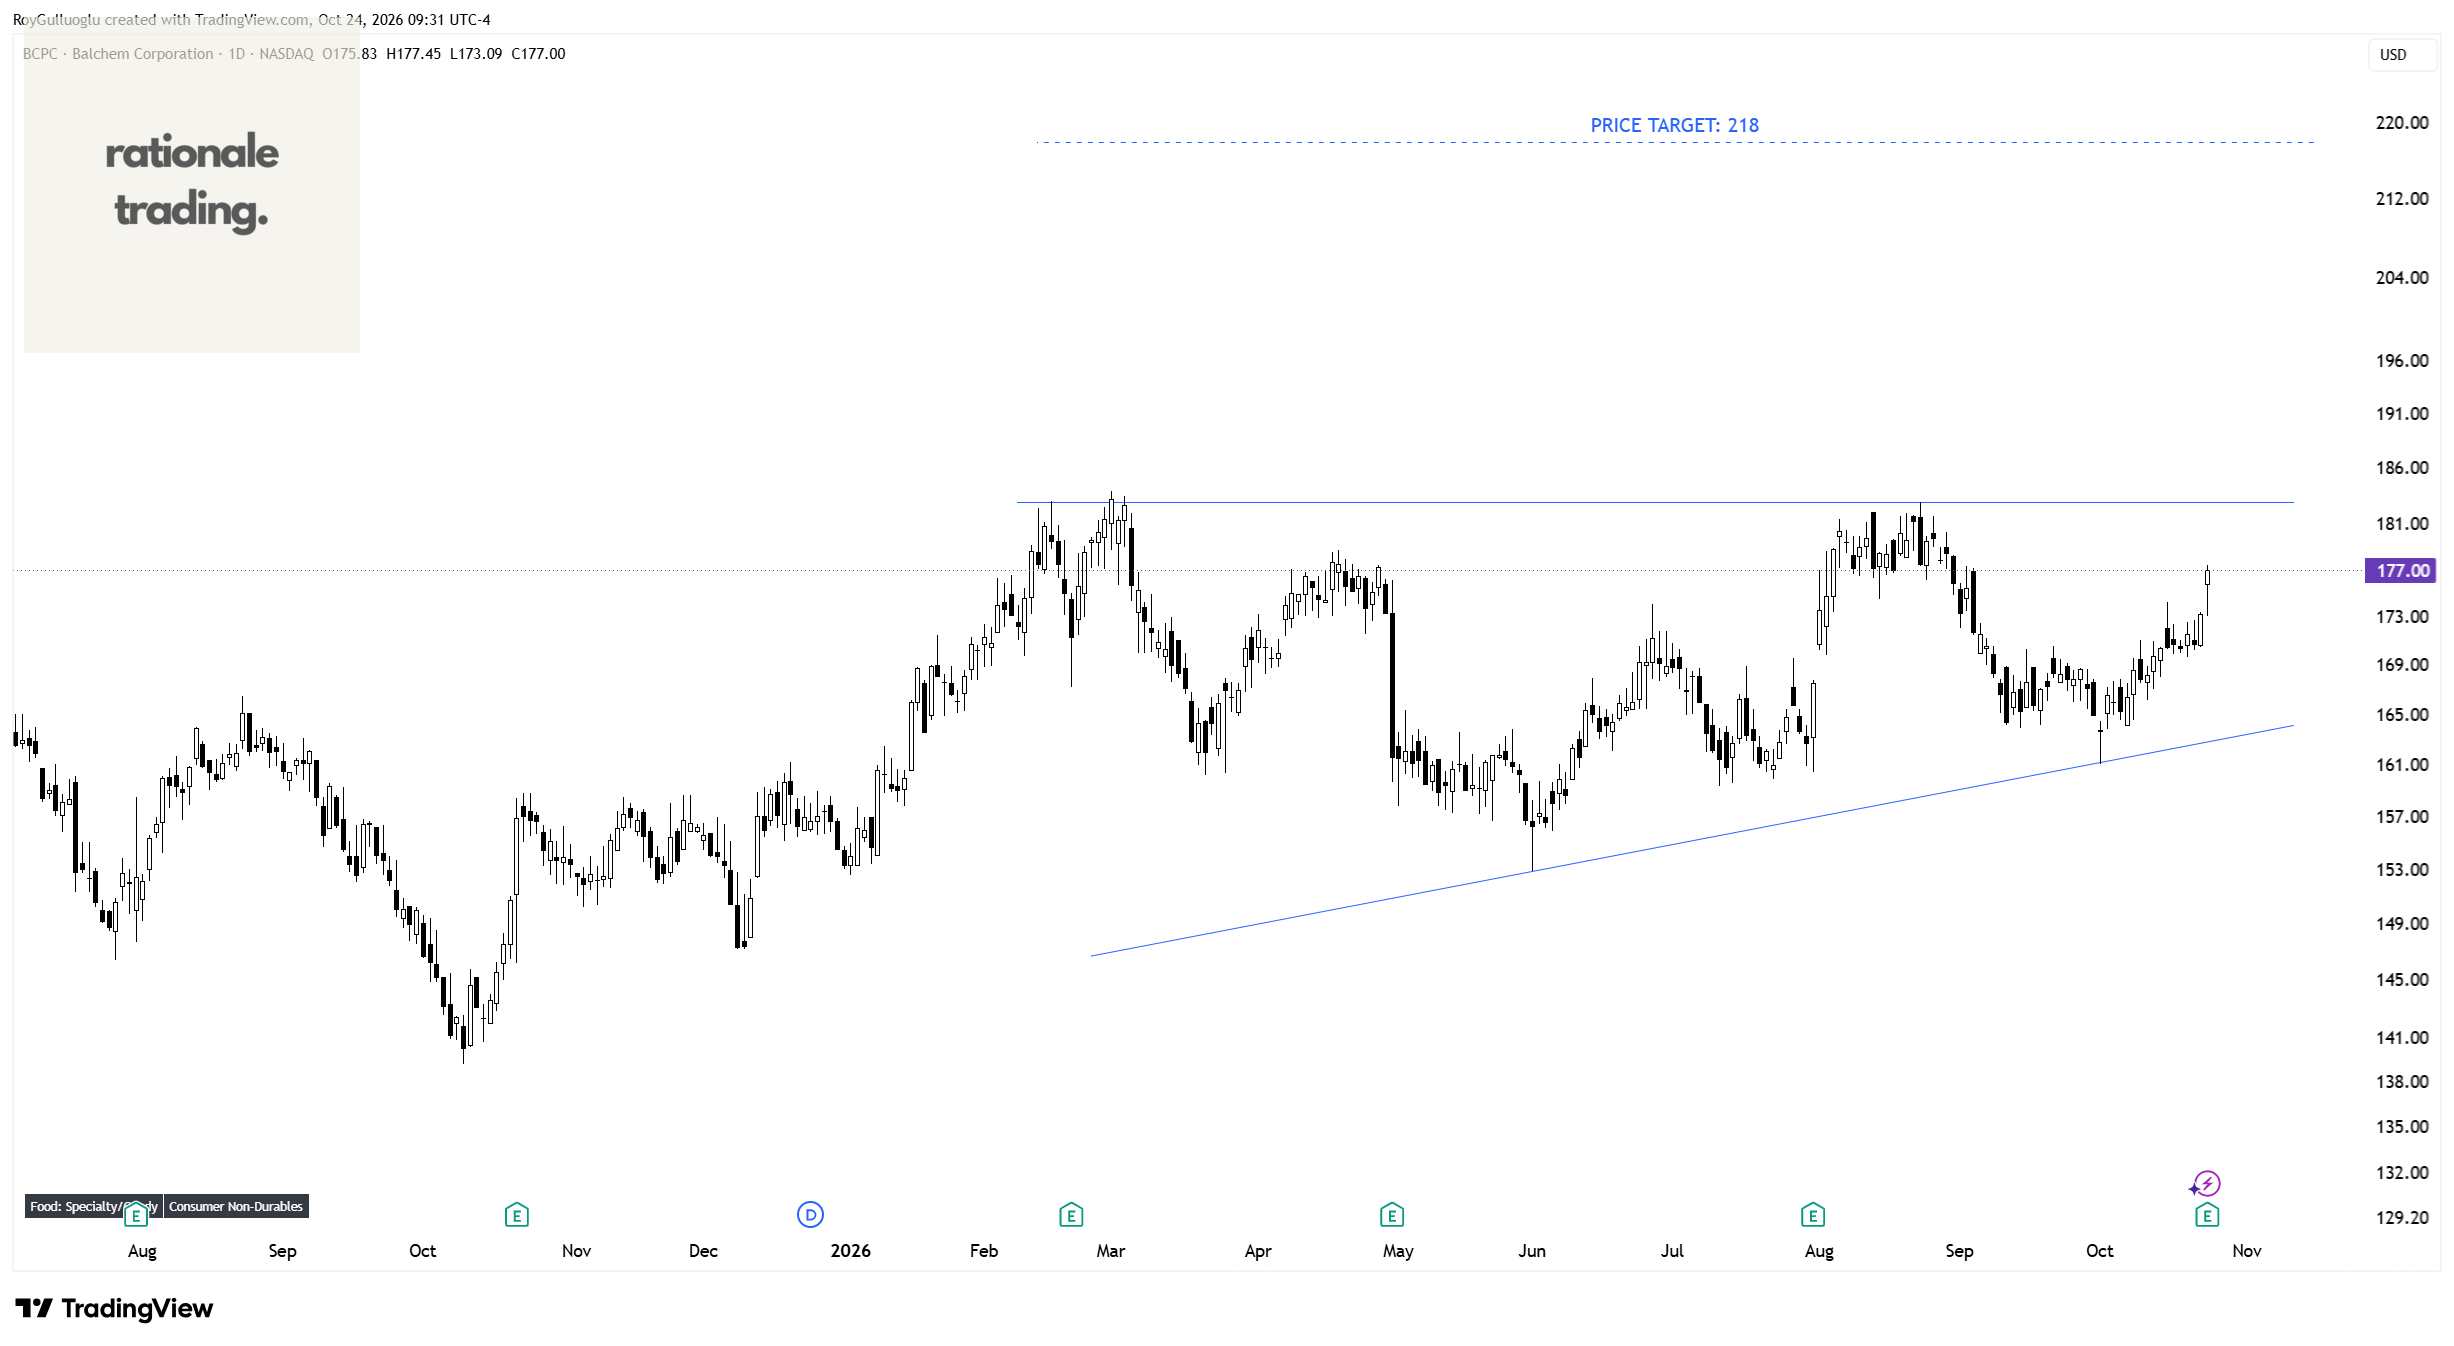
The above daily chart formed an approximately 6-month-long ascending triangle chart pattern as a bullish continuation after an uptrend.
Within this pattern, the horizontal boundary at 183 levels acts as a resistance.
A daily close above 188.5 levels would validate the breakout from the 6-month-long ascending triangle chart pattern.
Based on this chart pattern, the potential price target is 218 levels.
Spotify Technology S.A.-(SPOT/NYSE)-Long Idea
Spotify Technology S.A., together with its subsidiaries, provides audio streaming subscription services worldwide.
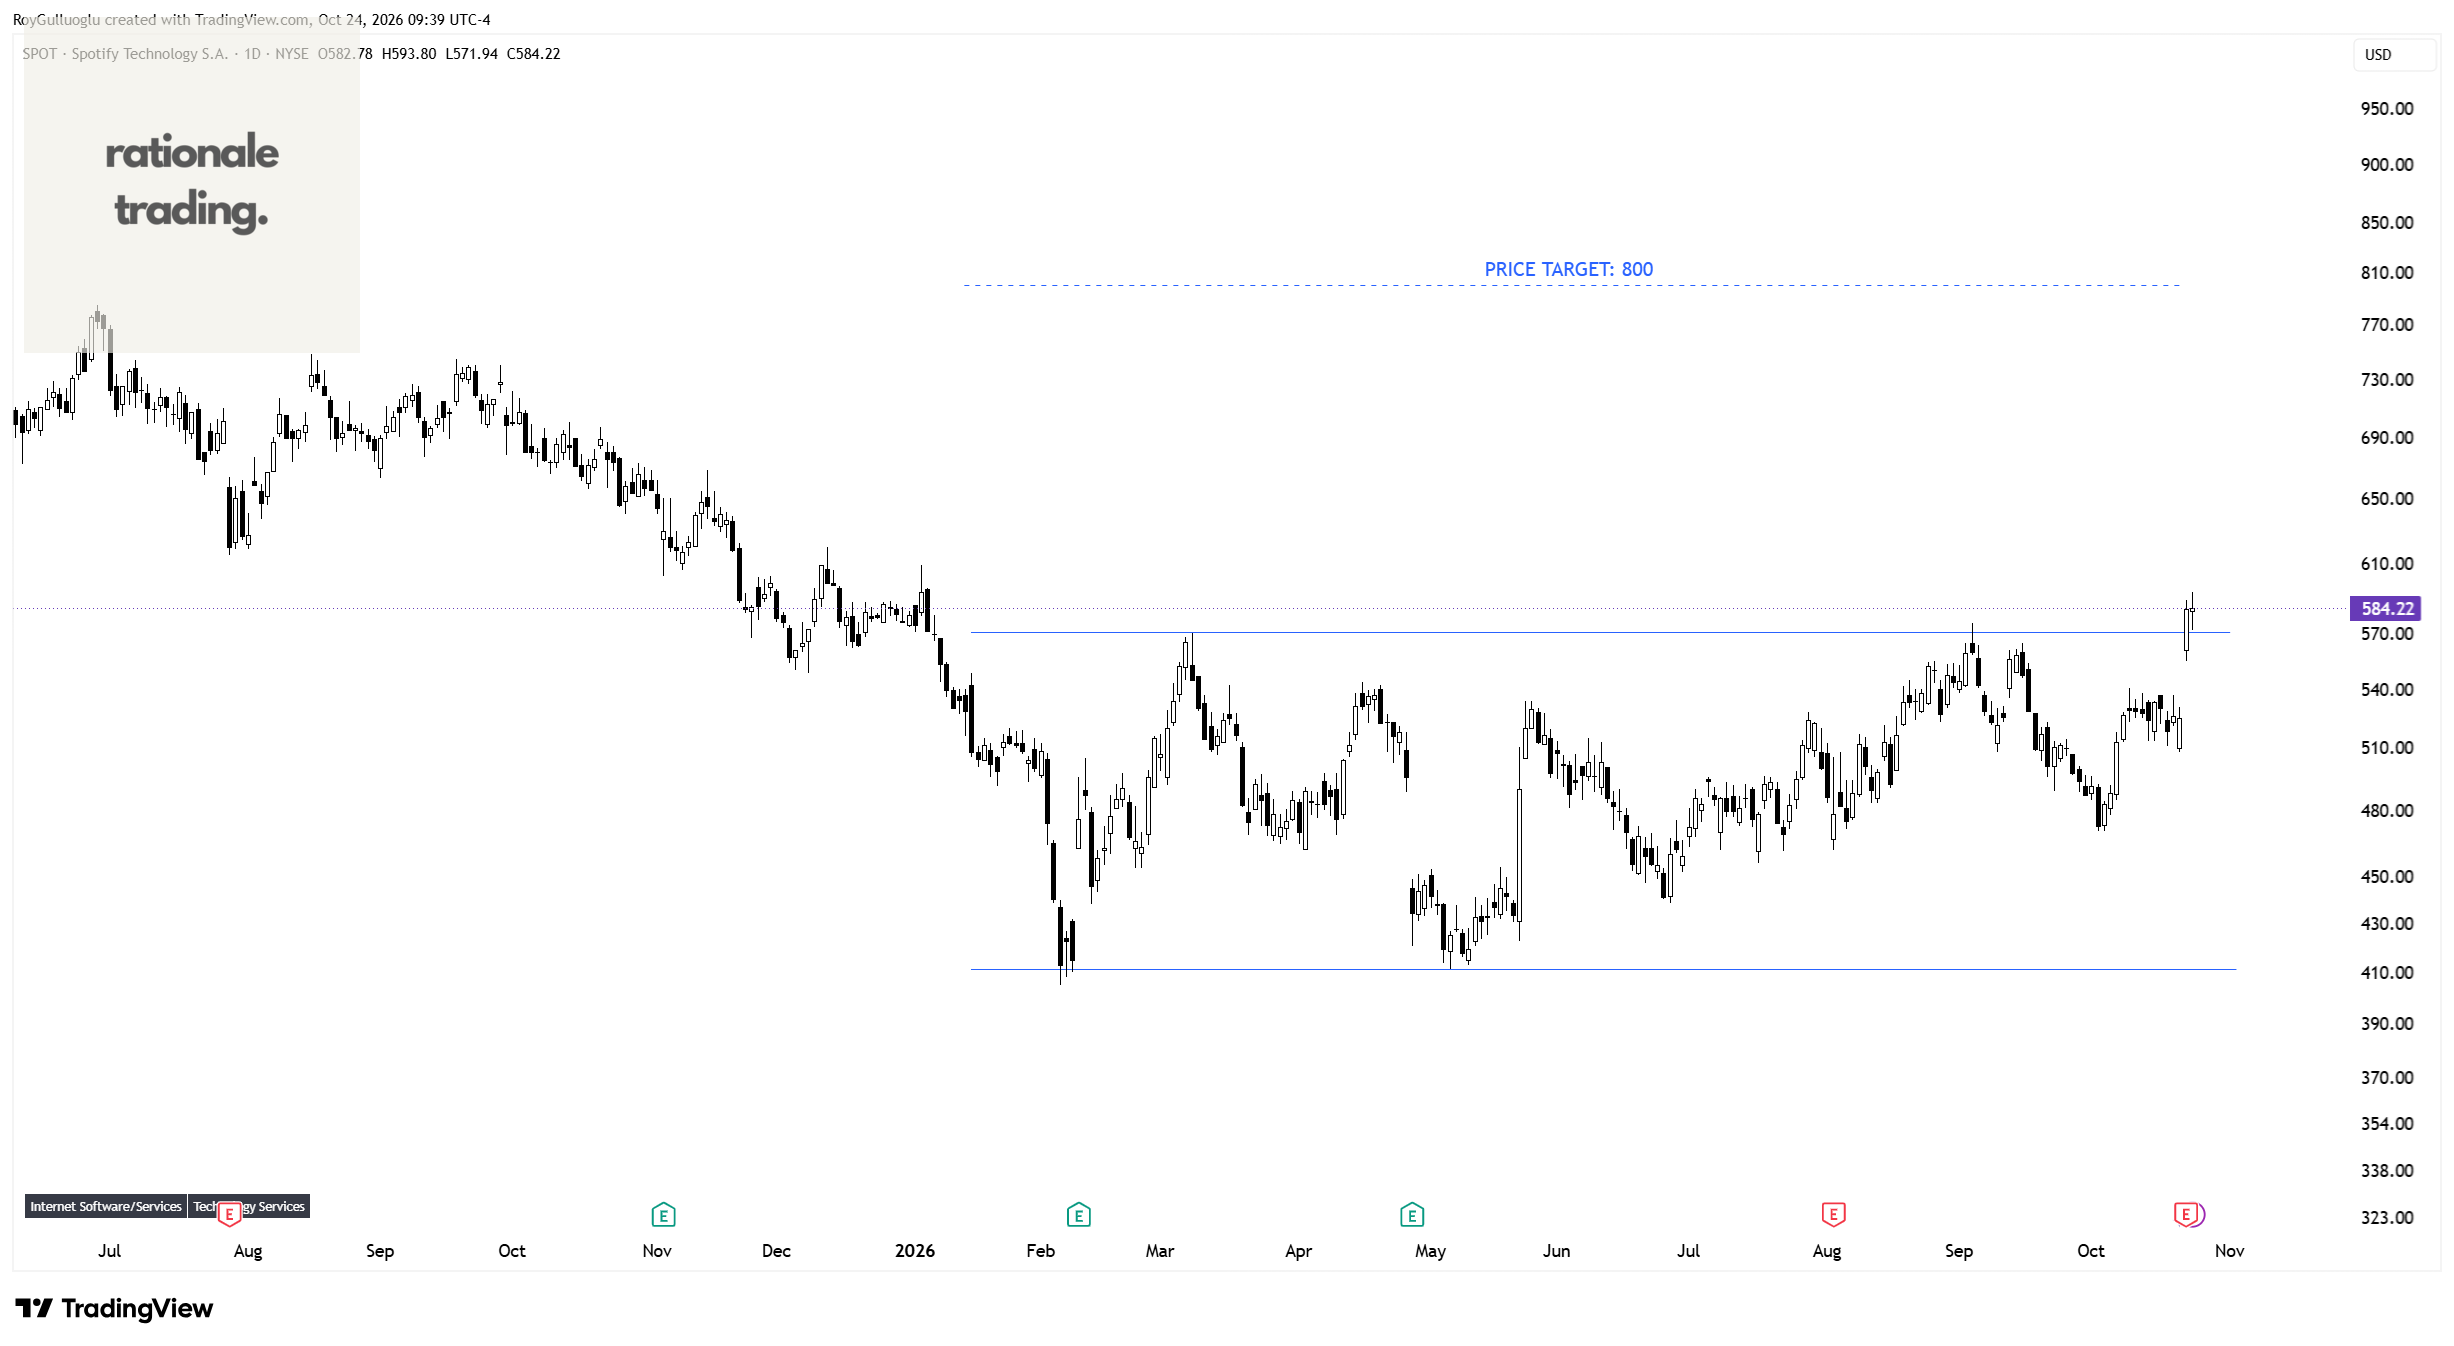
The above daily chart formed an approximately 6-month-long rectnagle chart pattern as a bullish reversal after a downtrend.
Within this pattern, the horizontal boundary at 570.94 levels acts as a resistance.
A daily close above 588 levels would validate the breakout from the 6-month-long rectnagle chart pattern.
Based on this chart pattern, the potential price target is 800 levels.
Pegasystems Inc.-(PEGA/NASDAQ)-Long Idea
Pacific Biosciences of California, Inc. designs, develops, and manufactures sequencing solutions to resolve genetically complex problems
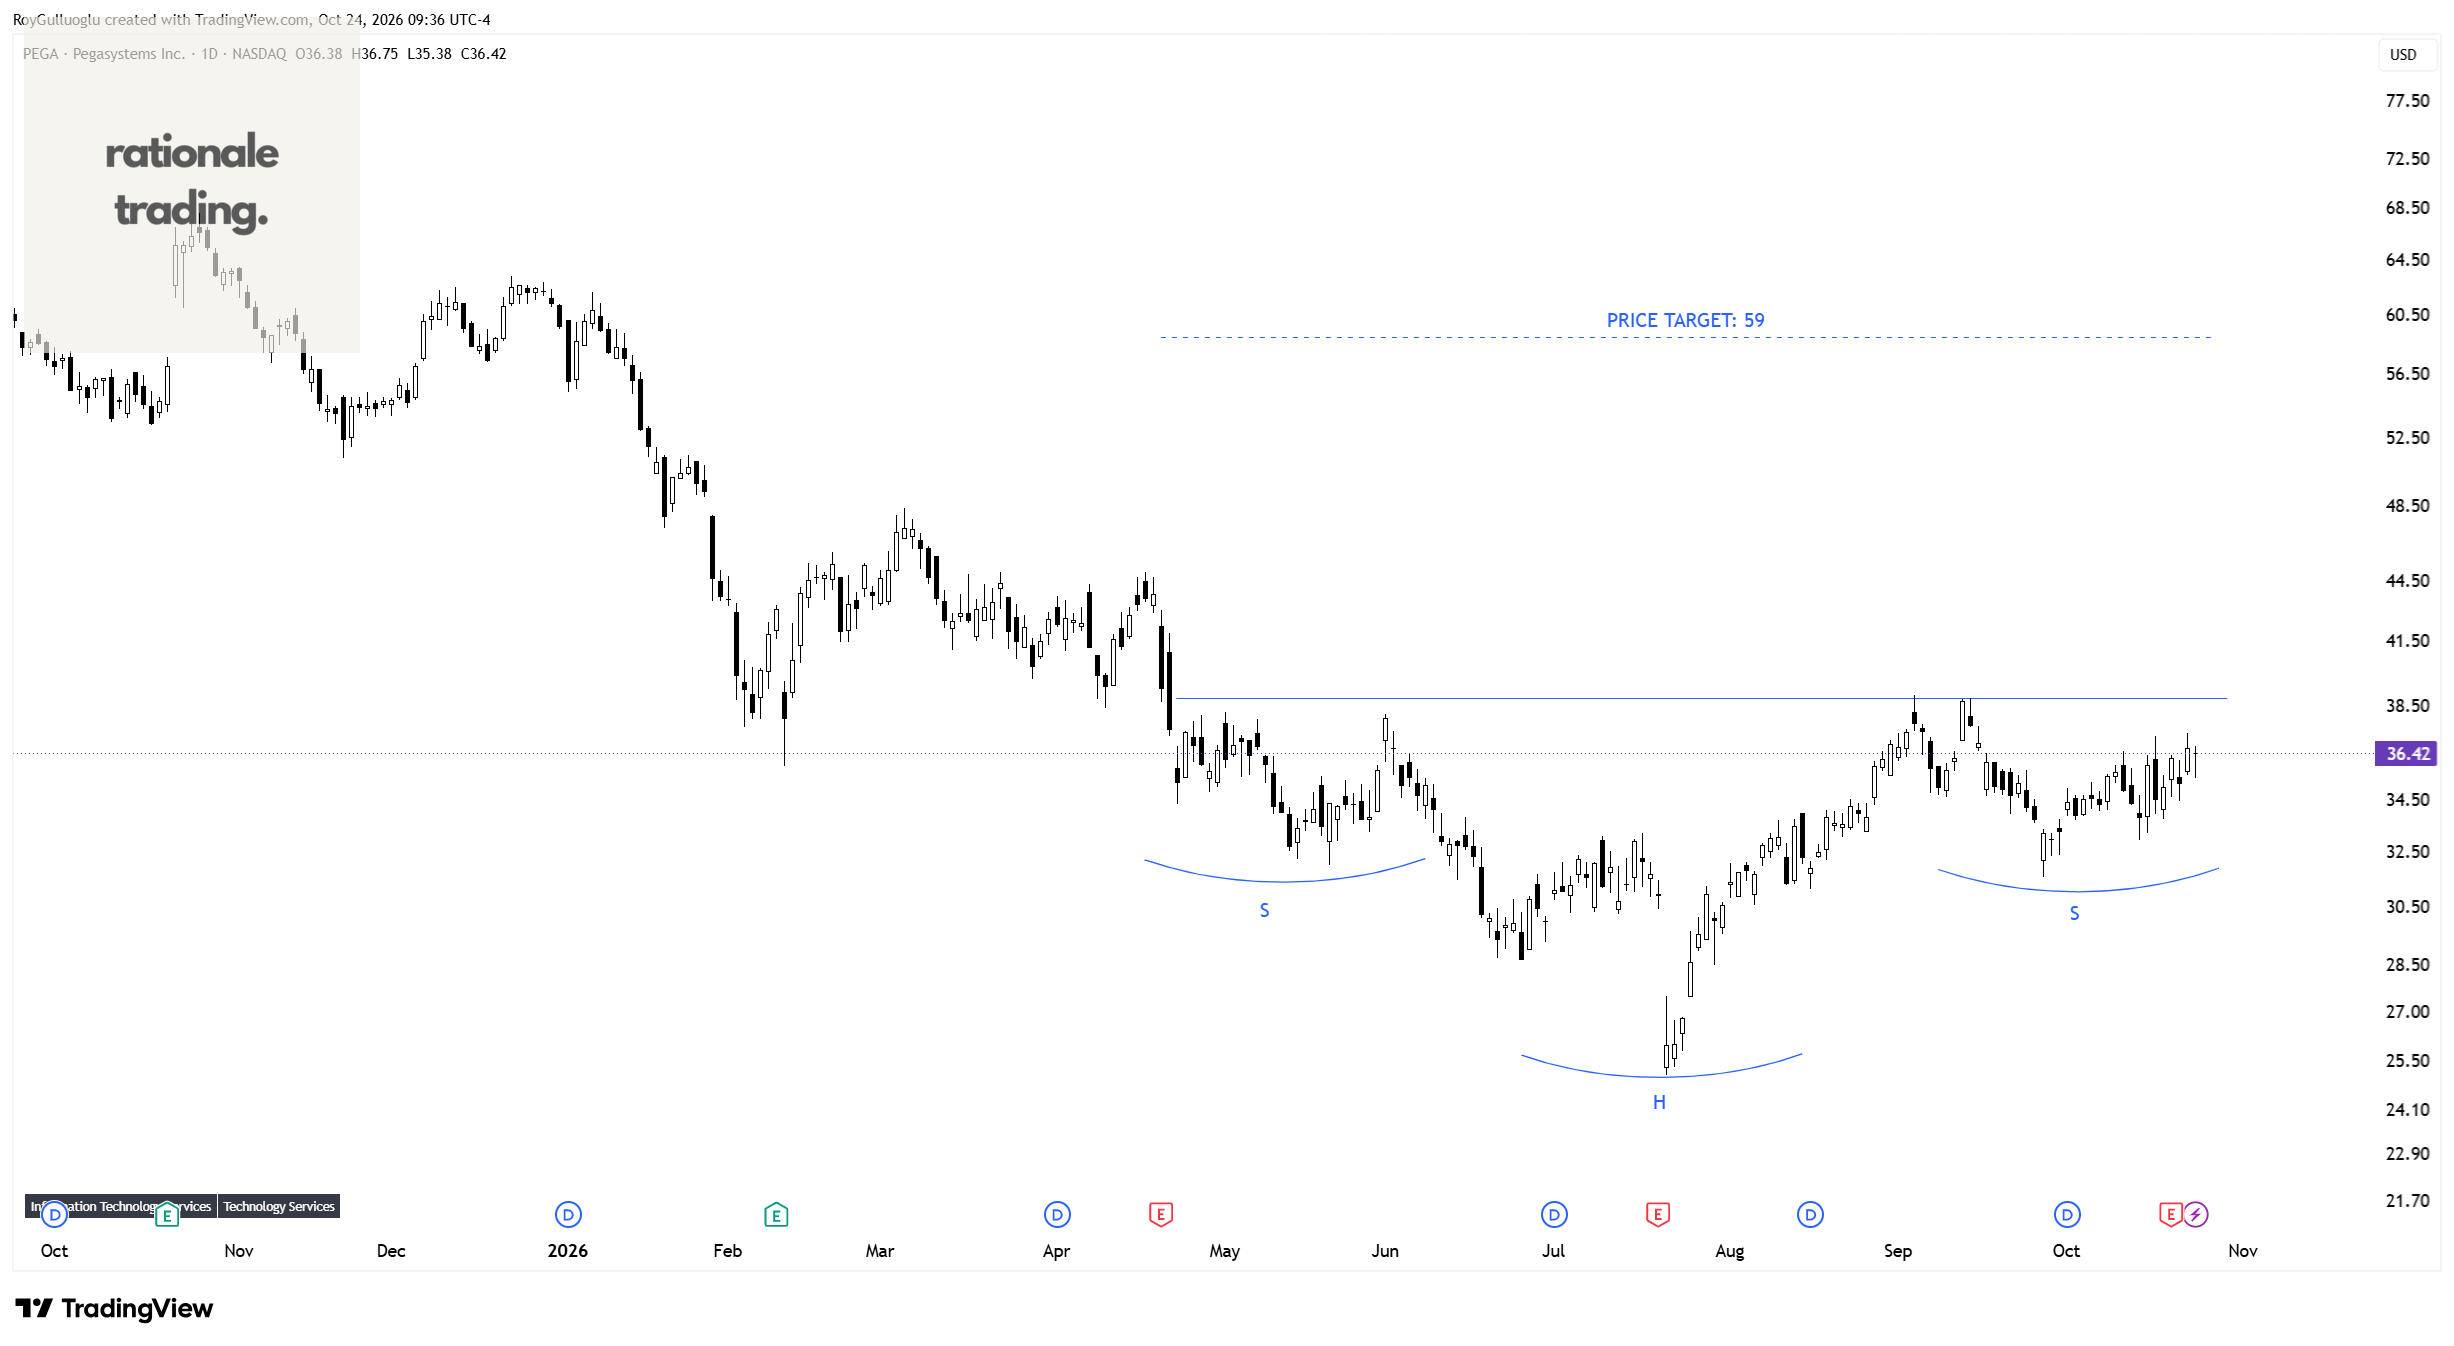
The above daily chart formed an approximately 4-month-long H&S bottom chart pattern as a bullish reversal after a downtrend.
Within this pattern, the horizontal boundary at 38.83 levels acts as a resistance.
A daily close above 40 levels would validate the breakout from the 4-month-long H&S bottom chart pattern.
Based on this chart pattern, the potential price target is 59 levels.
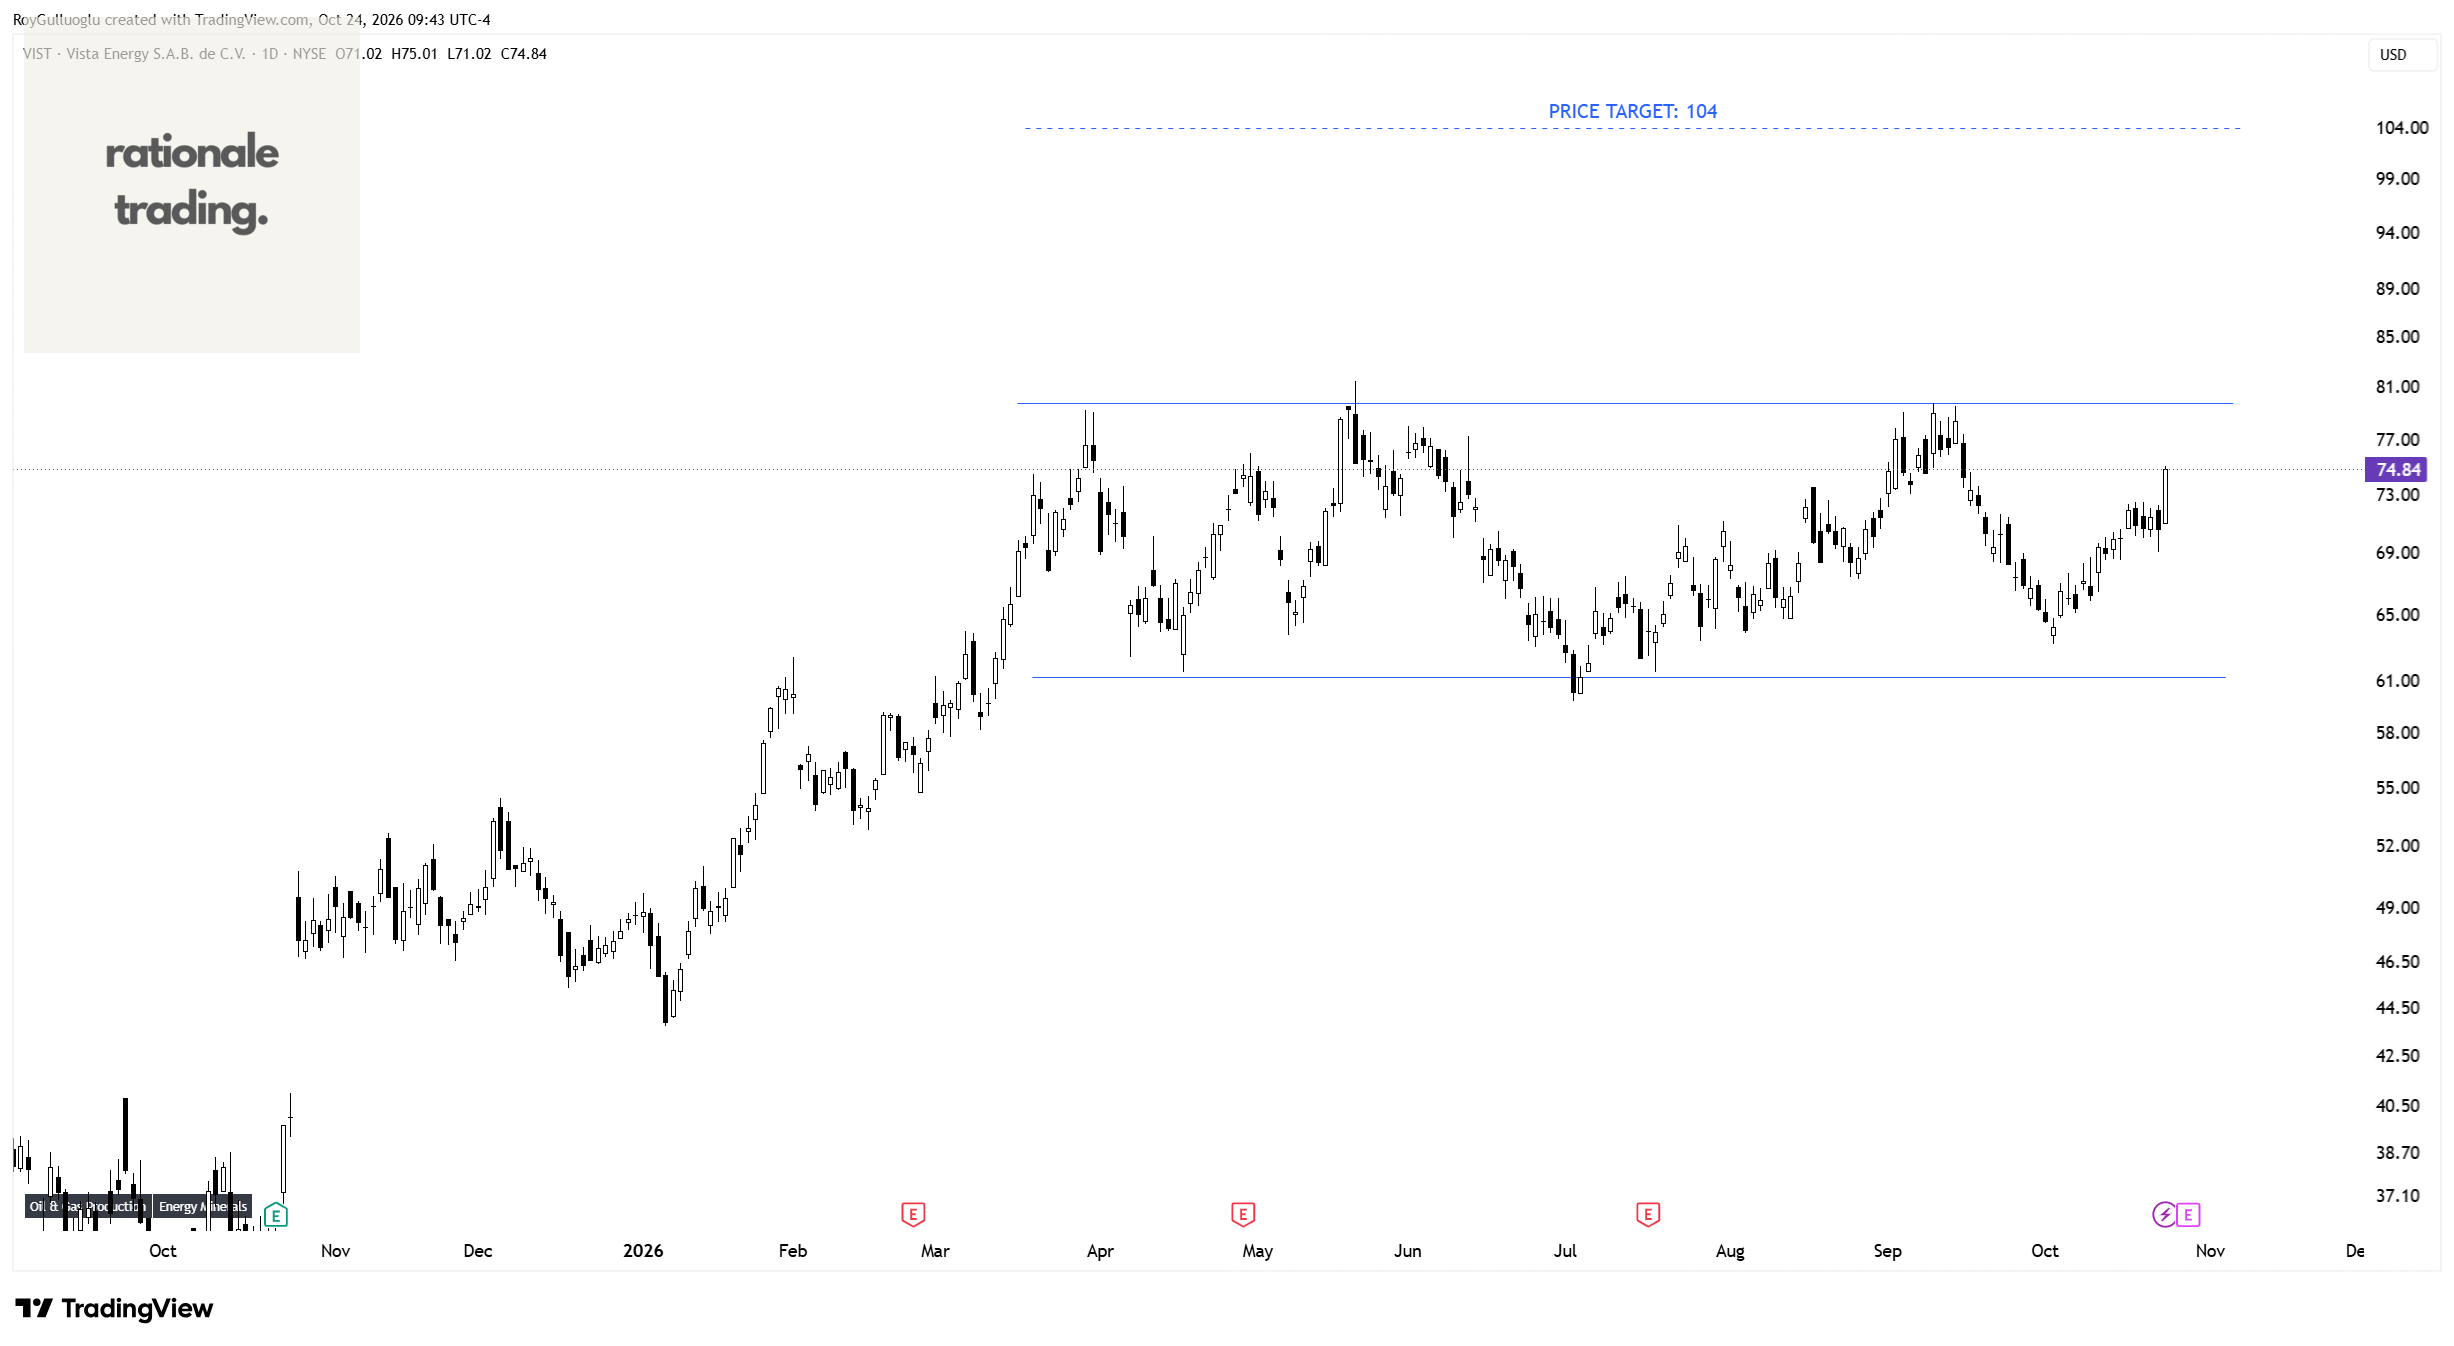
Vista Energy, S.A.B. de C.V.-(VIST/NYSE)-Long Idea
Vista Energy, S.A.B. de C.V., through its subsidiaries, engages in the exploration and production of oil and gas in Latin America.
The above daily chart formed an approximately 5-month-long rectangle chart pattern as a bullish continuation after an uptrend.
Within this pattern, the horizontal boundary at 79.77 levels acts as a resistance.
A daily close above 82.16 levels would validate the breakout from the 5-month-long rectangle chart pattern.
Based on this chart pattern, the potential price target is 104 levels.