


Franco-Nevada Corporation-(FNV/NYSE)-Long Idea
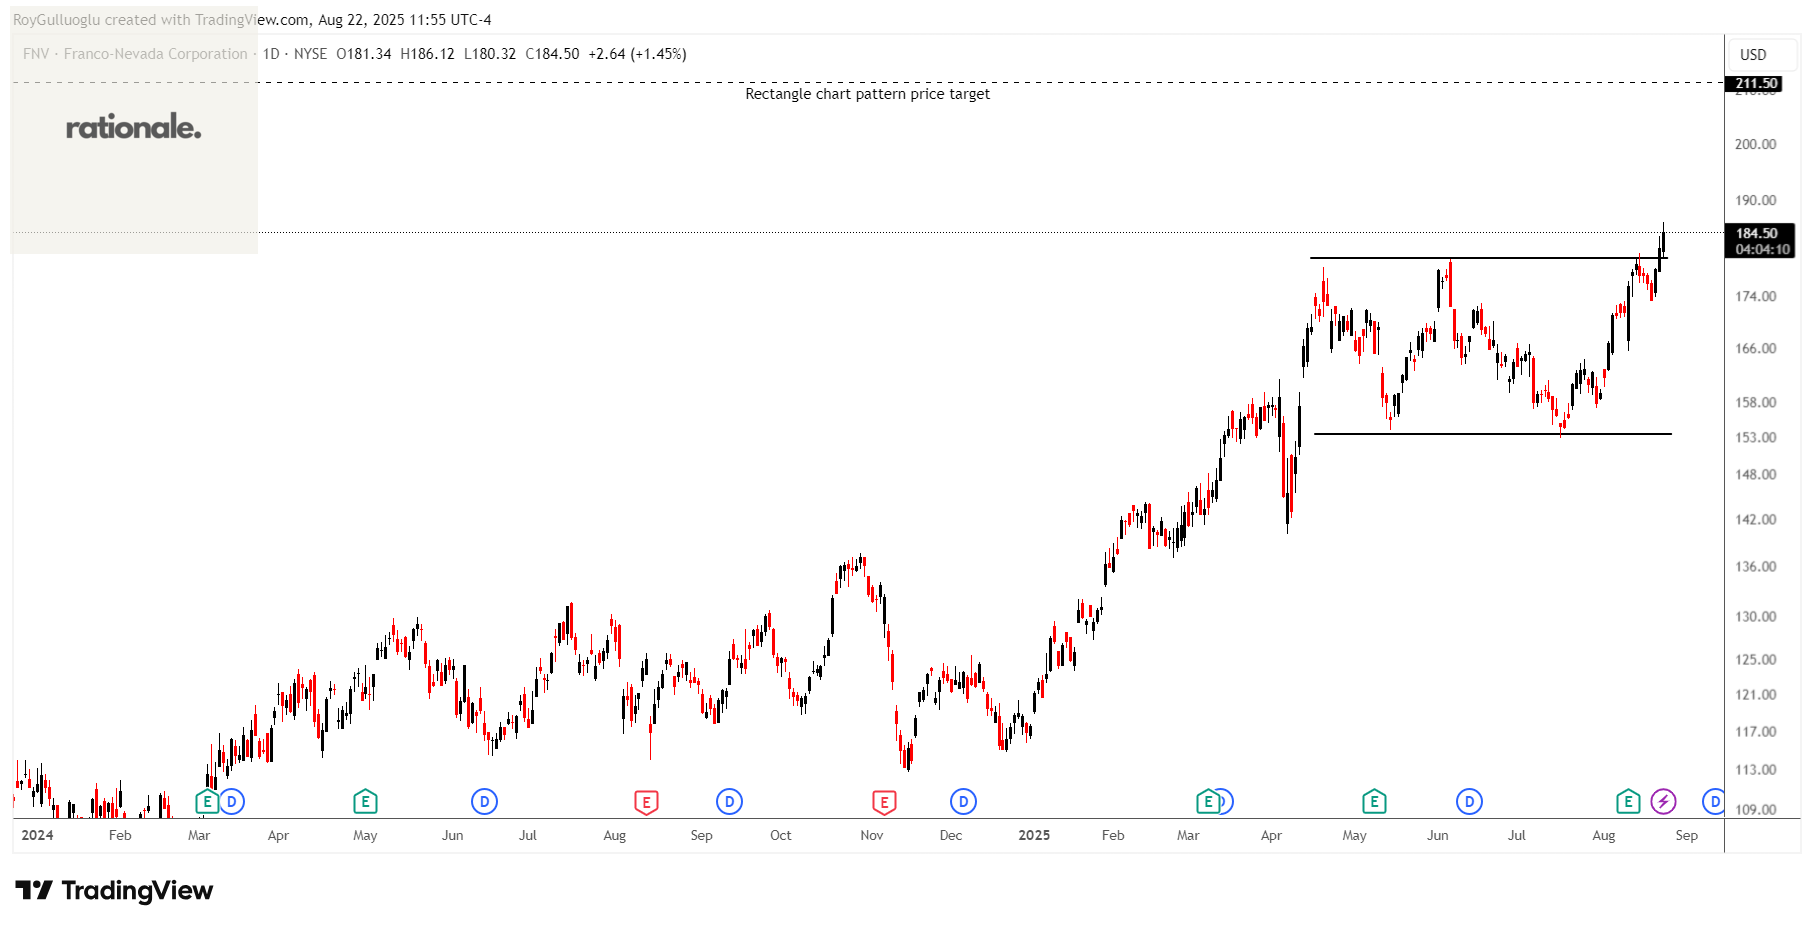
Franco-Nevada Corporation operates as a royalty and stream company focused on precious metals in South America, Central America, Mexico, the United States, Canada, Australia, Europe, and internationally
The above daily chart formed an approximately 3-month-long rectangle chart pattern as a bullish continuation after an uptrend.
The horizontal boundary at 180.15 levels acted as a resistance within this pattern.
A daily close above 185.5 levels validated the breakout from the 3-month-long rectangle chart pattern.
Based on this chart pattern, the potential price target is 211.5 levels.
FNV, classified under the "basic materials" sector, falls under the “Large Cap - Value” stock category.
Mission Produce, Inc.-(AVO/NASDAQ)-Long Idea
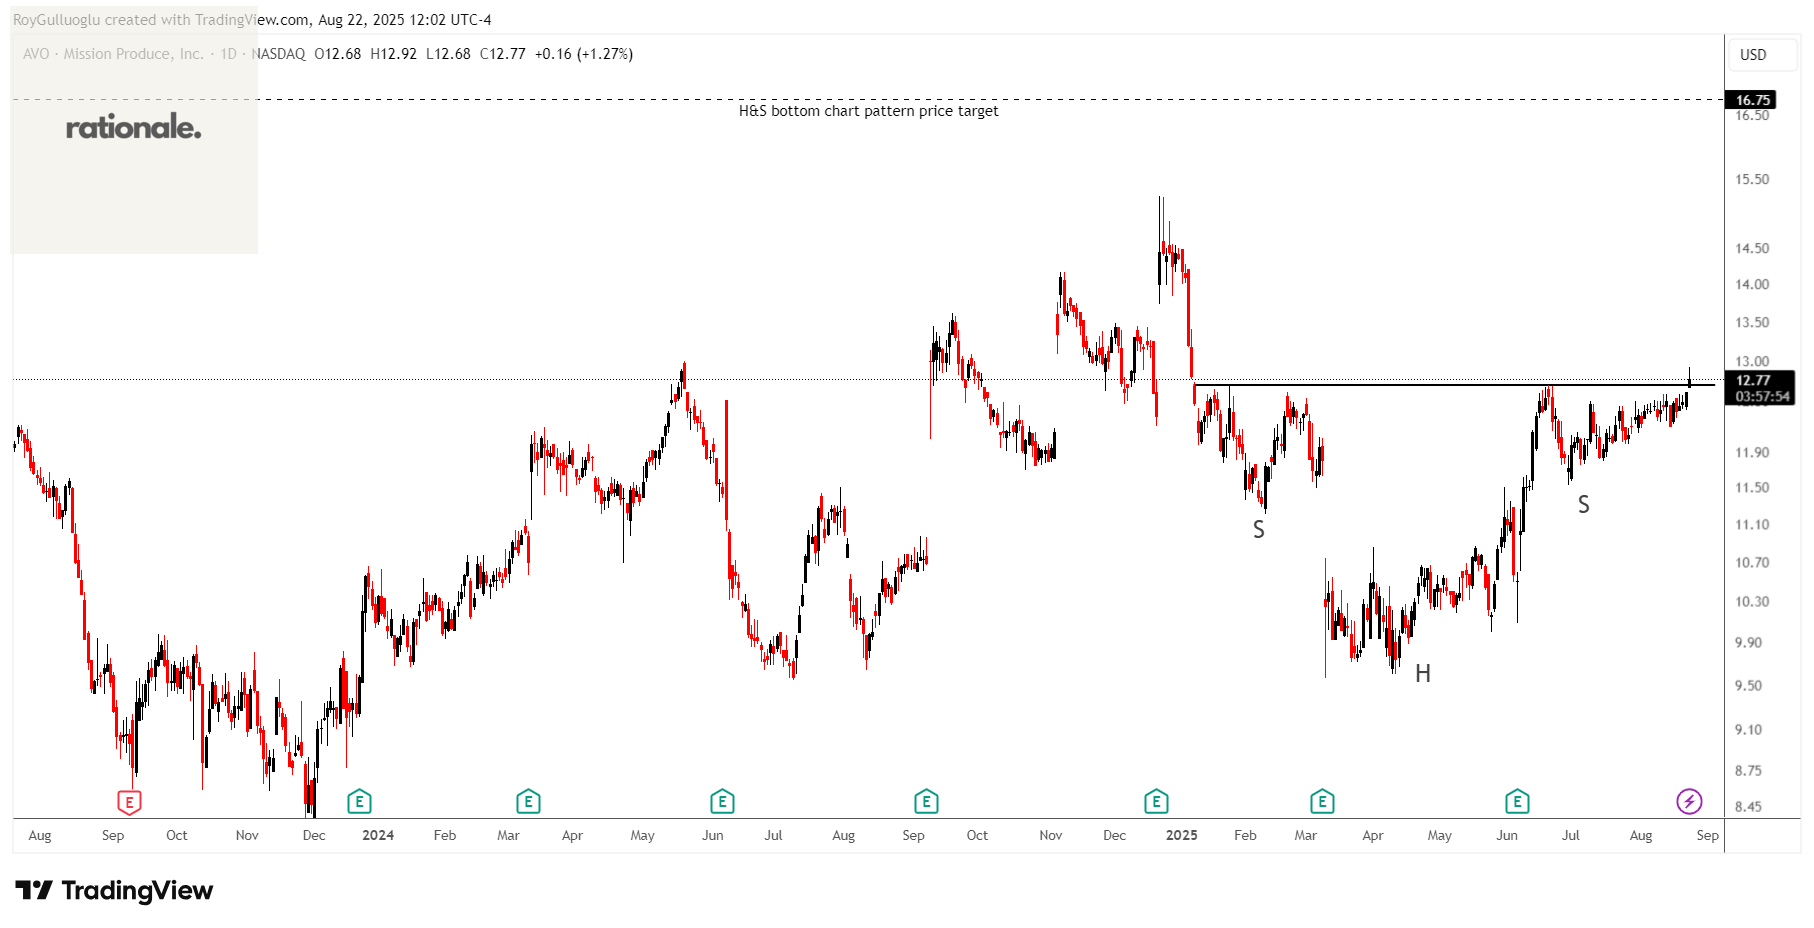
Mission Produce, Inc. engages in the sourcing, farming, packaging, marketing, and distribution of avocados, mangoes, and blueberries to food retailers, wholesalers, and foodservice customers in the United States and internationally.
The above daily chart formed an approximately 5-month-long H&S bottom chart pattern as a bullish reversal after a downtrend.
The horizontal boundary at 12.7 levels acts as a resistance within this pattern.
A daily close above 13 levels would validate the breakout from the 5-month-long H&S bottom chart pattern.
Based on this chart pattern, the potential price target is 16.75 levels.
AVO, classified under the "consumer defensive" sector, falls under the “Value Cap - Small” stock category.
Carter Bankshares, Inc.-(CARE/NASDAQ)-Long Idea
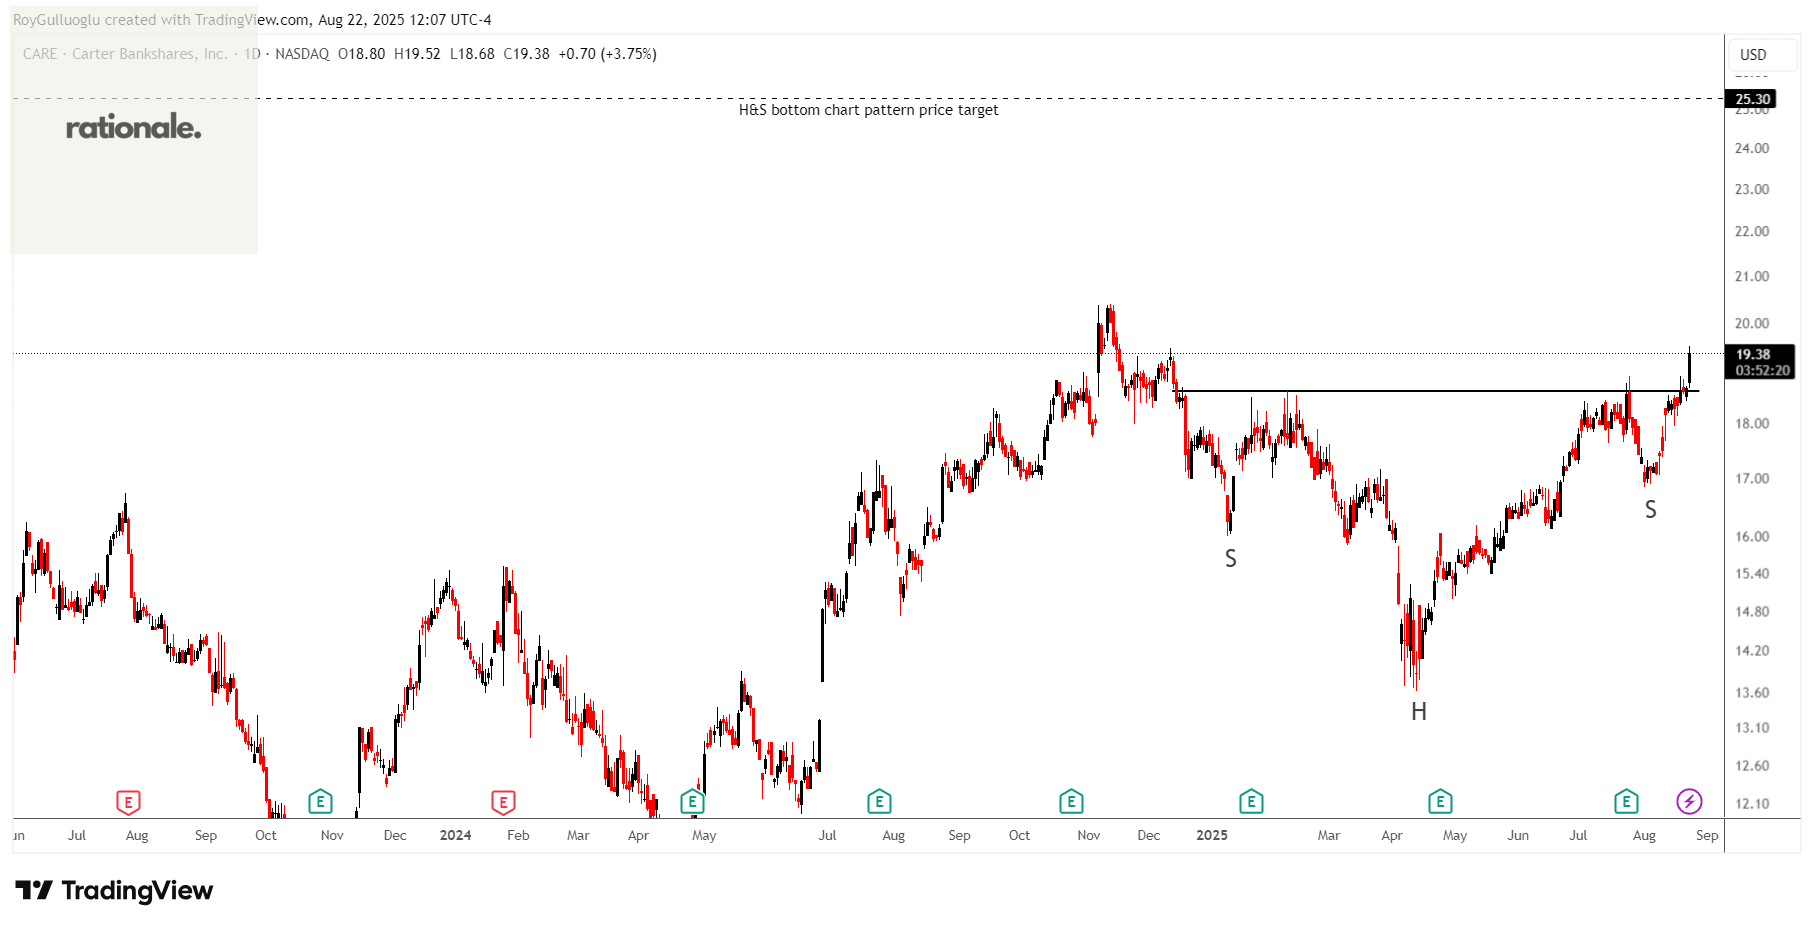
Carter Bankshares, Inc. operates as the bank holding company for Carter Bank & Trust that provides various retail and commercial banking products and insurance services in the United States.
The above daily chart formed an approximately 5-month-long H&S bottom chart pattern as a bullish reversal after a downtrend.
The horizontal boundary at 18.62 levels acted as a resistance within this pattern.
A daily close above 19.17 levels validated the breakout from the 5-month-long H&S bottom chart pattern.
Based on this chart pattern, the potential price target is 25.3 levels.
CARE, classified under the "financial services" sector, falls under the “Income Cap - Small” stock category.
Cirrus Logic, Inc.-(CRUS/NASDAQ)-Long Idea
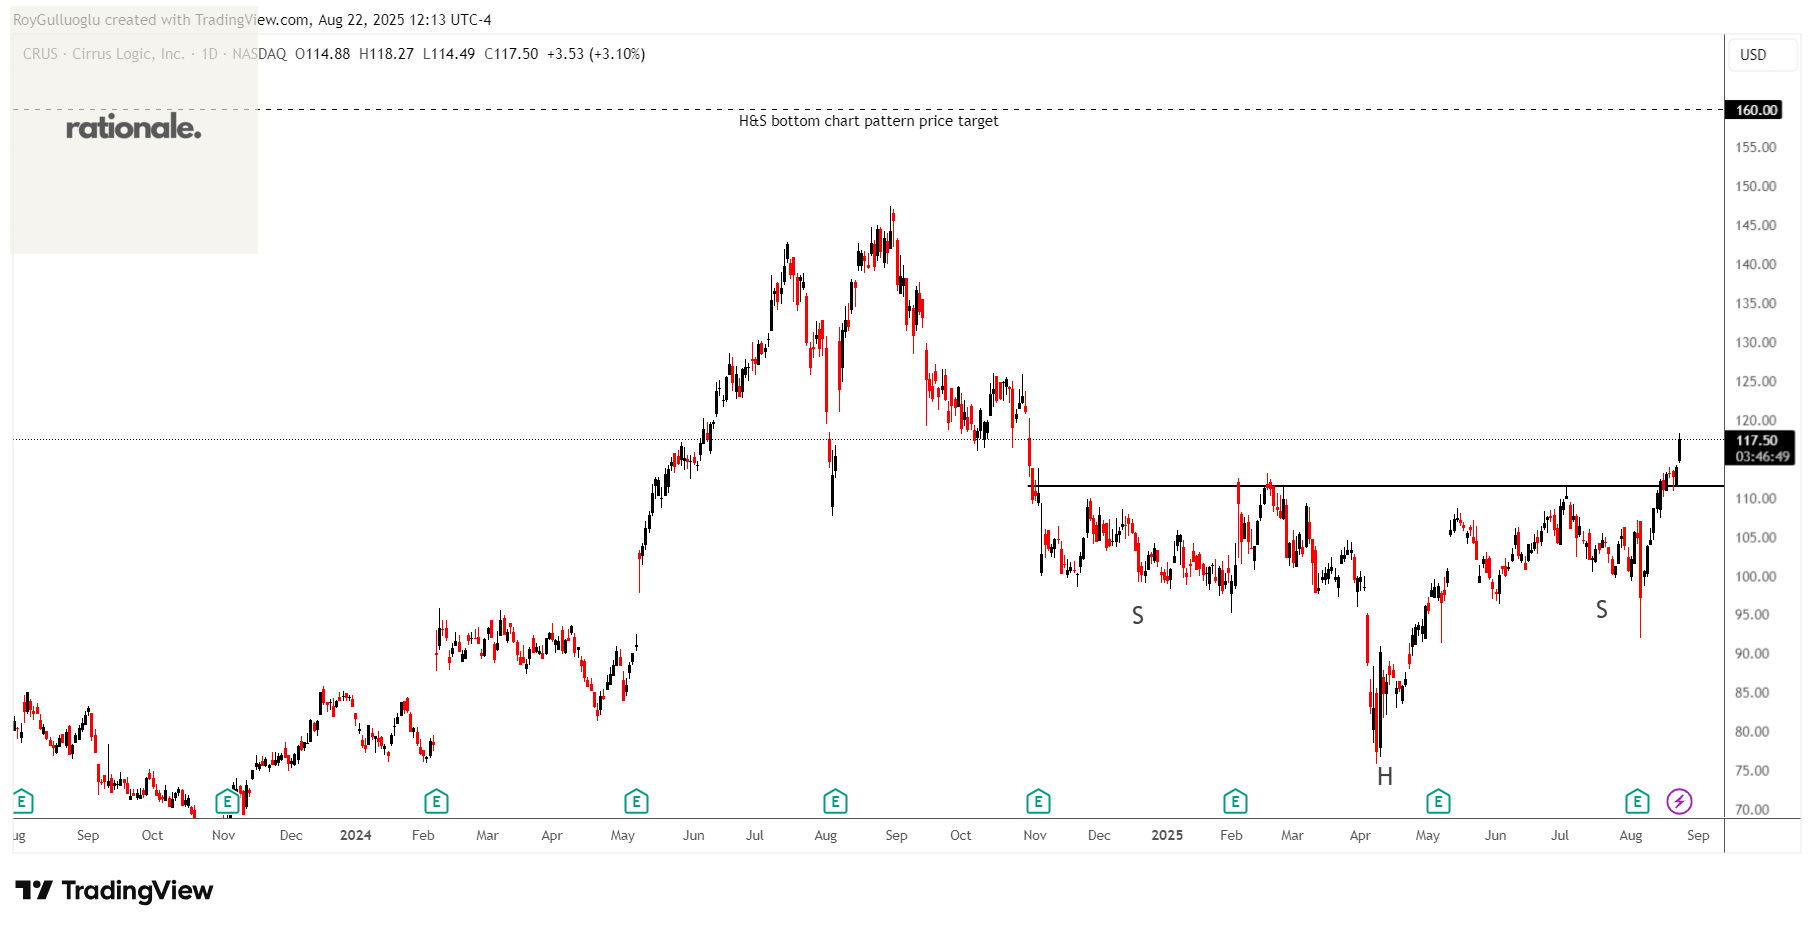
Cirrus Logic, Inc., a fabless semiconductor company, develops mixed-signal processing solutions and audio products in China, the United States, and internationally.
The above daily chart formed an approximately 6-month-long H&S bottom chart pattern as a bullish reversal after a downtrend.
The horizontal boundary at 111.48 levels acted as a resistance within this pattern.
A daily close above 114.8 levels validated the breakout from the 6-month-long H&S bottom chart pattern.
Based on this chart pattern, the potential price target is 160 levels.
CRUS, classified under the "technology" sector, falls under the “Growth Cap - Mid” stock category.