

Trade Ideas Equities
MTB(NYSE), CSGS(NASDAQ), JWEL(TSX), KEC(TSX), ENKAI(BIST), AKSA(BIST)

M&T Bank Corporation-(MTB/NYSE)-Long Idea
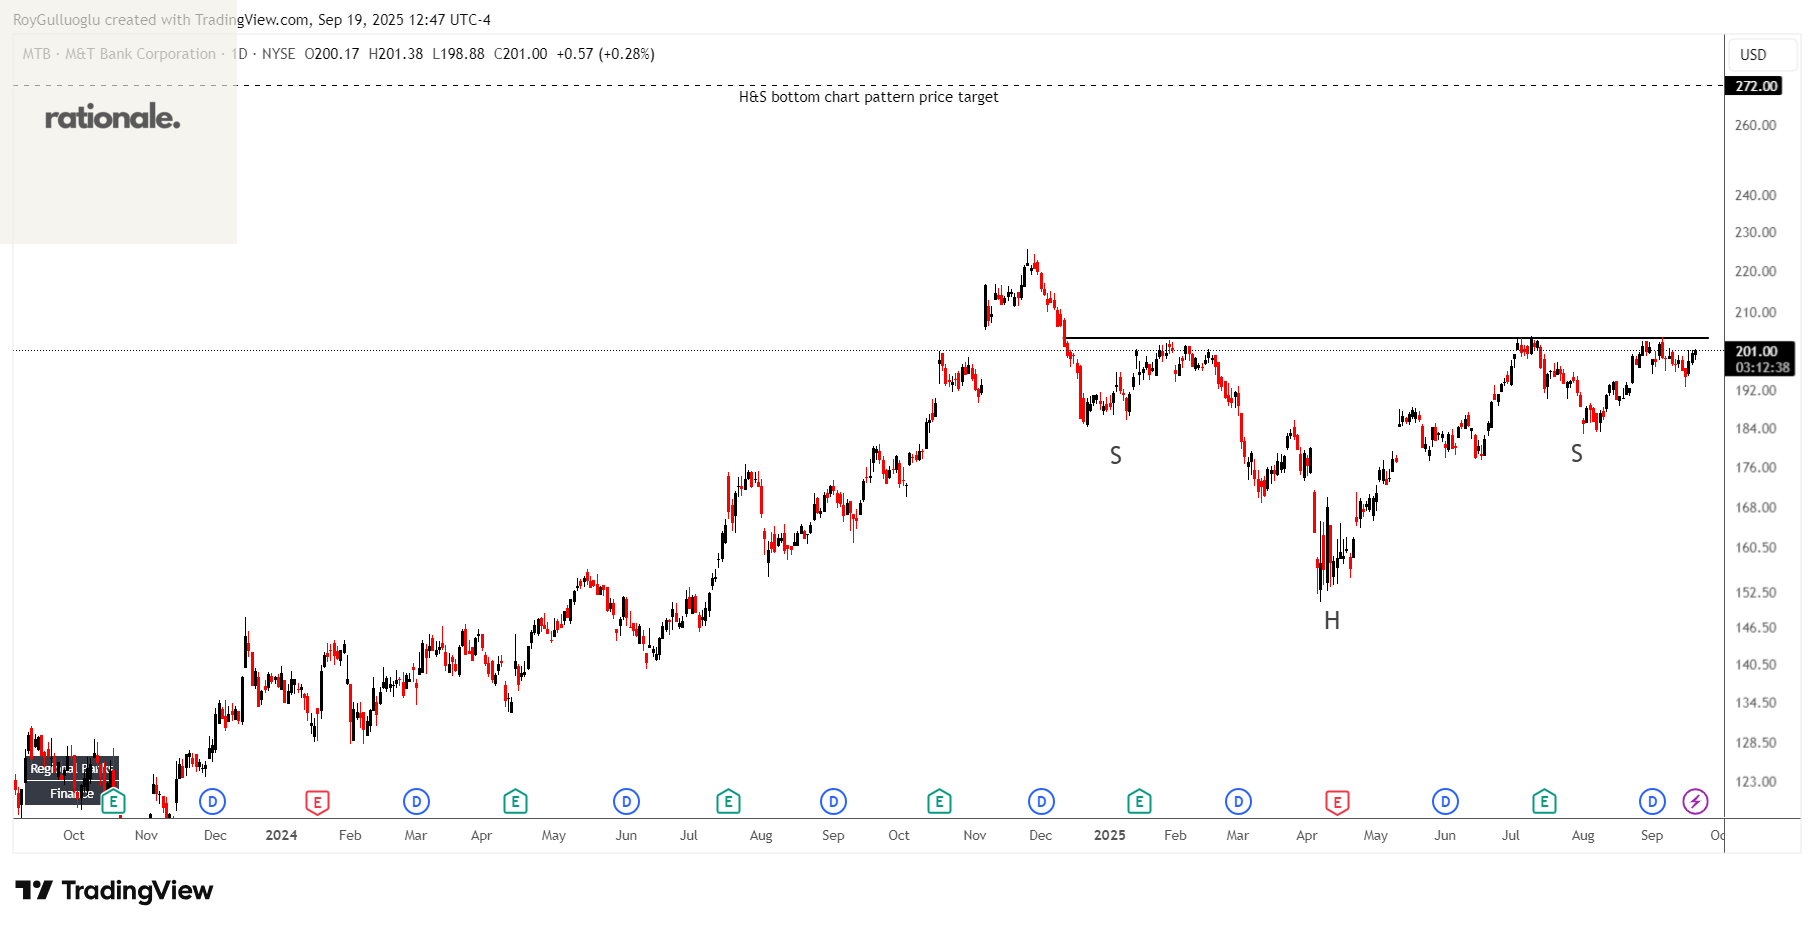
M&T Bank Corporation operates as a bank holding company for Manufacturers and Traders Trust Company and Wilmington Trust, National Association, that provides retail and commercial banking products and services in the United States.
The above daily chart formed an approximately 6-month-long H&S bottom chart pattern as a bullish reversal after a downtrend.
The horizontal boundary at 203.9 levels acts as a resistance within this pattern.
A daily close above 210 levels would validate the breakout from the 6-month-long H&S bottom chart pattern.
Based on this chart pattern, the potential price target is 272 levels.
MTB, classified under the "financial services" sector, falls under the “Large Cap - Income” stock category.
CSG Systems International, Inc.-(CSGS/NASDAQ)-Long Idea
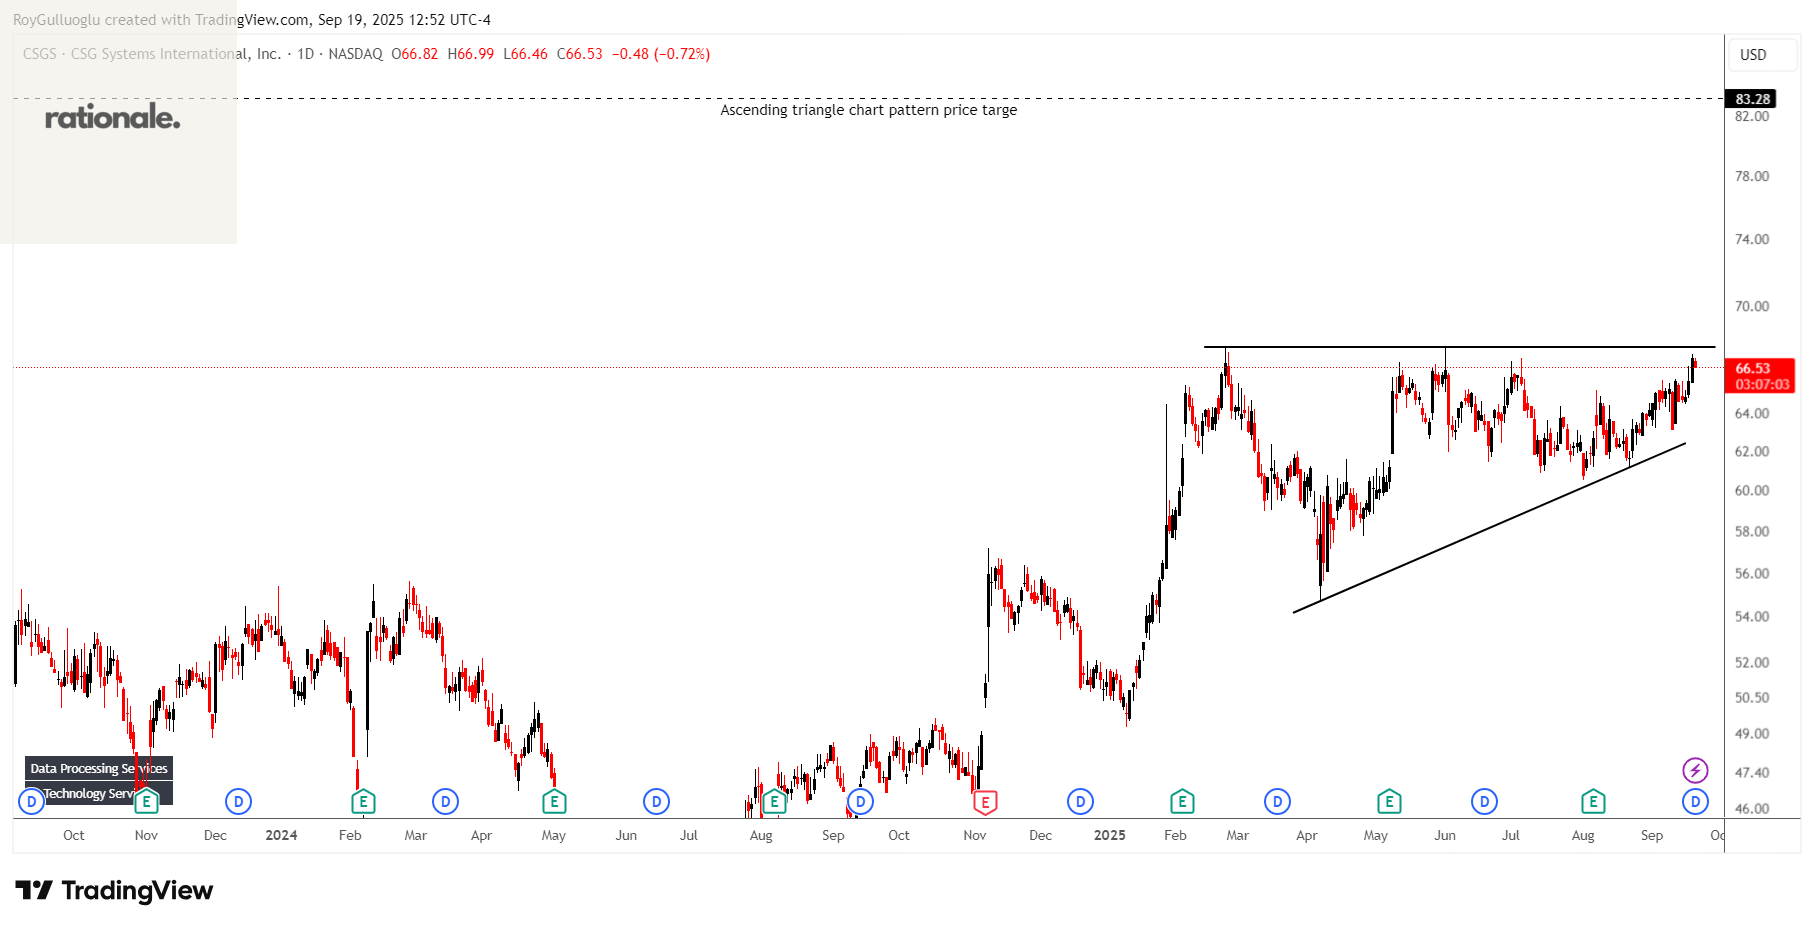
CSG Systems International, Inc., together with its subsidiaries, provides revenue management and digital monetization, customer experience, and payment solutions primarily to the communications industry in the Americas, Europe, the Middle East, Africa, and the Asia Pacific.
The above weekly chart formed an approximately 5-month-long ascending triangle chart pattern as a bullish continuation after an uptrend.
The horizontal boundary at 67.6 levels acts as a resistance within this pattern.
A daily close above 69.6 levels would validate the breakout from the 5-month-long ascending triangle chart pattern.
Based on this chart pattern, the potential price target is 83.28 levels.
CSGS, classified under the "technology" sector, falls under the “Small Cap - Growth” stock category.
Jamieson Wellness Inc. -(JWEL/TSX)-Long Idea
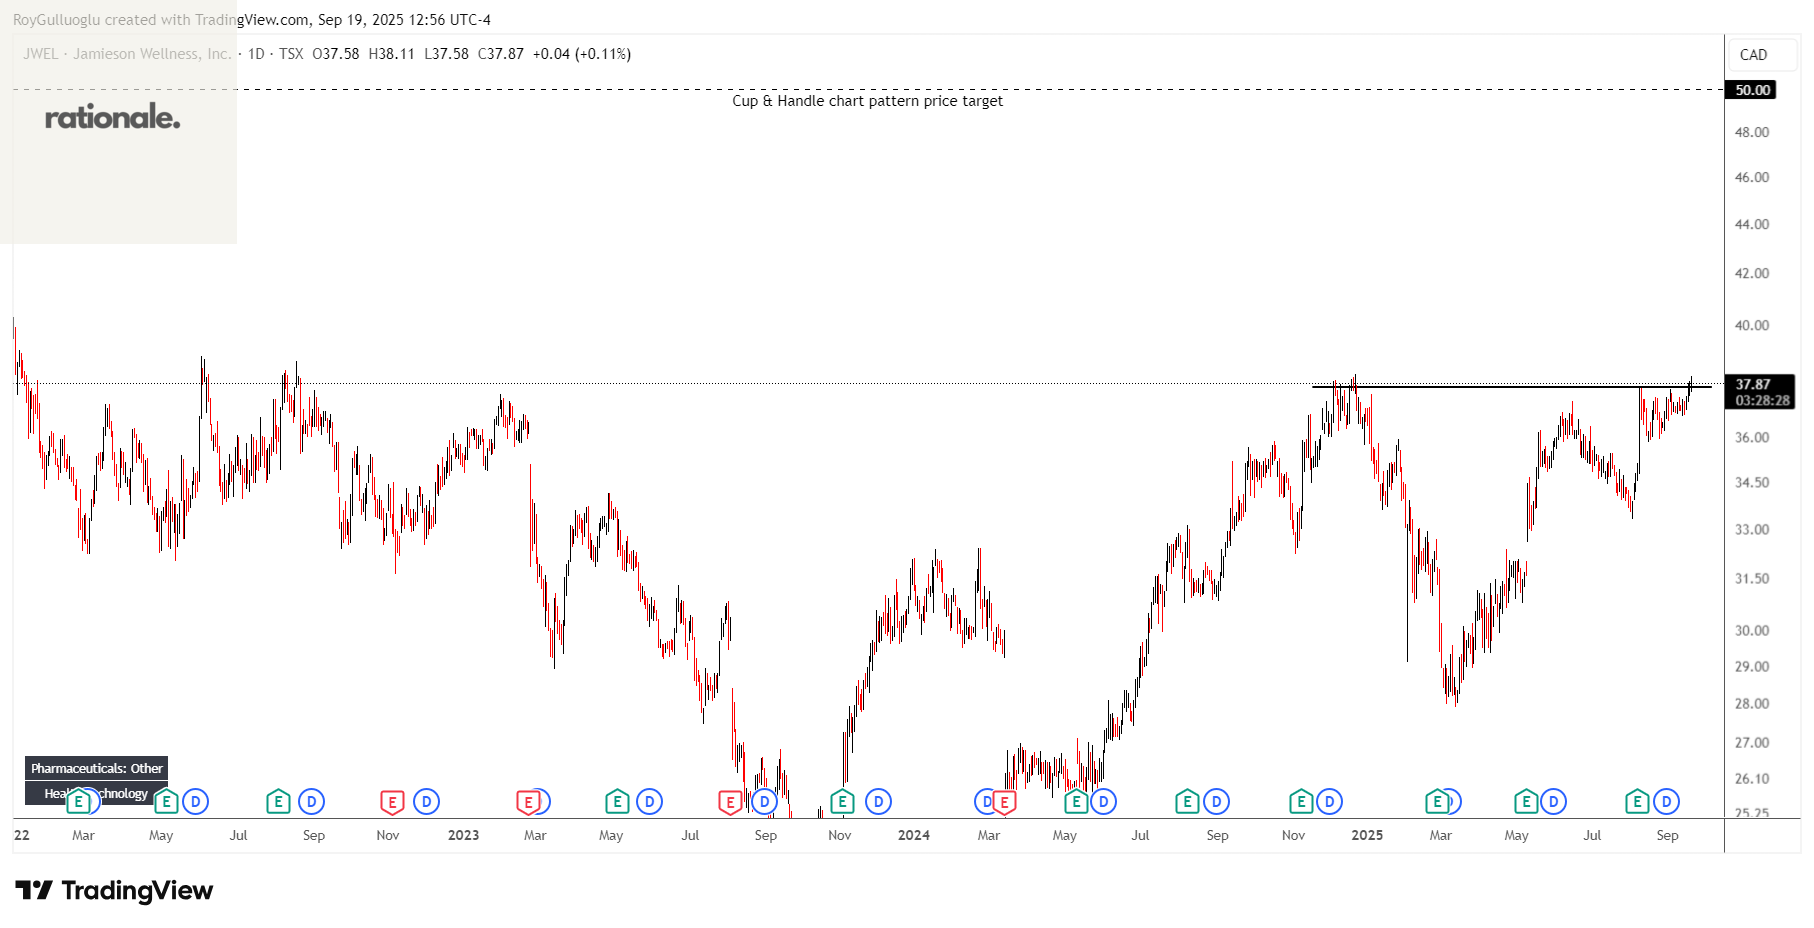
Jamieson Wellness Inc., together with its subsidiaries, develops, manufactures, distributes, markets, and sells the natural health products for human in Canada, the United States, China, and internationally.
The above daily chart formed an approximately 6-month-long Cup & Handle chart pattern as a bullish continuation after an uptrend.
The horizontal boundary at 37.72 levels acts as a resistance within this pattern.
A daily close above 38.85levels would validate the breakout from the 6-month-long Cup & Handle chart pattern.
Based on this chart pattern, the potential price target is 50 levels.
JWEL, classified under the "consumer defensive" sector, falls under the “Small Cap - Value” stock category.
Kiwetinohk Energy Corp. -(KEC/TSX)-Long Idea
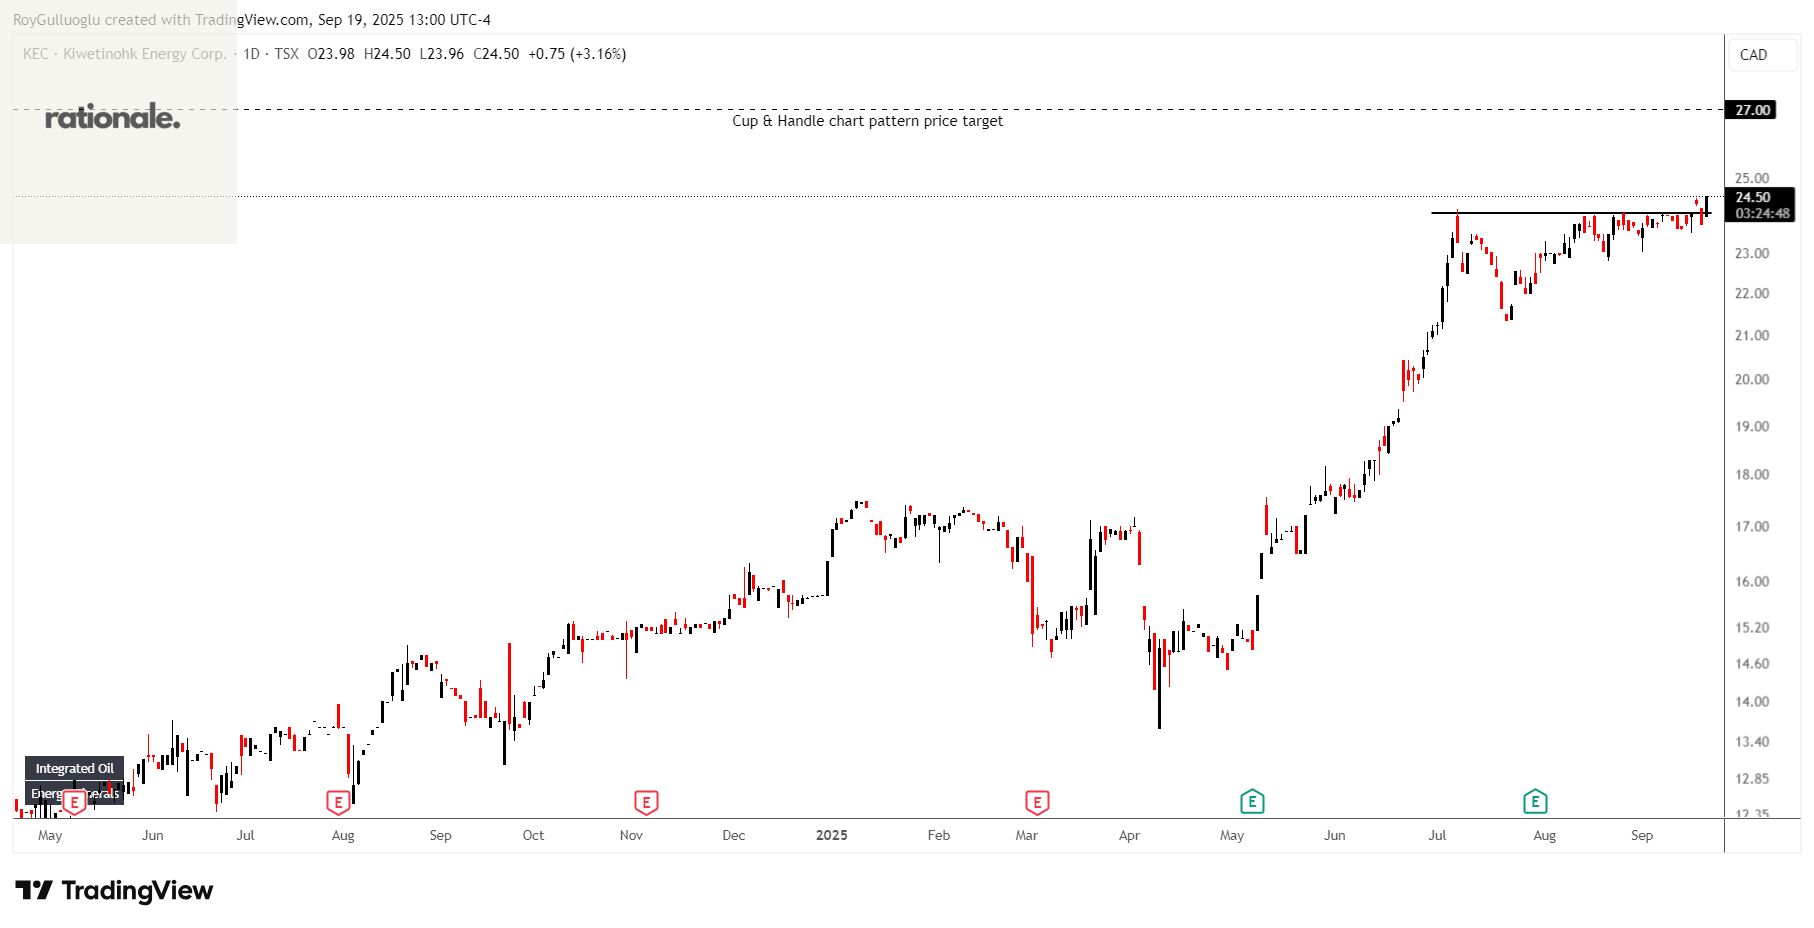
Kiwetinohk Energy Corp. produces of natural gas natural gas liquids, oil, and condensate in Canada.
The above daily chart formed an approximately 2-month-long Cup & Handle chart pattern as a bullish continuation after an uptrend.
The horizontal boundary at 24 levels acted as a resistance within this pattern.
A daily close above 24.7 levels validated the breakout from the 2-month-long Cup & Handle chart pattern.
Based on this chart pattern, the potential price target is 27 levels.
KEC, classified under the "energy" sector, falls under the “Small Cap - Income” stock category.
Aksa Enerji Üretim A.S.-(AKSEN/BIST)-Long Idea
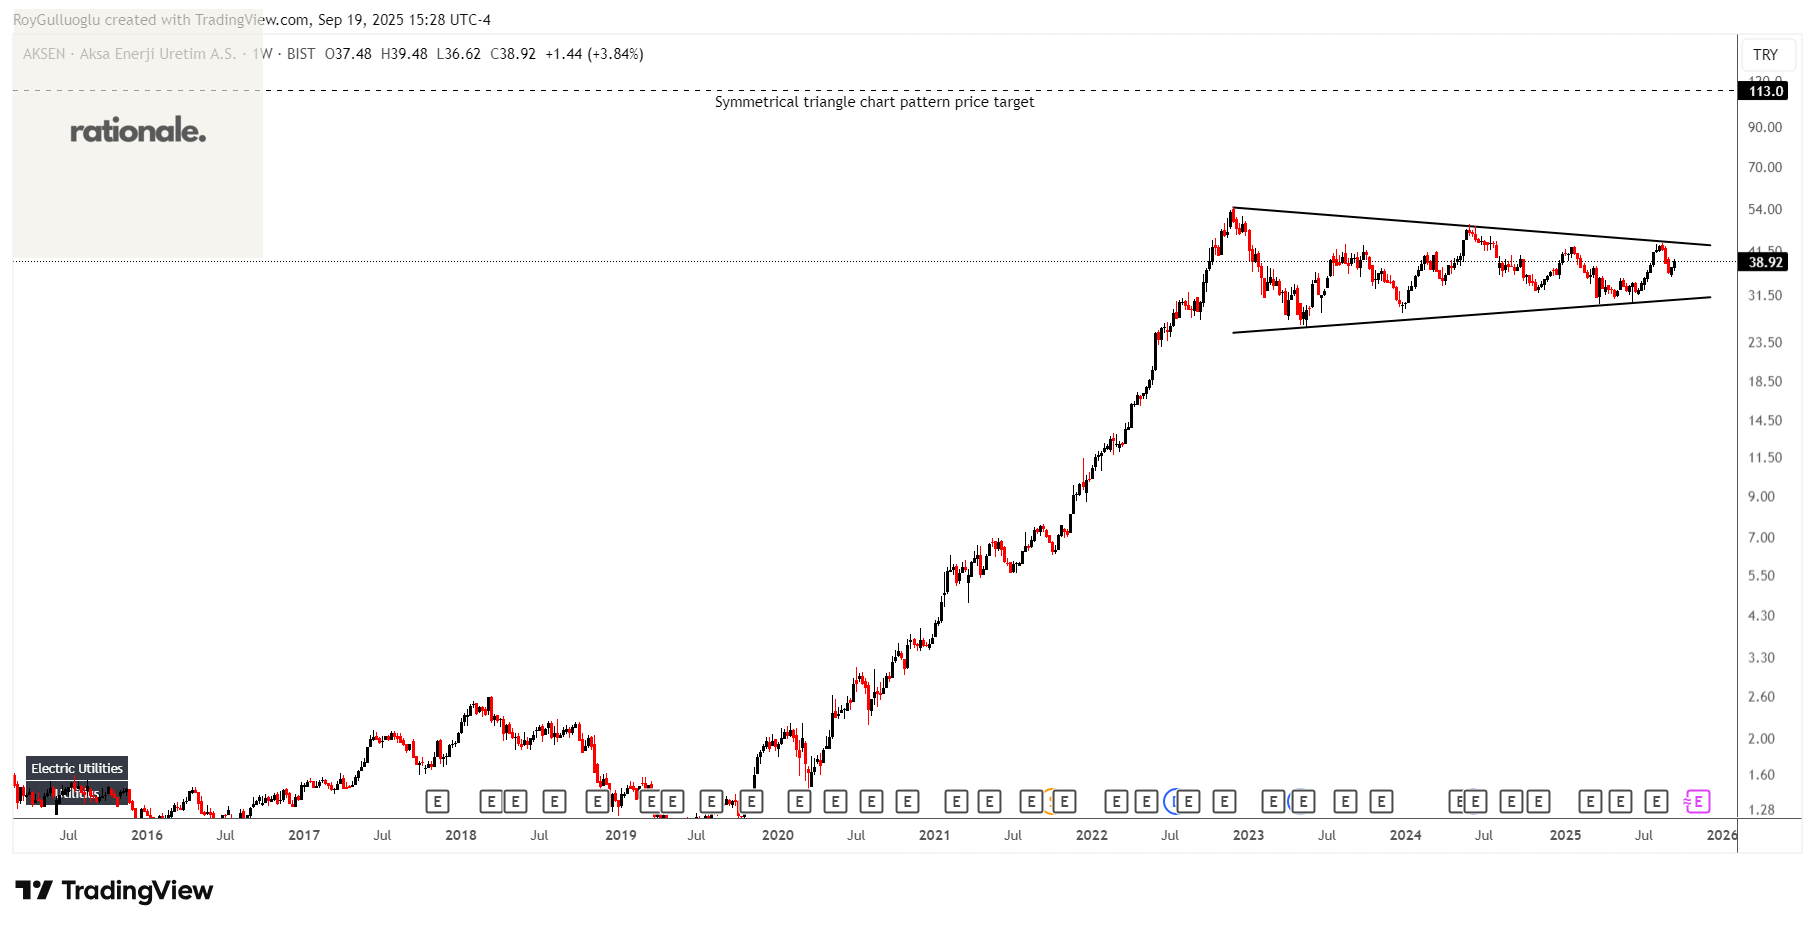
Aksa Enerji Üretim A.S., an independent power producer, produces and sells electricity in Turkey, Asia, and Africa.
The above weekly chart formed an approximately 35-month-long ascending triangle chart pattern as a bullish continuation after an uptrend.
A daily close above 45 levels would validate the breakout from the 8-month-long rectangle chart pattern.
Based on this chart pattern, the potential price target is 113 levels.
Enka Insaat ve Sanayi A.S.-(ENKAI/BIST)-Long Idea
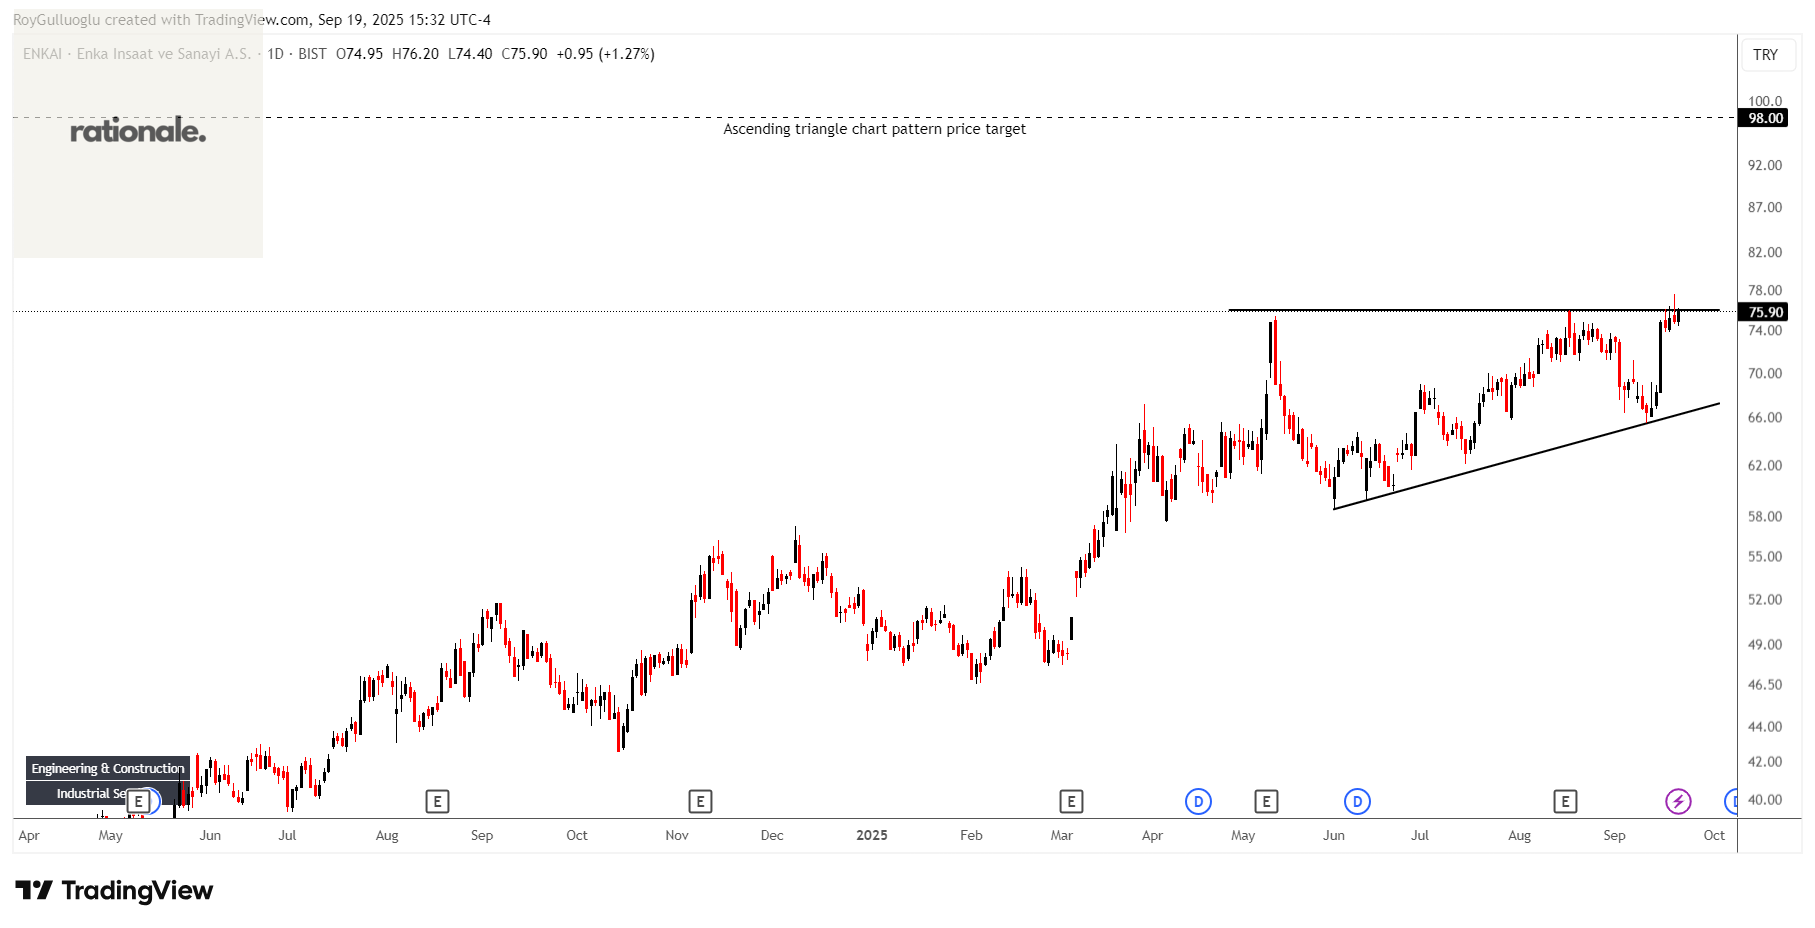
Enka Insaat ve Sanayi A.S., together with its subsidiaries, operates as a construction company in Turkey, Russia, Kazakhstan, Georgia, Europe, and internationally.
The above daily chart formed an approximately 3-month-long ascending triangle chart pattern as a bullish continuation after an uptrend.
The horizontal boundary at 76 levels acts as a resistance within this pattern.
A daily close above 78.28 levels would validate the breakout from the 3-month-long ascending triangle chart pattern.
Based on this chart pattern, the potential price target is 98 levels.
Teşekkürler Roy