


New setups
Sprout Social, Inc.-(SPT/NASDAQ)-Long Idea
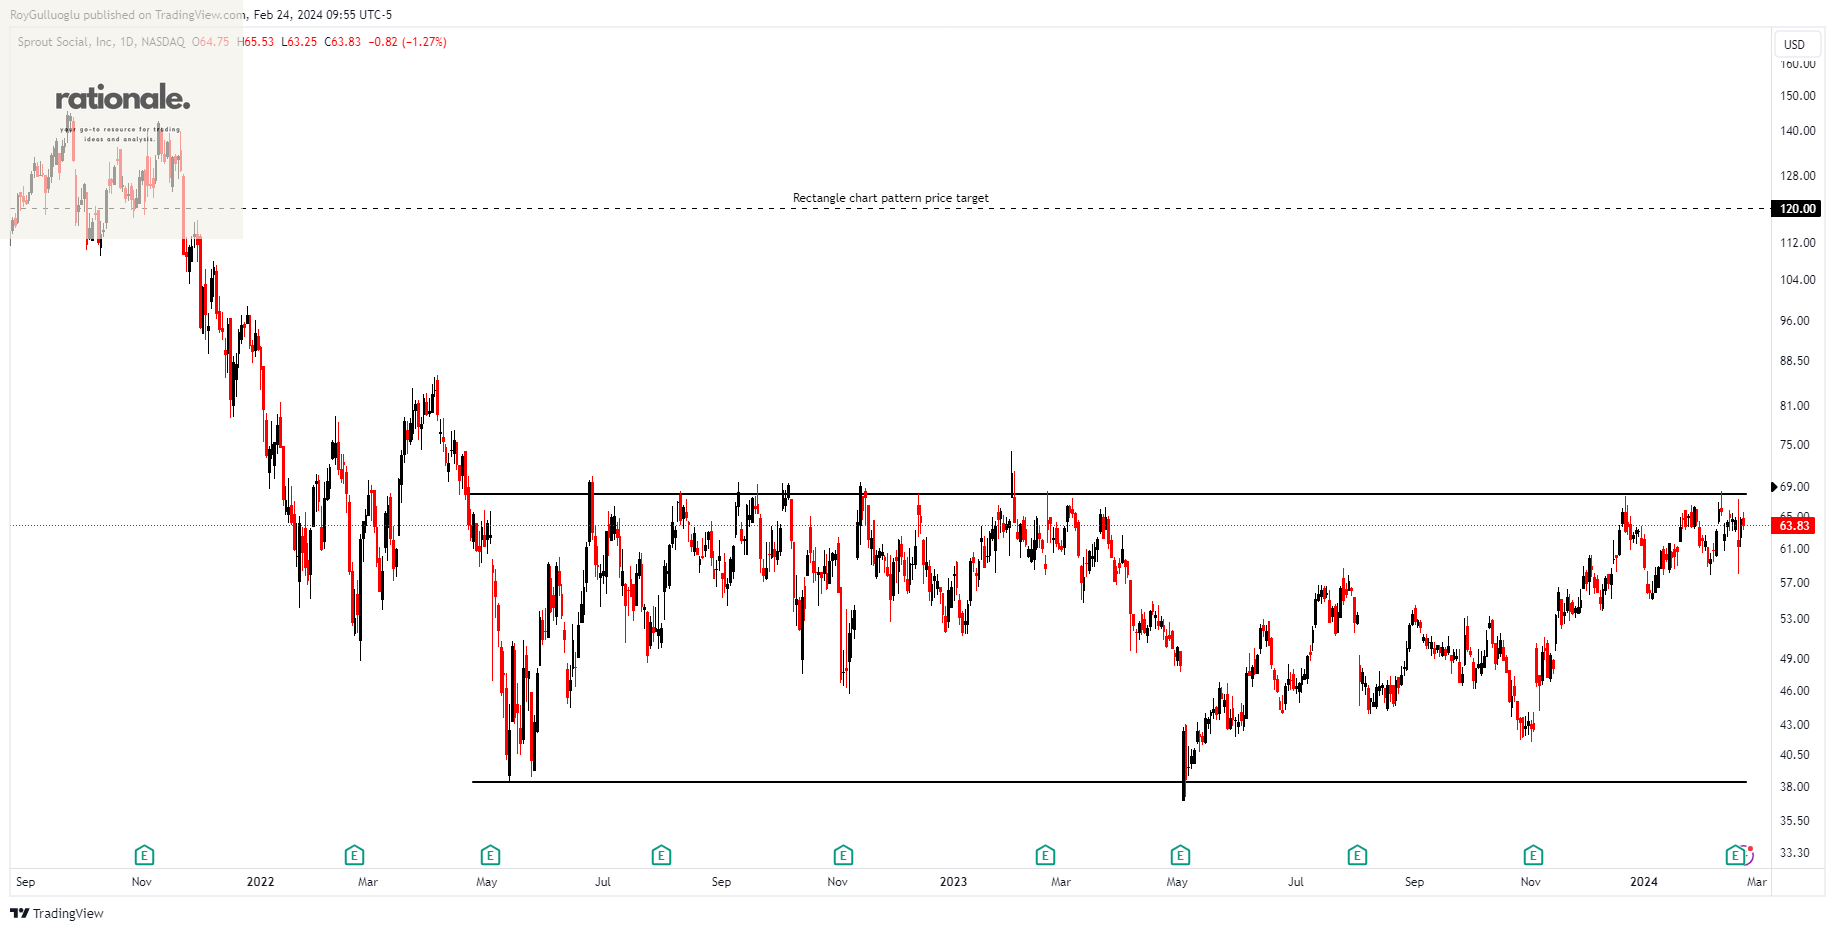
Sprout Social, Inc. is a company that creates, builds, and manages an online platform for social media management across various regions such as the Americas, Europe, the Middle East, Africa, and the Asia Pacific. The company offers cloud-based software that integrates social messaging, data, and workflows into a cohesive system for recording, intelligence, and taking action.
The above daily chart formed an approximately 14-month-long rectangle chart pattern as a bullish reversal after a downtrend.
The horizontal boundary at 68 levels acts as a resistance within this pattern.
A daily close above 70 levels would validate the breakout from the 14-month-long rectangle chart pattern.
Based on this chart pattern, the potential price target is 120 levels.
SPT, classified under the "technology" sector, falls under the “Mid Cap - Growth” stock category.
Bentley Systems, Incorporated-(BSY/NASDAQ)-Long Idea
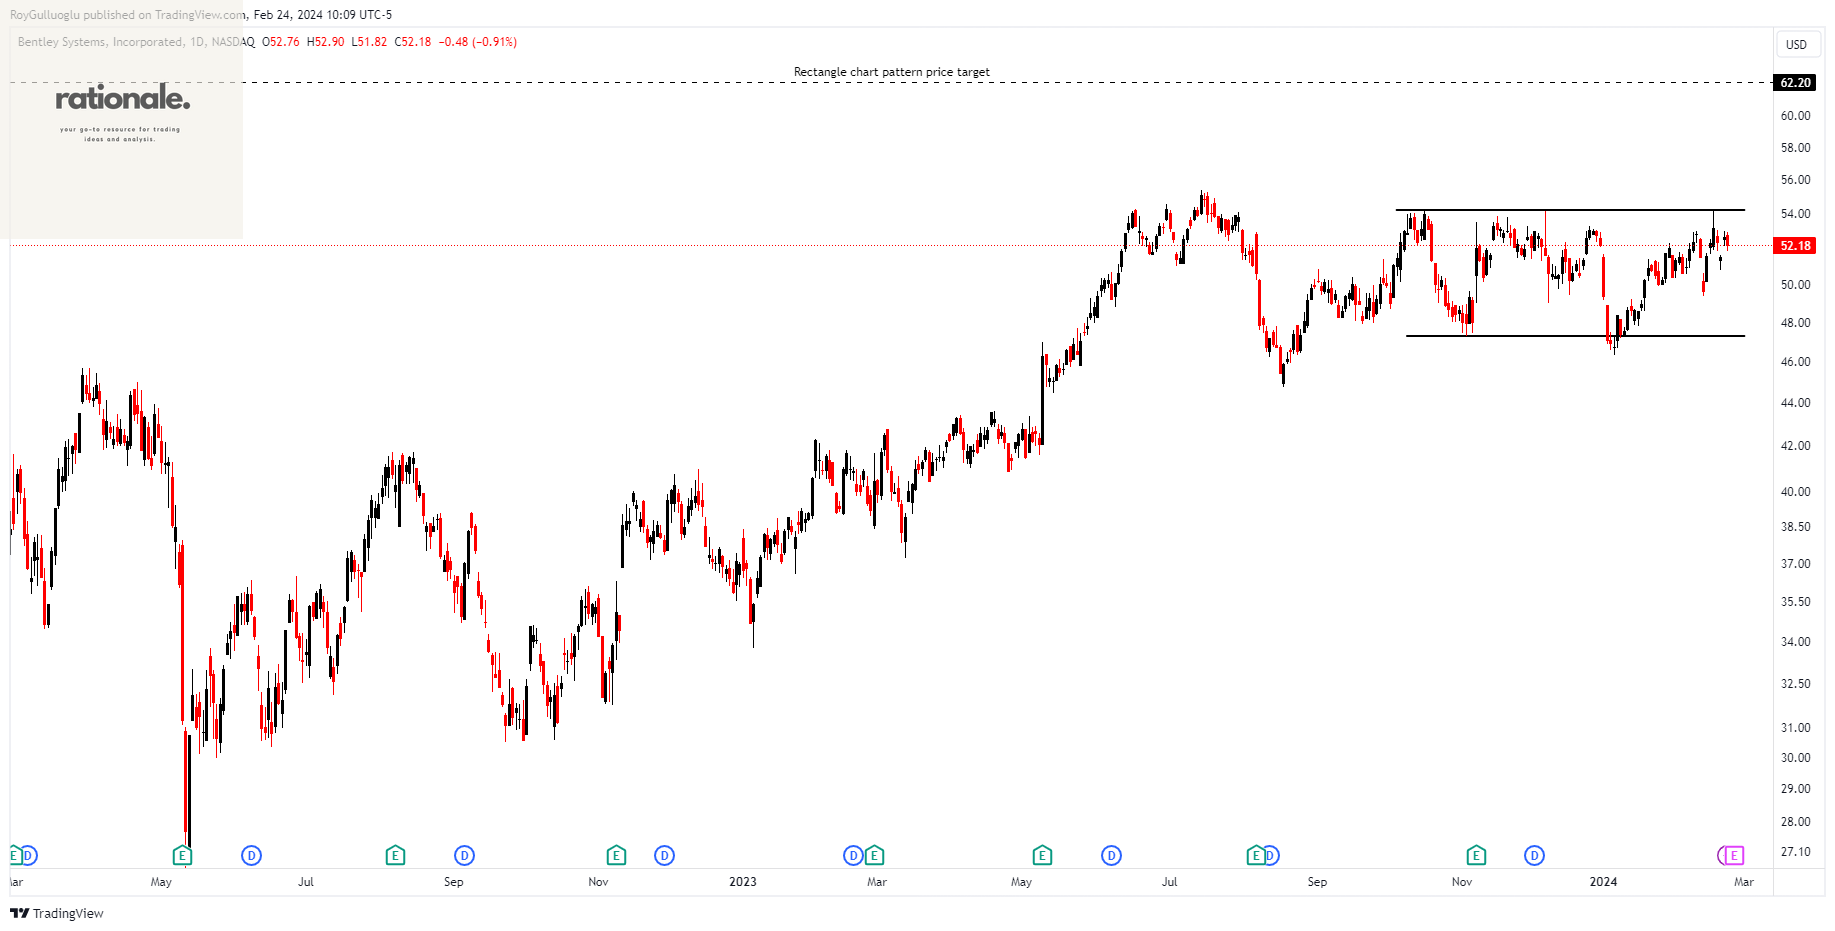
Bentley Systems, Incorporated, and its subsidiaries deliver software solutions for infrastructure engineering across the Americas, Europe, the Middle East, Africa, and the Asia-Pacific region.
The above daily chart formed an approximately 3-month-long rectangle chart pattern as a bullish continuation after an uptrend.
The horizontal boundary at 54.17 levels acts as a resistance within this pattern.
A daily close above 55.79 levels would validate the breakout from the 3-month-long rectangle chart pattern.
Based on this chart pattern, the potential price target is 62.2 levels.
BSY, classified under the "technology" sector, falls under the “Large Cap - Growth” stock category.
Hess Corporation-(HES/NYSE)-Long Idea
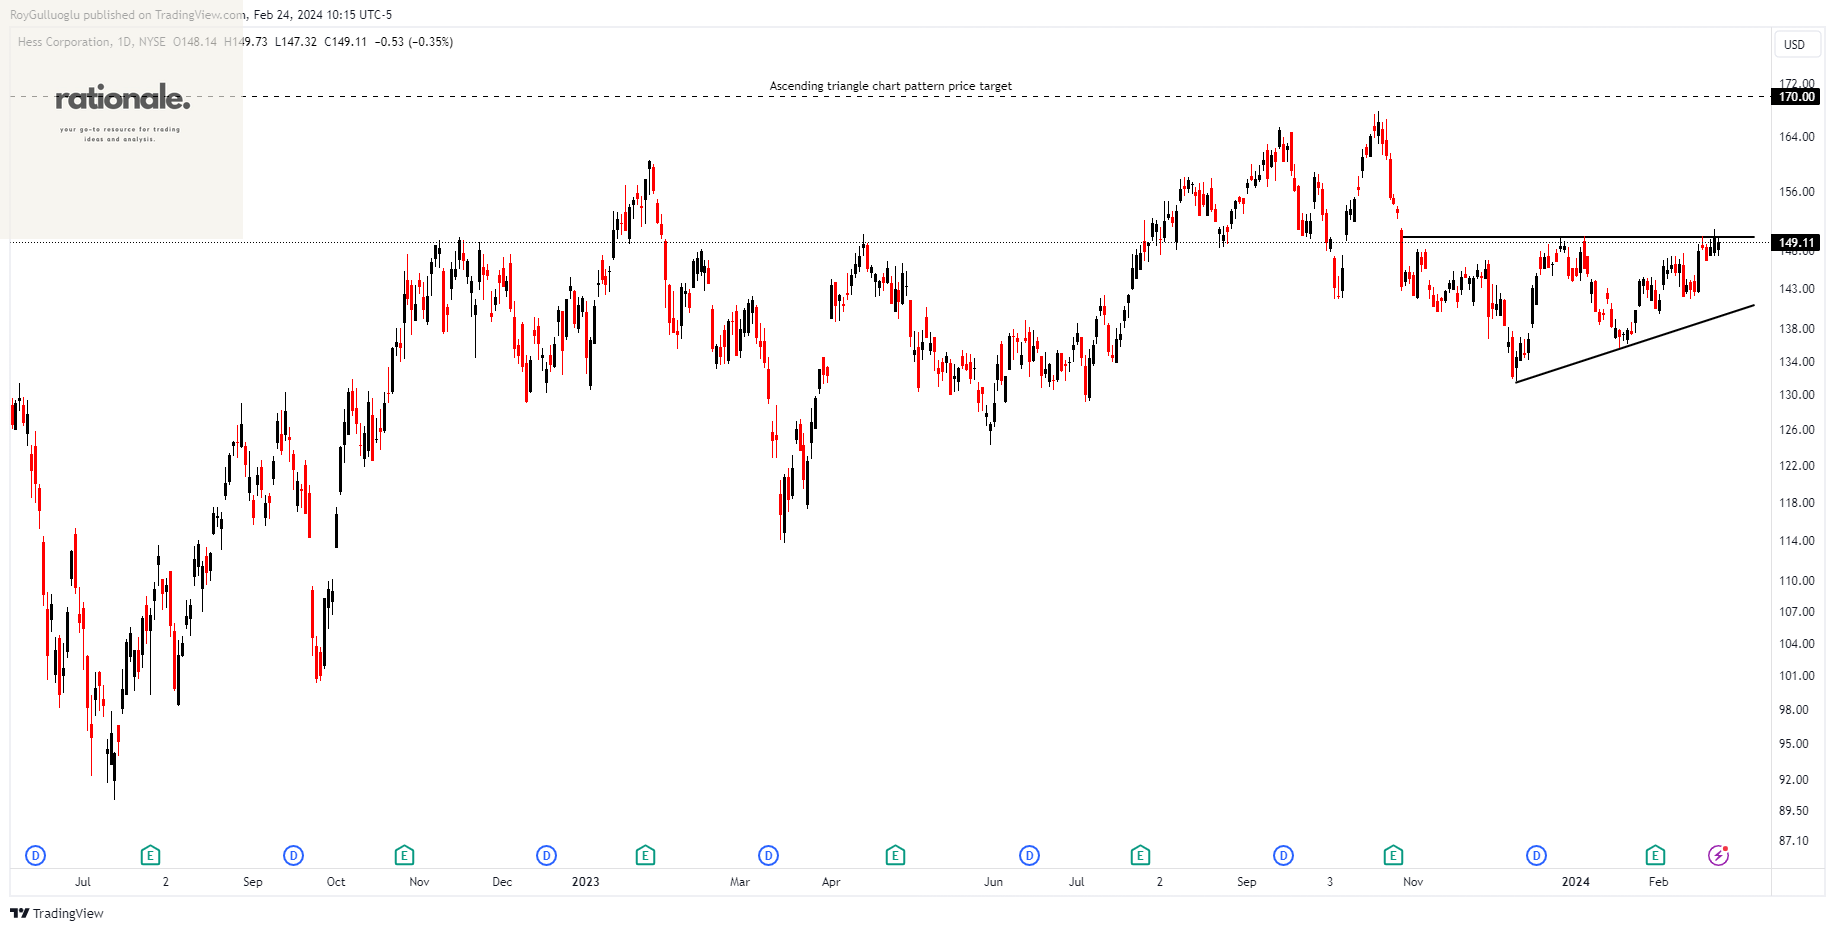
Hess Corporation, an exploration and production firm, engages in the exploration, development, production, acquisition, transportation, and sale of crude oil, natural gas liquids (NGLs), and natural gas.
The above daily chart formed an approximately 3-month-long ascending triangle chart pattern as a bullish reversal after a downtrend.
Within this pattern, the horizontal boundary at 149.8 levels acts as a resistance.
A daily close above 154.3 levels would validate the breakout from the 3-month-long ascending triangle chart pattern.
Based on this chart pattern, the potential price target is 170 levels.
HESS, classified under the "energy" sector, falls under the “Large Cap - Income” stock category.
Eastmen Chemical Company-(EMN/NYSE) - Long Idea
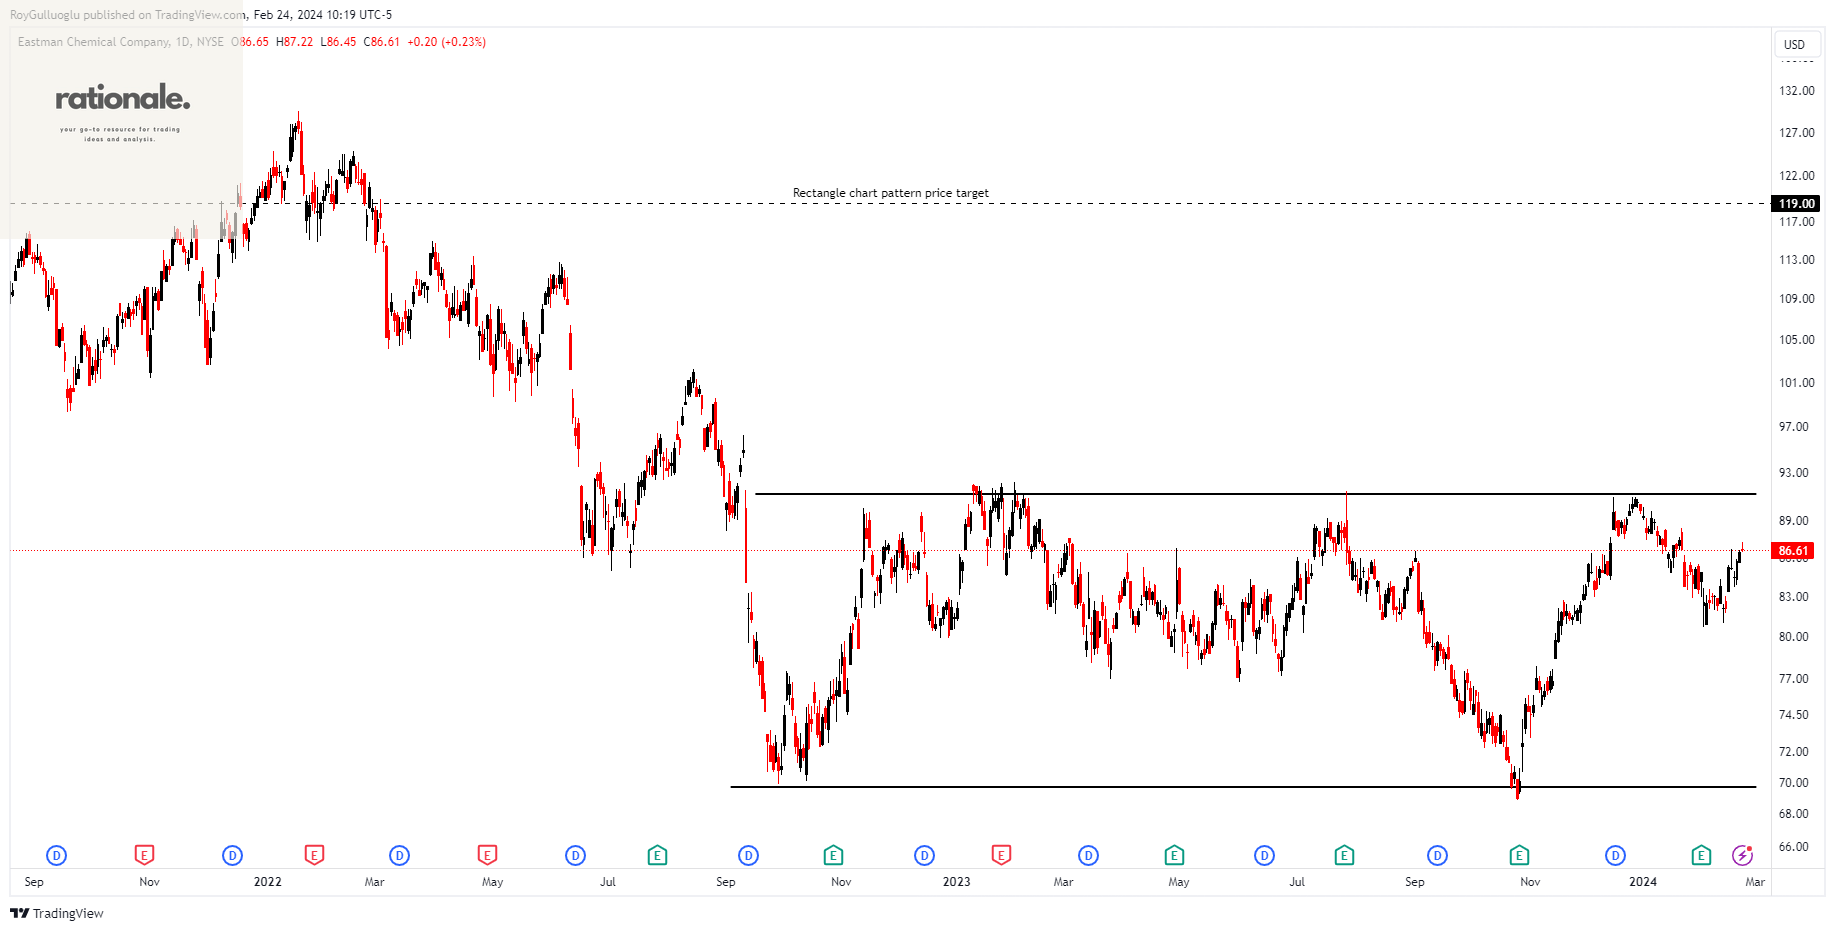
Eastman Chemical Company functions as a specialty materials firm with operations in the United States, China, and globally. The Additives & Functional Products segment of the company provides building blocks derived from amines, intermediates for surfactants, and solutions based on organic acids. Additionally, it offers specialty coalescent and solvents, paint additives, specialty polymers, as well as heat transfer and aviation fluids.
The above daily chart formed an approximately 1-year-long rectangle chart pattern as a bullish reversal after a downtrend.
The boundary at 91.2 levels acts as a resistance within this pattern.
A daily close above 93.93 levels would validate the breakout from the 2-month-long H&S bottom chart pattern.
Based on this chart pattern, the potential price target is 119 levels.
EMN, classified under the "basic materials" sector, falls under the “Large Cap - Value” stock category.
Tri Pointe Homes, Inc.-(TPH/NYSE)-Long Idea
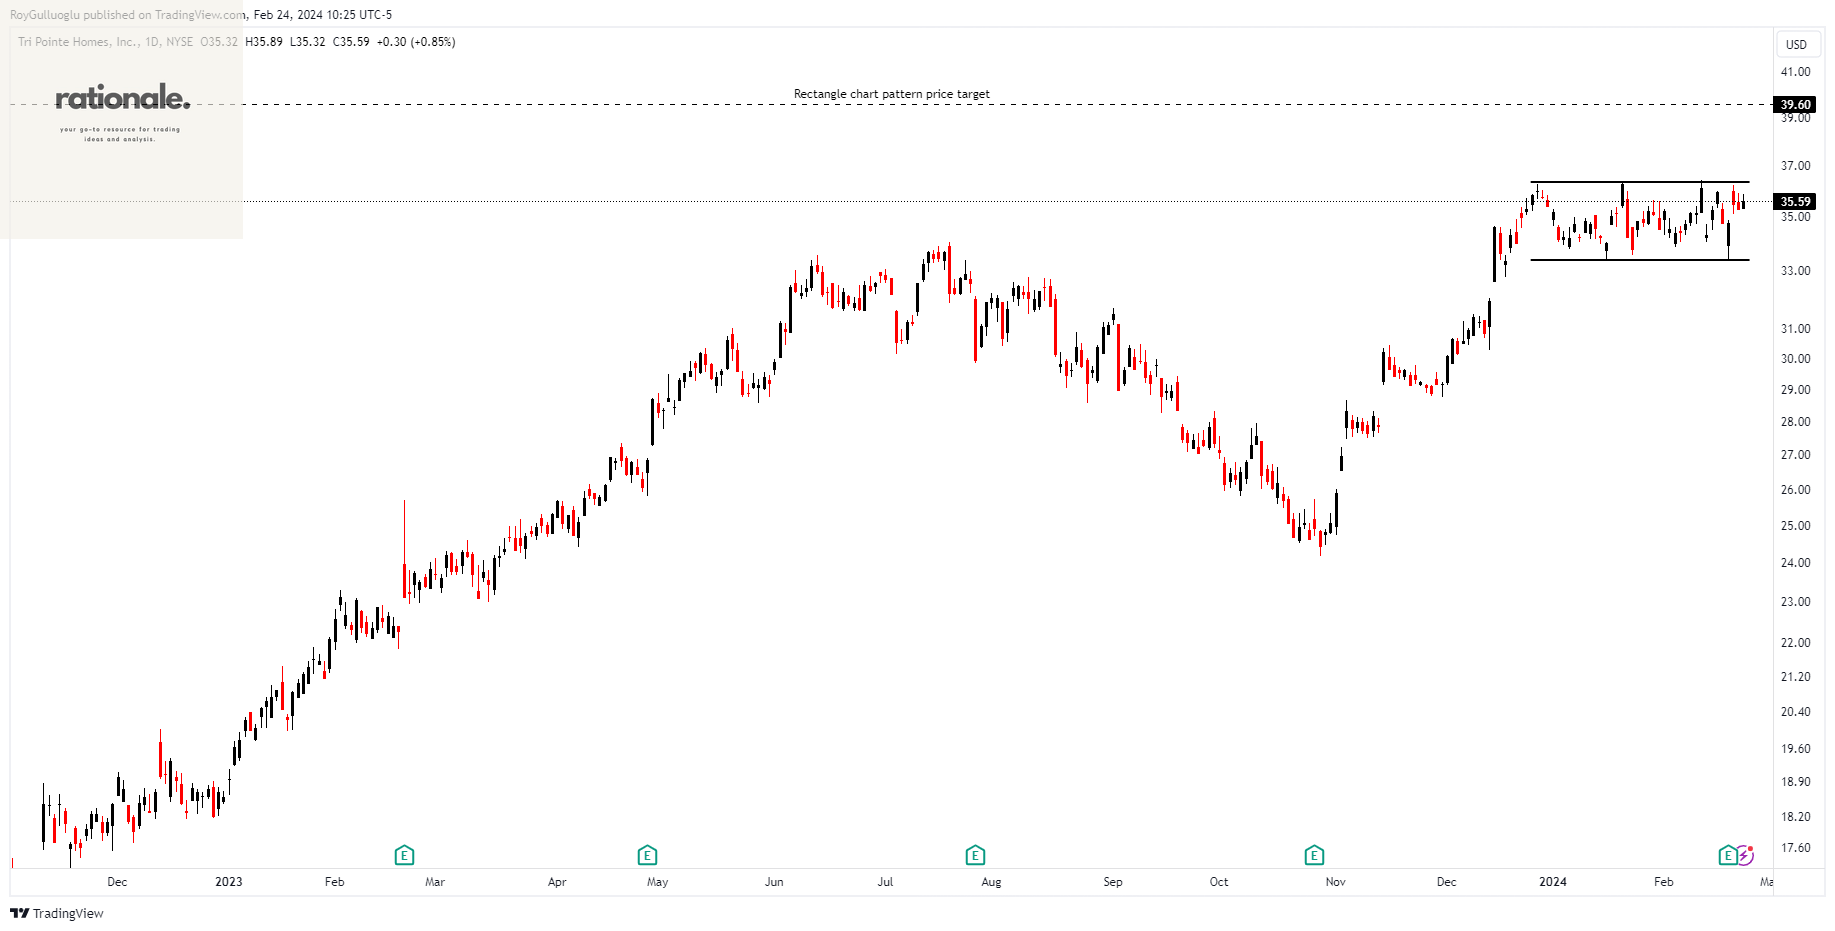
Tri Pointe Homes, Inc. engages in the design, construction, and sale of single-family attached and detached homes in the United States.
The above daily chart formed an approximately 2-month-long rectangle chart pattern as a bullish continuation after an uptrend.
The horizontal boundary at 36.35 levels acts as a resistance within this pattern.
A daily close above 37.44 levels would validate the breakout from the 2-month-long rectangle chart pattern.
Based on this chart pattern, the potential price target is 39.6 levels.
TPH, classified under the "consumer cyclicals" sector, falls under the “Mid Cap - Growth” stock category.
Sonos, Inc.-(SONO/NASDAQ)-Long Idea
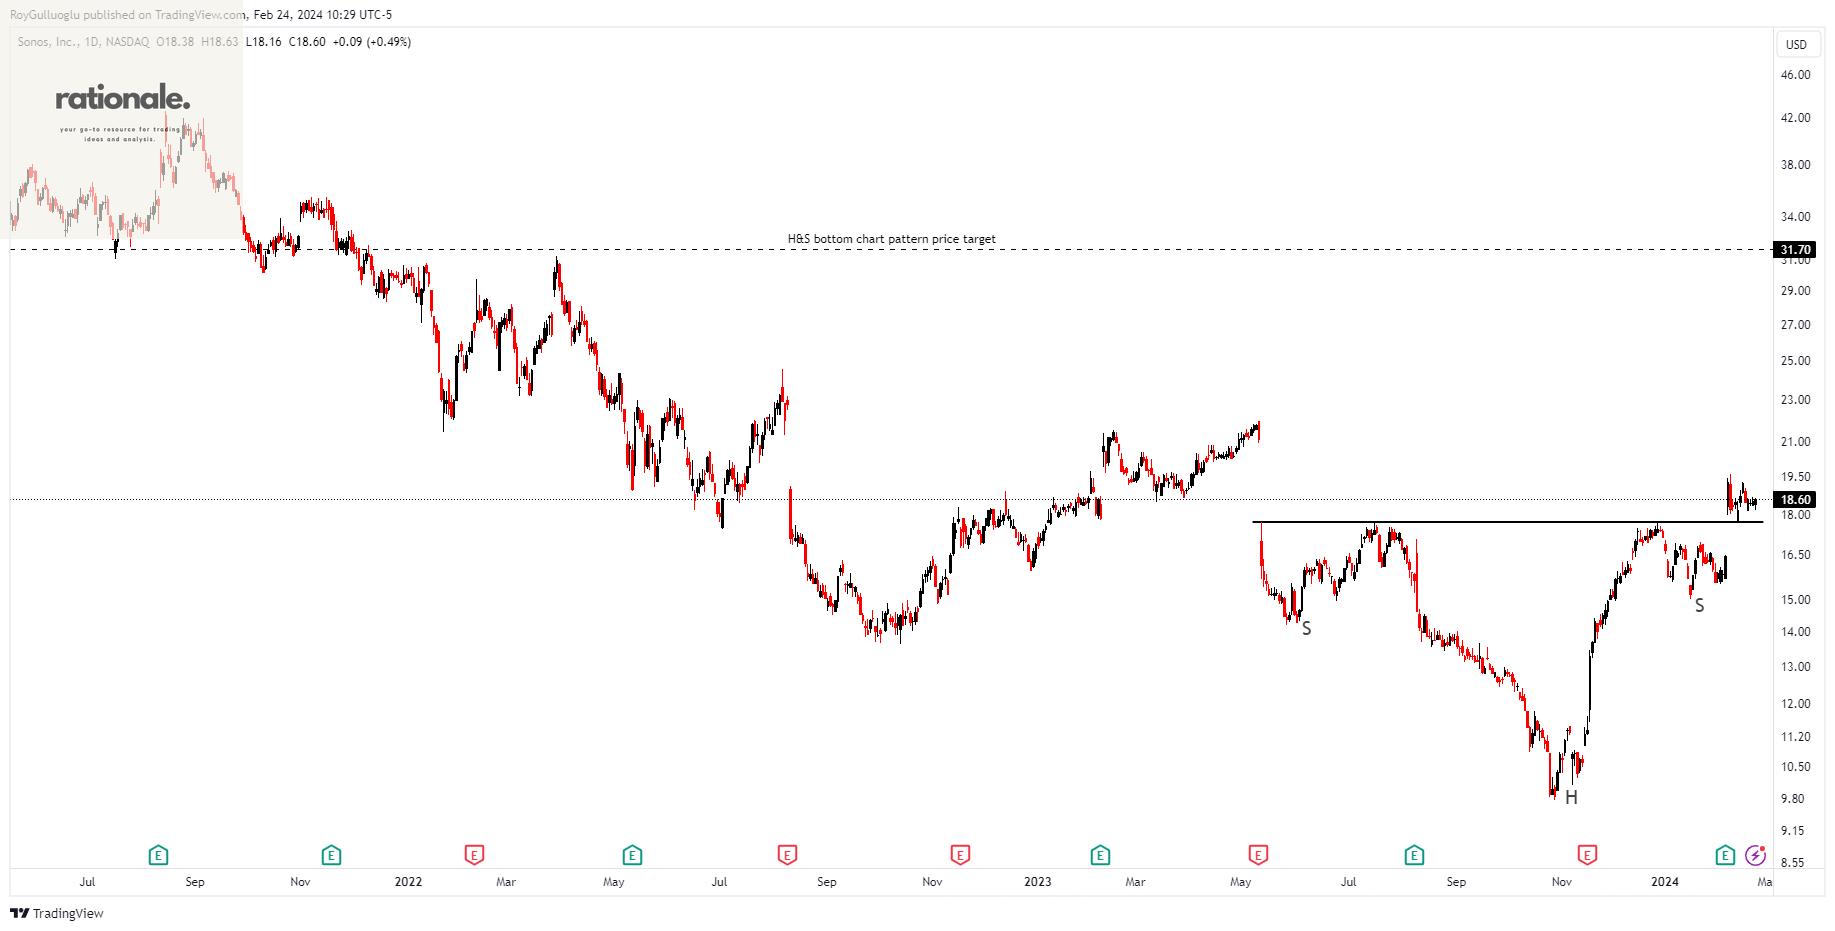
Sonos, Inc. and its subsidiaries are involved in the design, development, manufacturing, and sale of audio products and services across the Americas, Europe, the Middle East, Africa, and the Asia Pacific. The company provides a range of products, including wireless, portable, and home theater speakers, along with components and accessories.
The above daily chart formed an approximately 6-month-long H&S bottom chart pattern as a bullish reversal after a downtrend.
The horizontal boundary at 17.71 levels acted as a resistance within this pattern.
A daily close above 18.24 levels validated the breakout from the 6-month-long H&S bottom chart pattern.
Based on this chart pattern, the potential price target is 31.7 levels.
SONO, classified under the "technology" sector, falls under the “Mid Cap - Growth” stock category.
Qorvo, Inc.-(QRVO/NASDAQ)-Long Idea
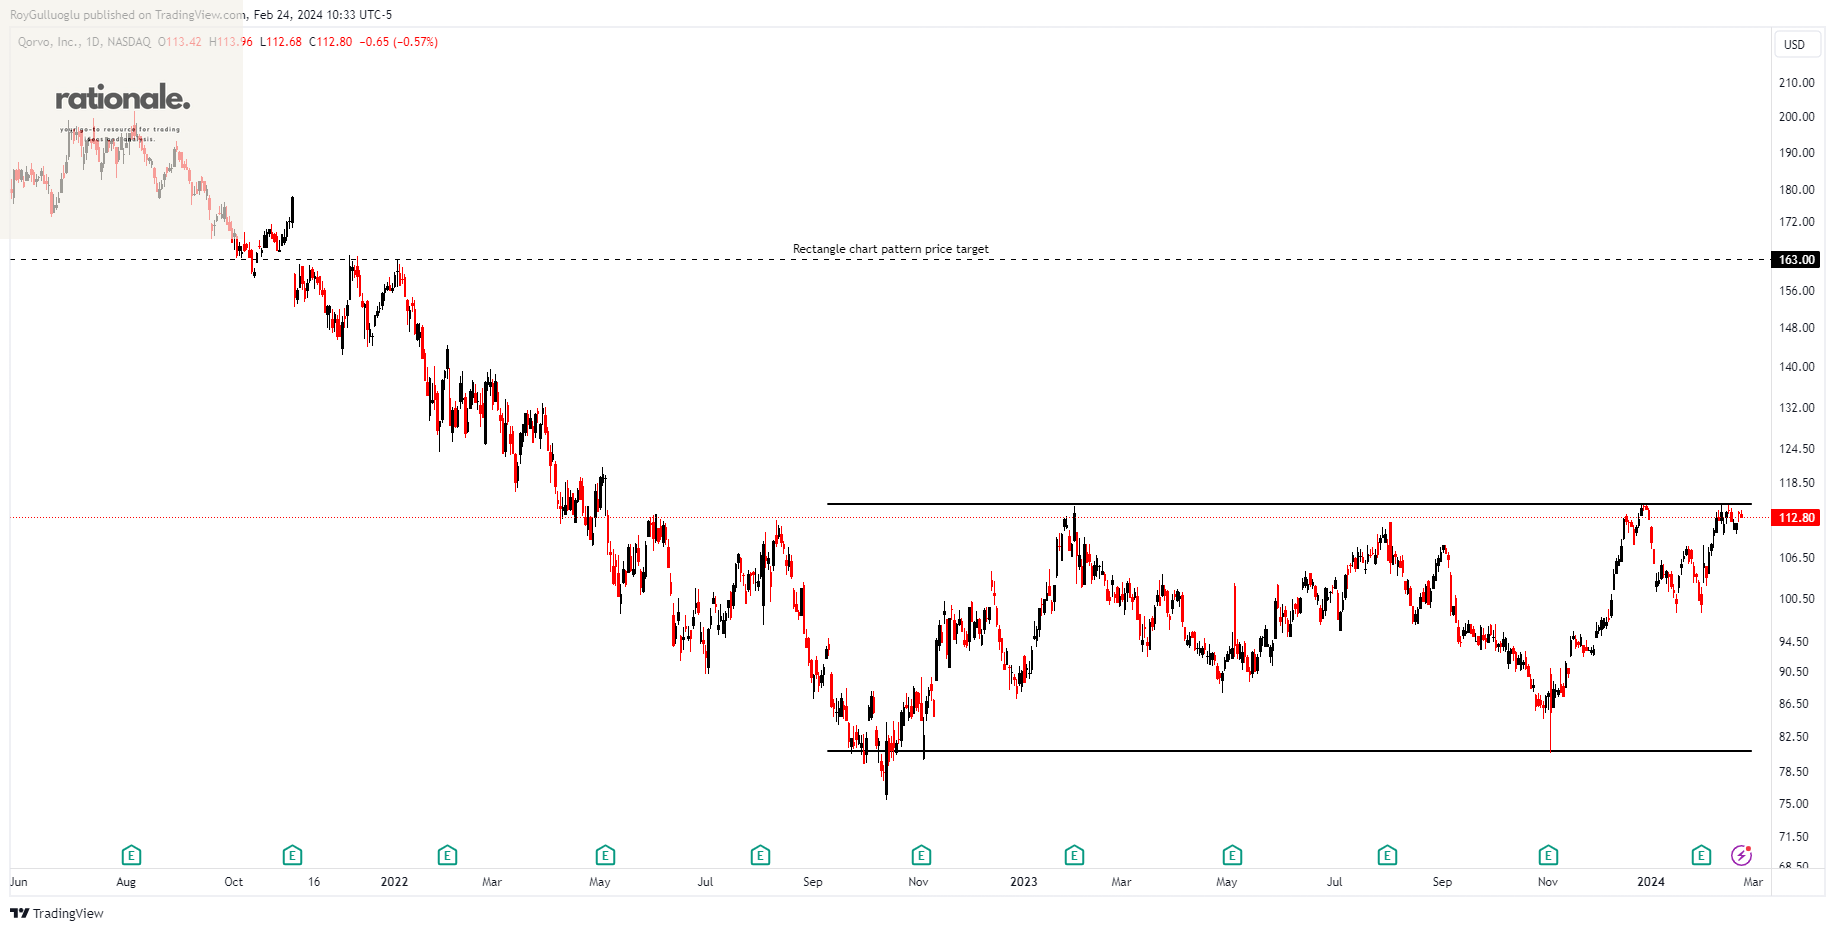
Qorvo, Inc. is involved in the advancement and commercialization of technologies and products for wireless, wired, and power markets.
The above daily chart formed an approximately 11-month-long rectangle chart pattern as a bullish reversal after a downtrend.
The horizontal boundary at 115 levels acts as a resistance within this pattern.
A daily close above 118.45 levels would validate the breakout from the 6-month-long rectangle chart pattern.
Based on this chart pattern, the potential price target is 163 levels.
QRVO, classified under the "technology" sector, falls under the “Large Cap - Growth” stock category.
KAIHAN CO LTD-(3133/TSE)-Long Idea
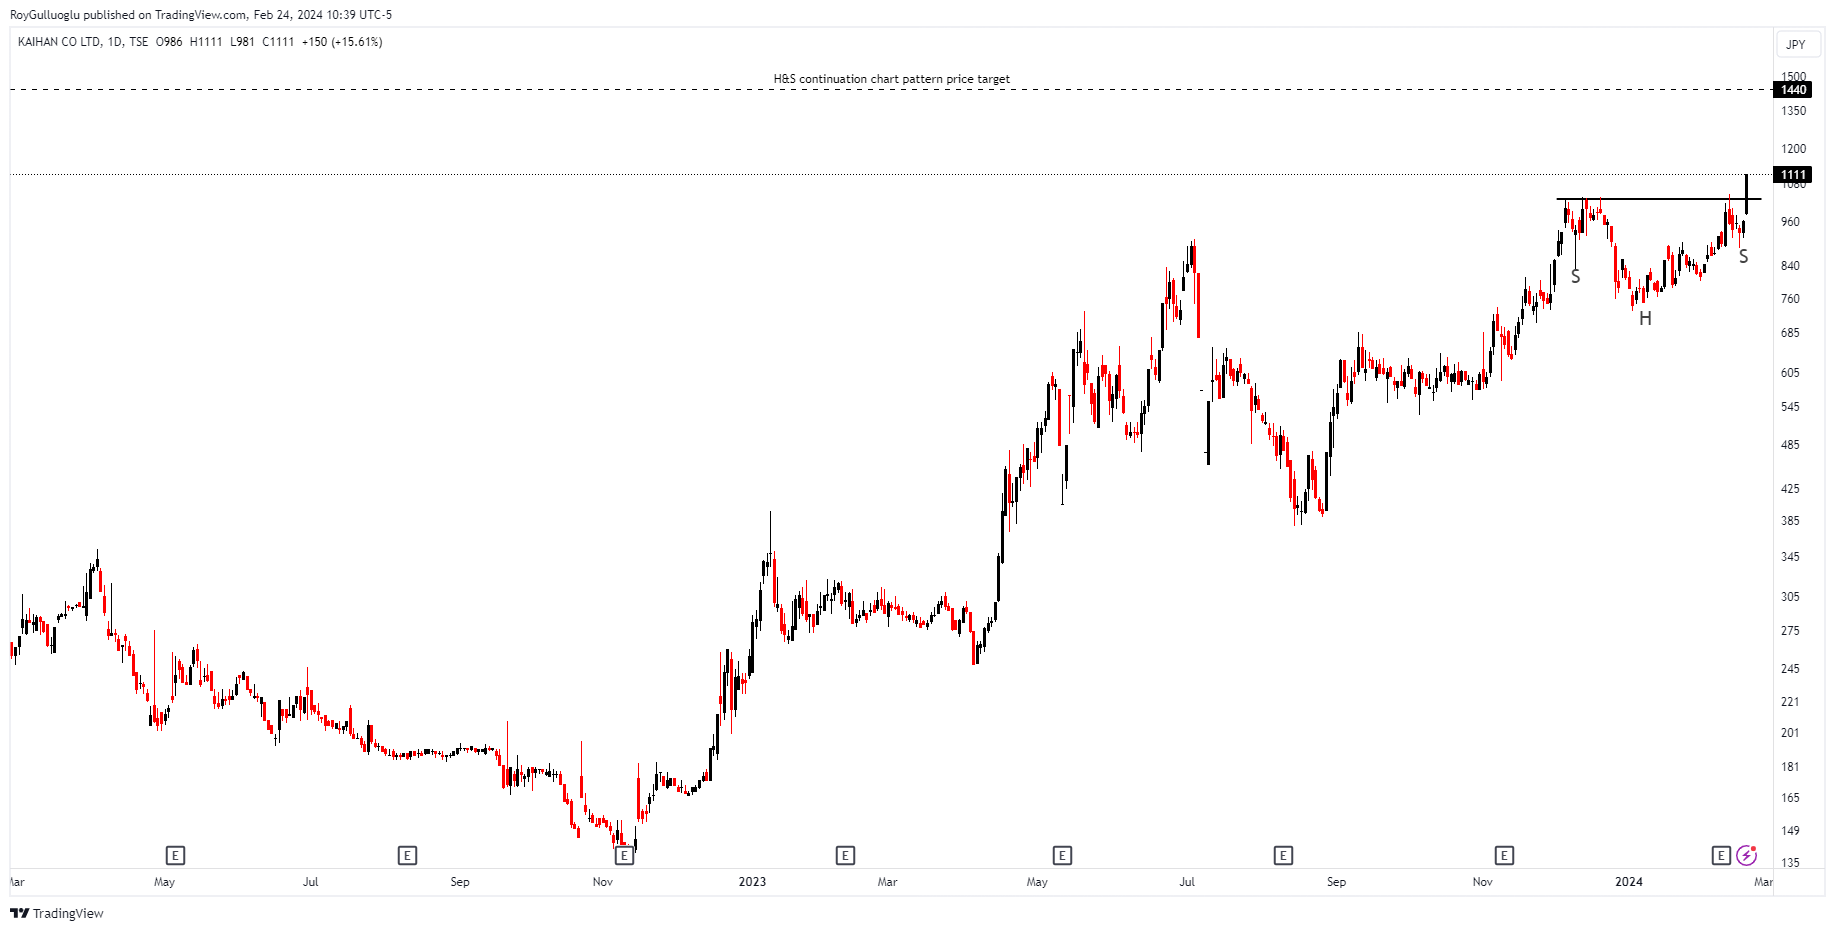
Kaihan Co., Ltd. plans to develop and operate restaurants in Japan
The above daily chart formed an approximately 2-month-long H&S continuation chart pattern as a bullish continuation after an uptrend.
The horizontal boundary at 1030 levels acted as a resistance within this pattern.
A daily close above 1060 levels validated the breakout from the 2-month-long H&S continuation chart pattern.
Based on this chart pattern, the potential price target is 1440 levels.
3133, classified under the "consumer cyclicals" sector, falls under the “Small Cap - Growth” stock category.
CONCORDIA FINANCIAL GROUP LTD-(7186/TSE)-Long Idea
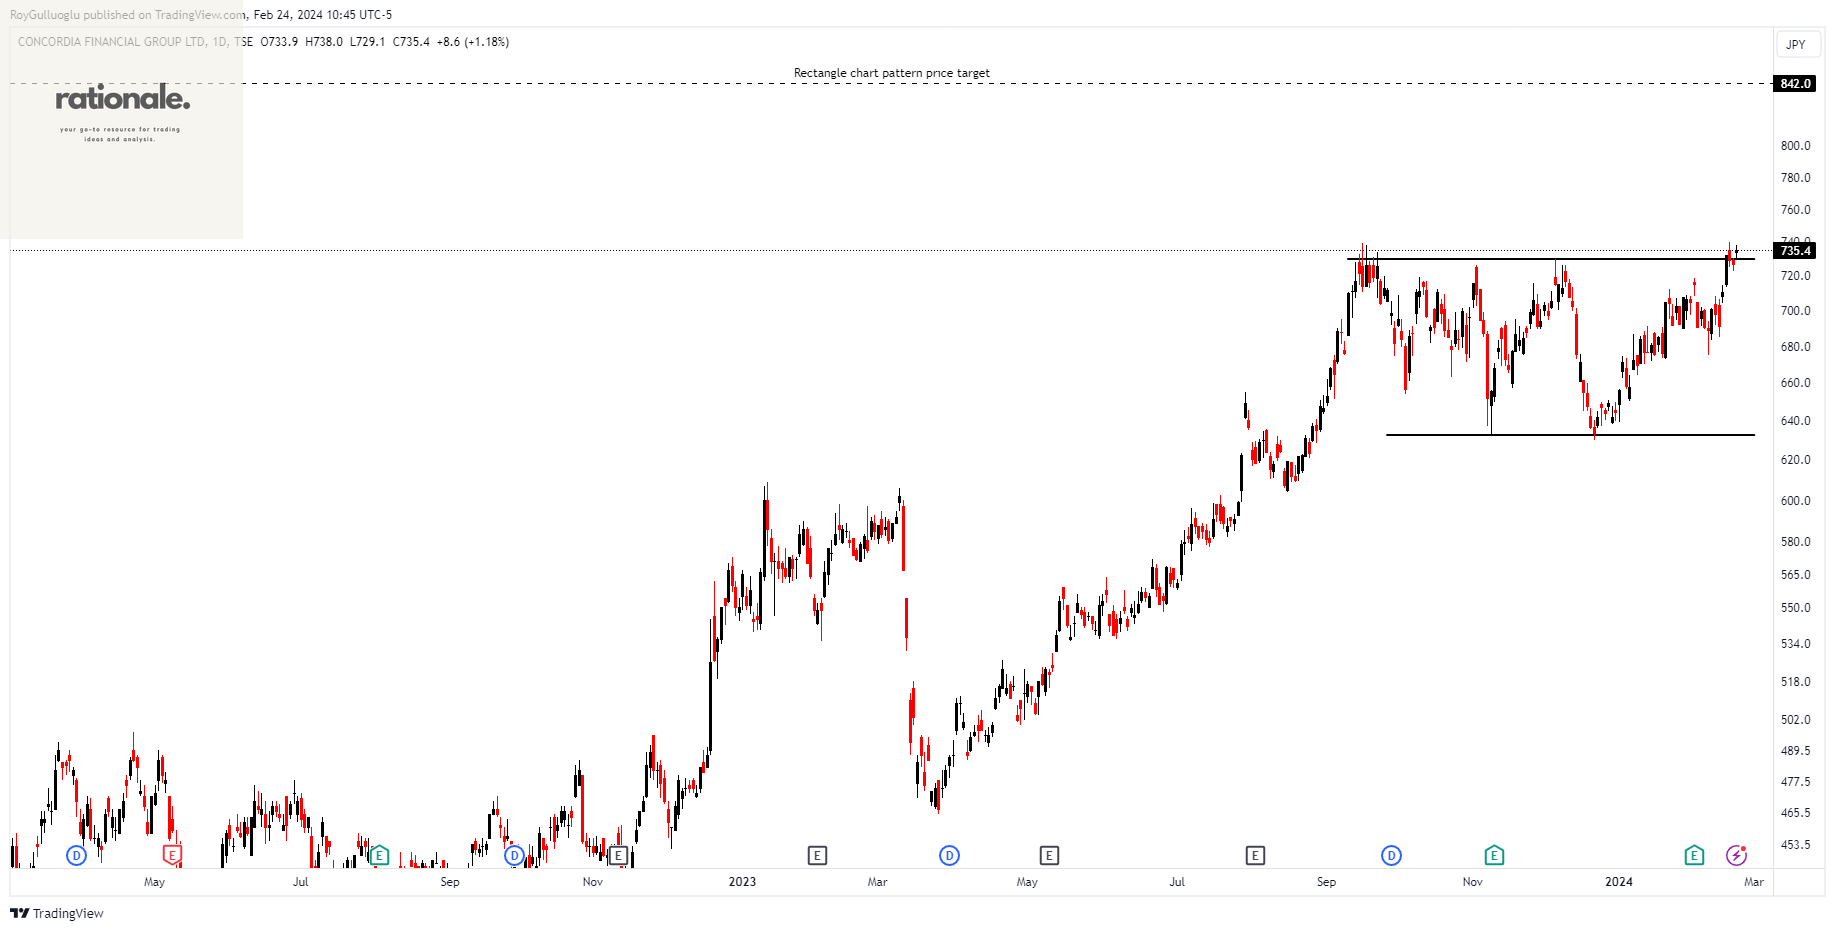
Concordia Financial Group, Ltd. delivers a range of banking products and services to both small and medium-sized businesses, as well as individuals. The company provides diverse deposit and loan products, along with financial services such as securities, leasing, survey research, venture capital, and other related offerings.
The above daily chart formed an approximately 3-month-long rectangle chart pattern as a bullish continuation after an uptrend.
The horizontal boundary at 730 levels acts as a resistance within this pattern.
A daily close above 751.9 levels would validate the breakout from the 3-month-long rectangle chart pattern.
Based on this chart pattern, the potential price target is 842 levels.
7186, classified under the "financial services" sector, falls under the “Mid Cap - Income” stock category.
AMADA CO LTD-(6113/TSE)-Long Idea
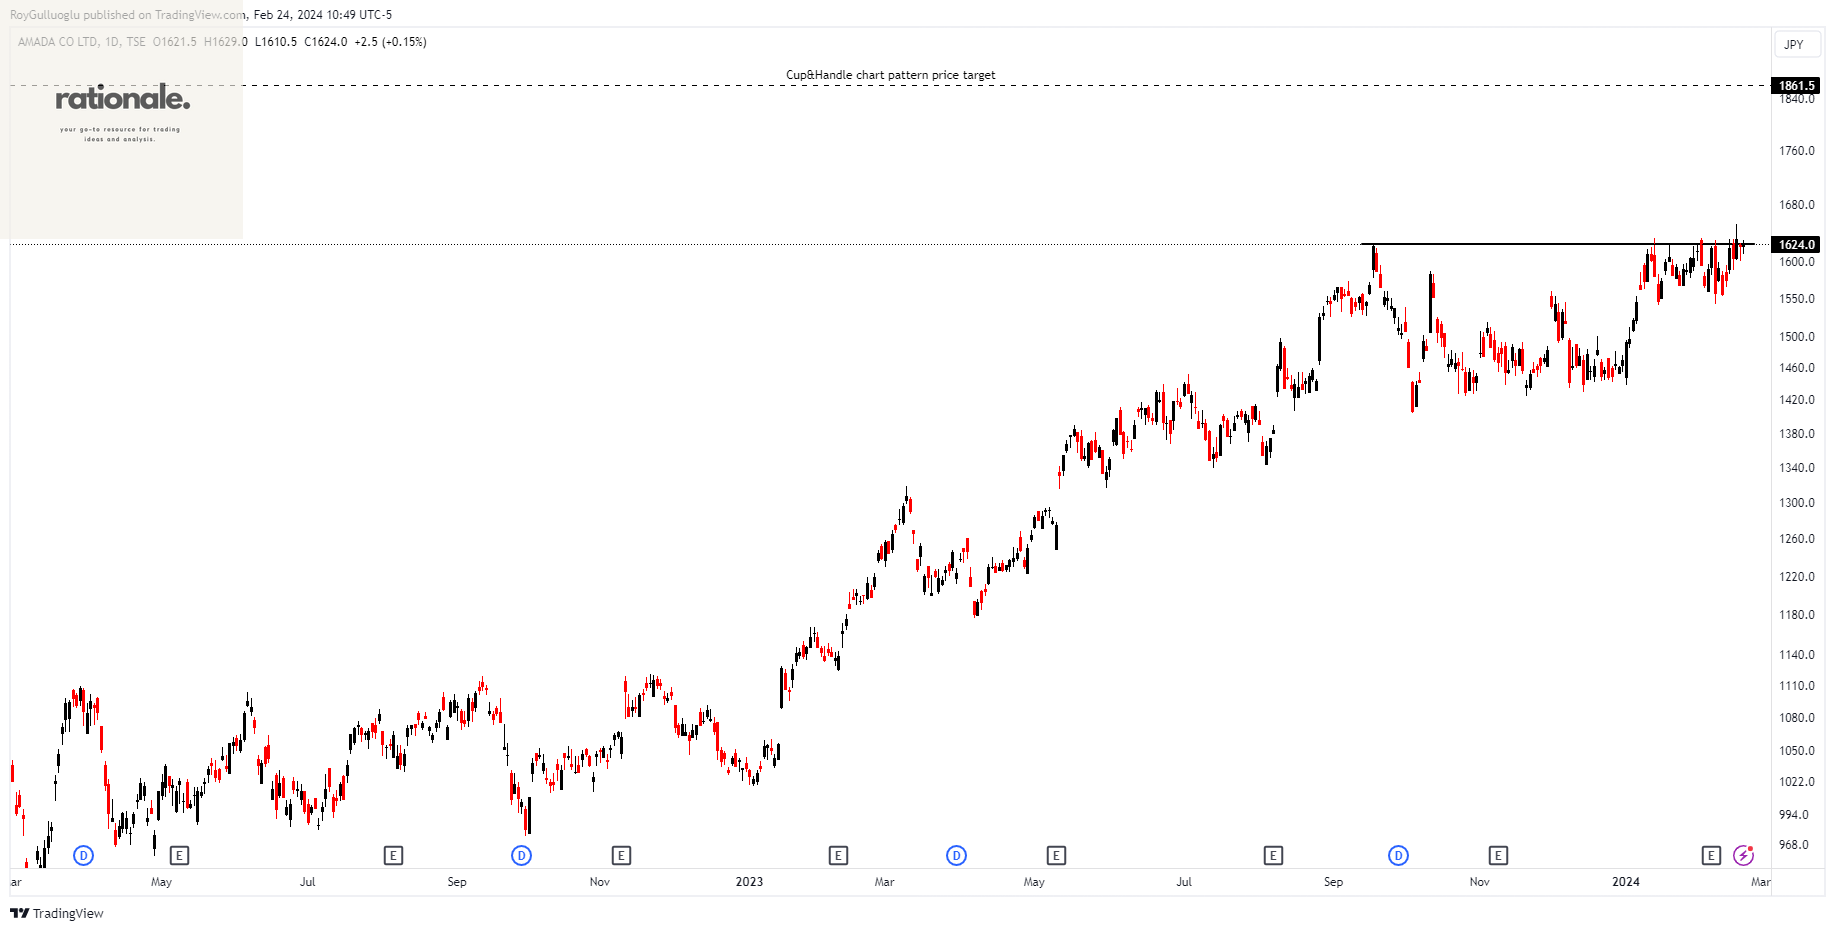
Amada Co., Ltd. and its subsidiaries engage in the manufacturing, selling, leasing, repairing, maintaining, checking, and inspecting of metalworking machinery, software, and peripheral equipment. This activity spans across Japan, North America, Europe, Asia, and international markets.
The above daily chart formed an approximately 3-month-long Cup & Handle chart pattern as a bullish continuation after an uptrend.
The horizontal boundary at 1624 levels acts as a resistance within this pattern.
A daily close above 1672 levels would validate the breakout from the 3-month-long Cup & Handle chart pattern.
Based on this chart pattern, the potential price target is 1861.5 levels.
6113, classified under the "industrials" sector, falls under the “Mid Cap - Value” stock category.
CT TAI CHINH CP DIEN LUC-(EVF/HOSE)-Long Idea
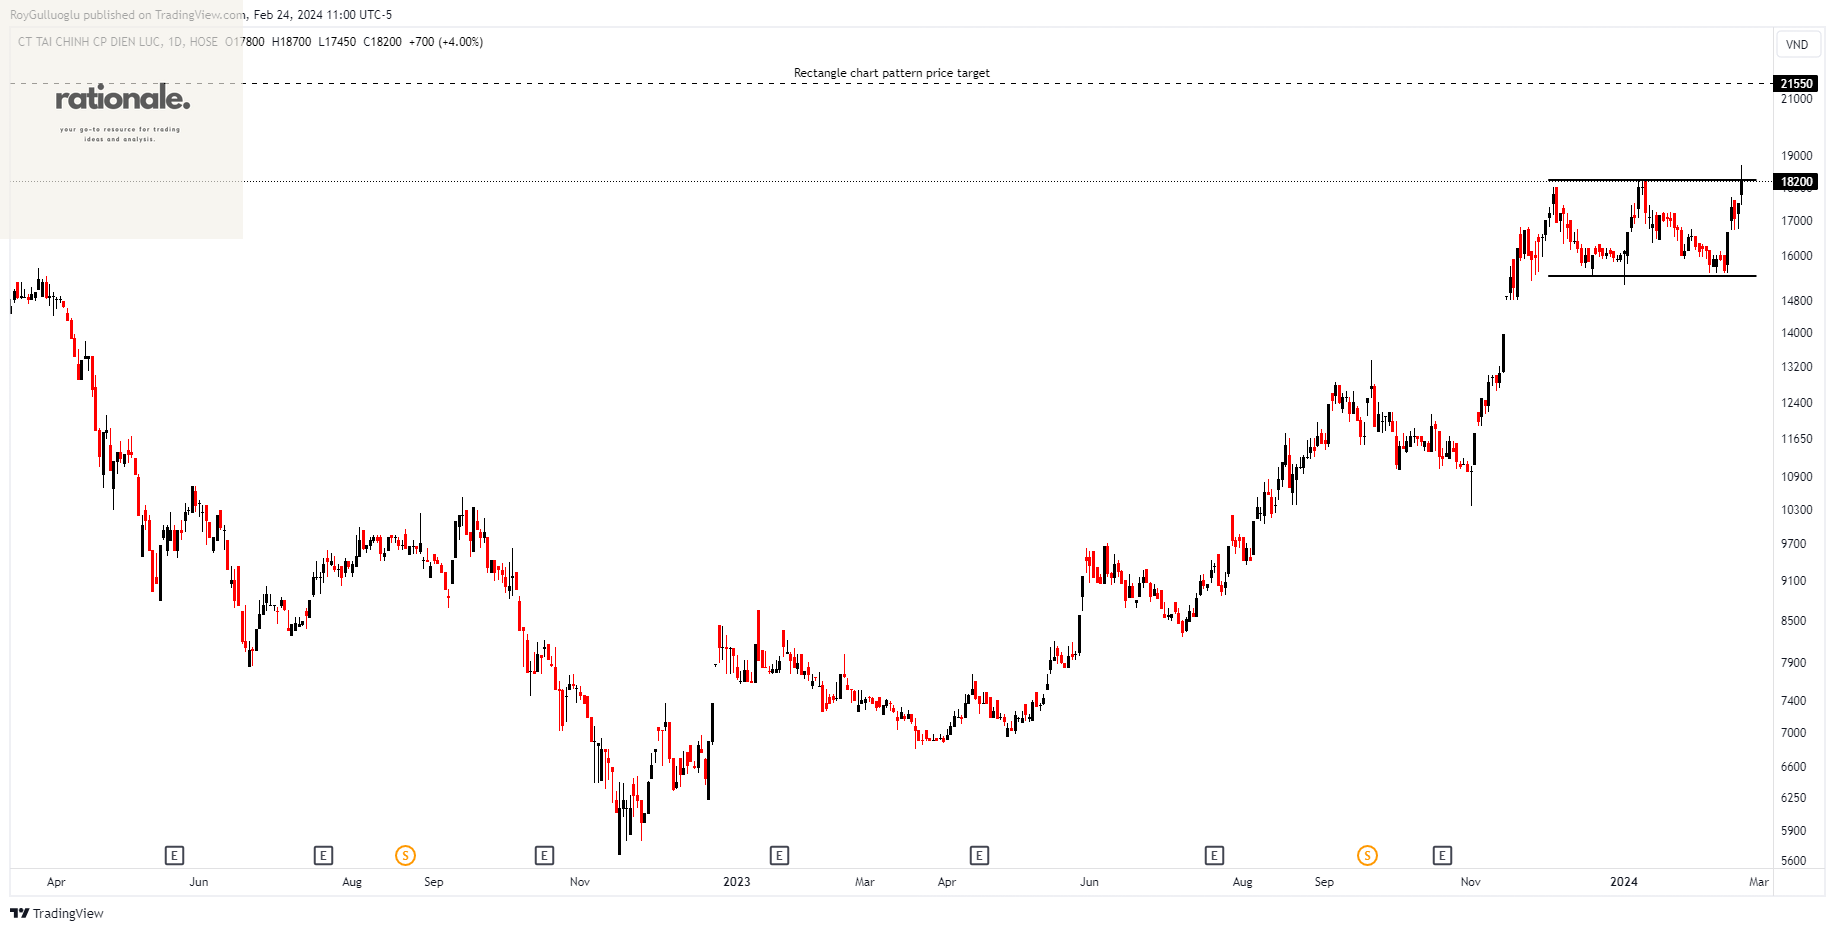
EVN Finance JSC is involved in delivering a range of financial services, encompassing credit services, investment, trusted fund management, financial and CDM advisory services, forex dealing, money market activities, forex trading, as well as lending and financial services tailored for individuals.
The above daily chart formed an approximately 2-month-long rectangle chart pattern as a bullish continuation after an uptrend.
The horizontal boundary at 18200 levels acts as a resistance within this pattern.
A daily close above 18746 levels would validate the breakout from the 2-month-long rectangle chart pattern.
Based on this chart pattern, the potential price target is 21550 levels.
M.DIASBRANCOON-(MDIA3/BOVESPA)-Long Idea
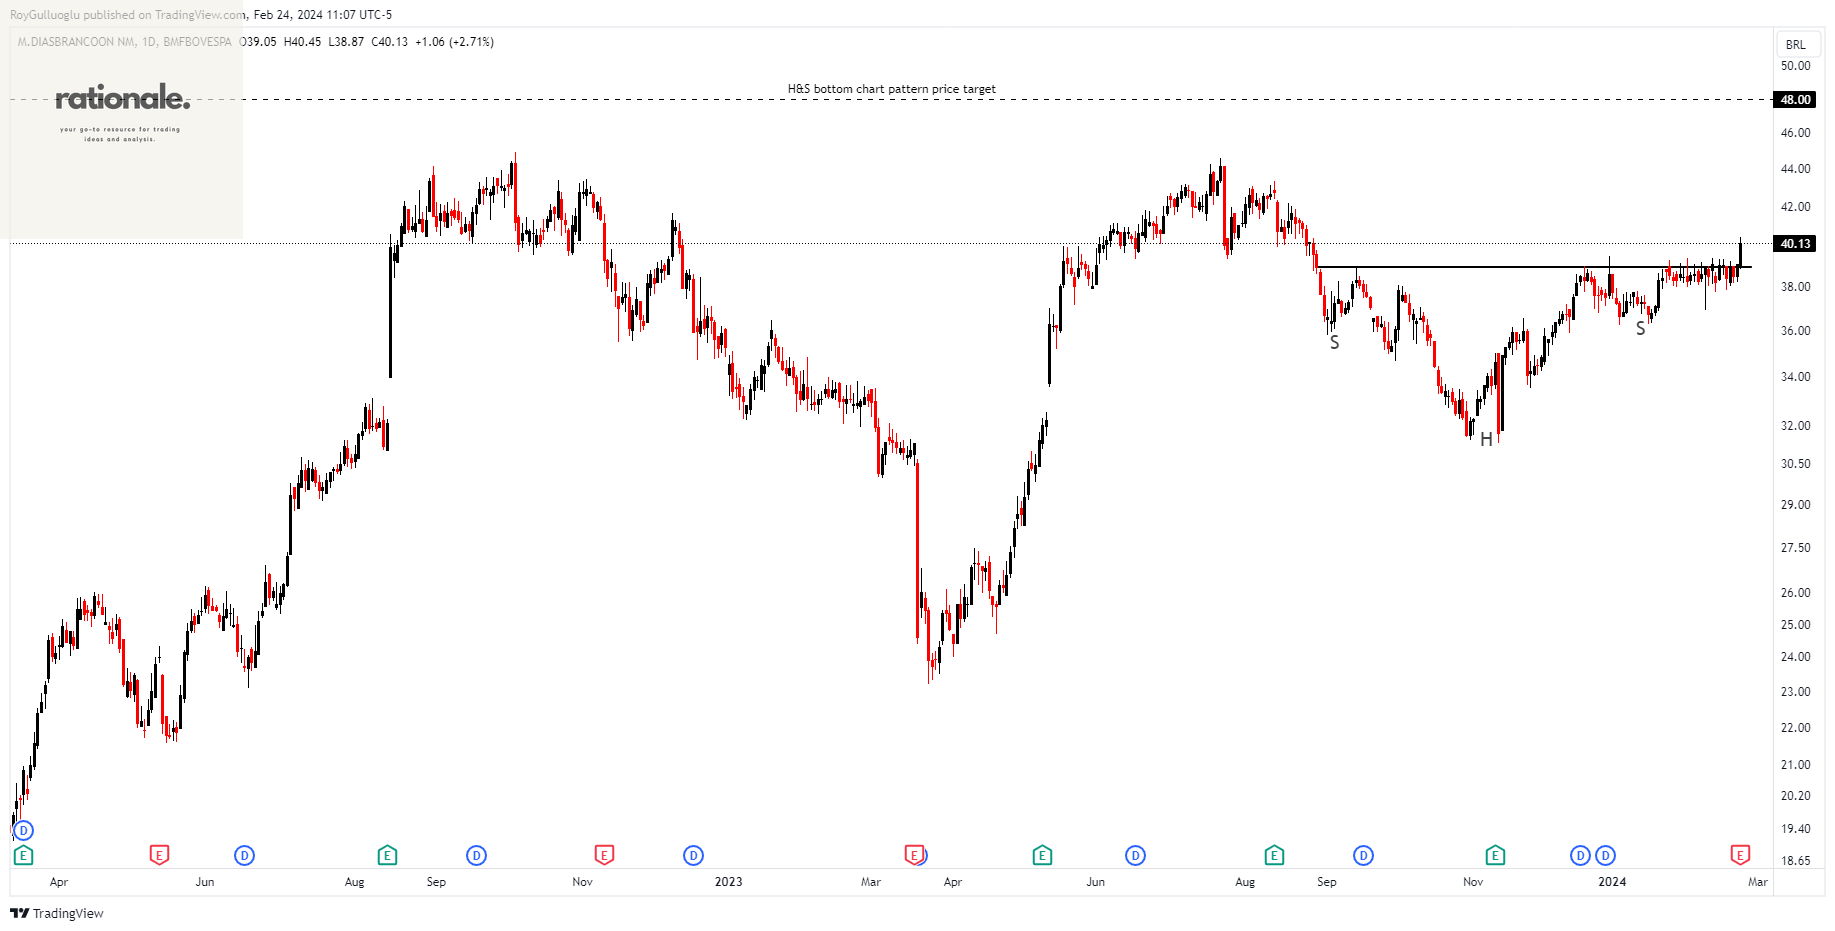
M. Dias Branco SA Industria e Comercio de Alimentos engages in the manufacture and trade of food products. The firm offers cookies, pasta, wheat flour and bran, cake mixes, margarine & vegetable shortening, cakes, snacks, and packages of toast.
The above daily chart formed an approximately 4-month-long H&S bottom chart pattern as a bullish reversal after a downtrend.
The horizontal boundary at 38.95 levels acted as a resistance within this pattern.
A daily close above 40.11 levels validated the breakout from the 4-month-long H&S bottom chart pattern.
Based on this chart pattern, the potential price target is 48 levels.
WEICHAI POWER CO-(2338/HKEX)-Long Idea
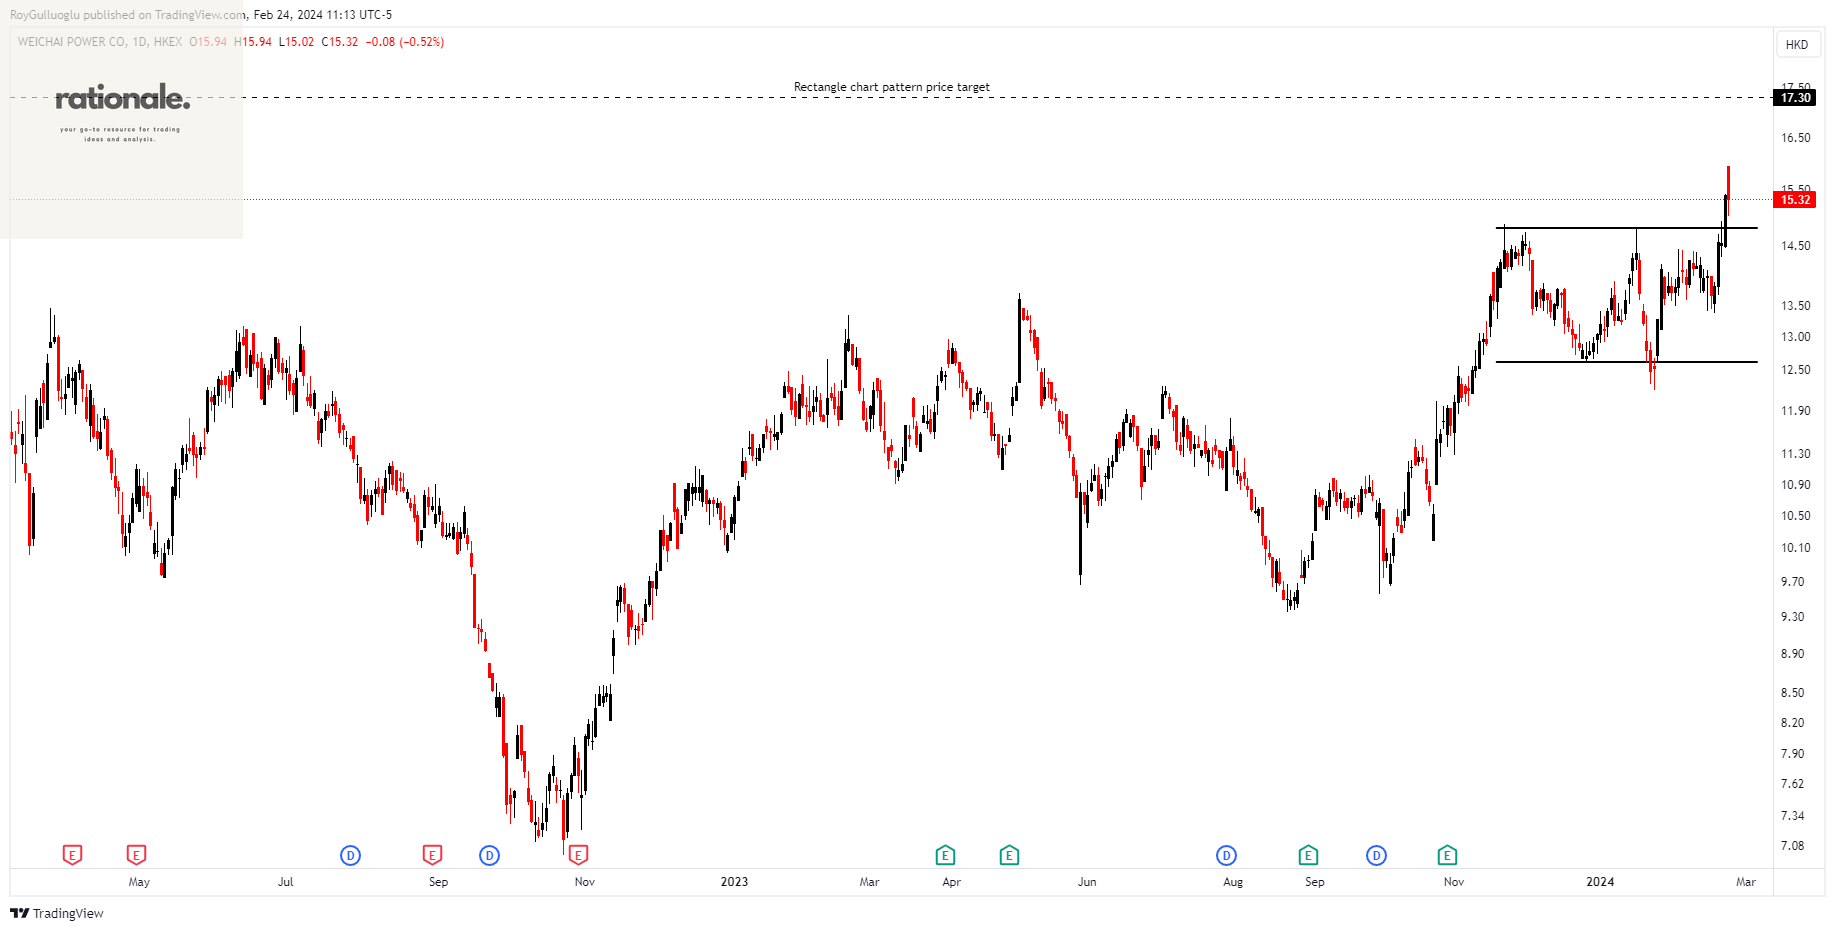
Weichai Power Co., Ltd. is involved in the manufacturing and sale of diesel engines, automobiles, and various automobile components, operating both in China and internationally.
The above daily chart formed an approximately 2-month-long rectangle chart pattern as a bullish continuation after an uptrend.
The horizontal boundary at 14.8 levels acted as a resistance within this pattern.
A daily close above 15.24 levels validated the breakout from the 2-month-long rectangle chart pattern.
Based on this chart pattern, the potential price target is 17.3 levels.
2338, classified under the "industrials" sector, falls under the “Large Cap - Value” stock category.
TURK HAVA YOLLARI-(THYAO/BIST)-Long Idea
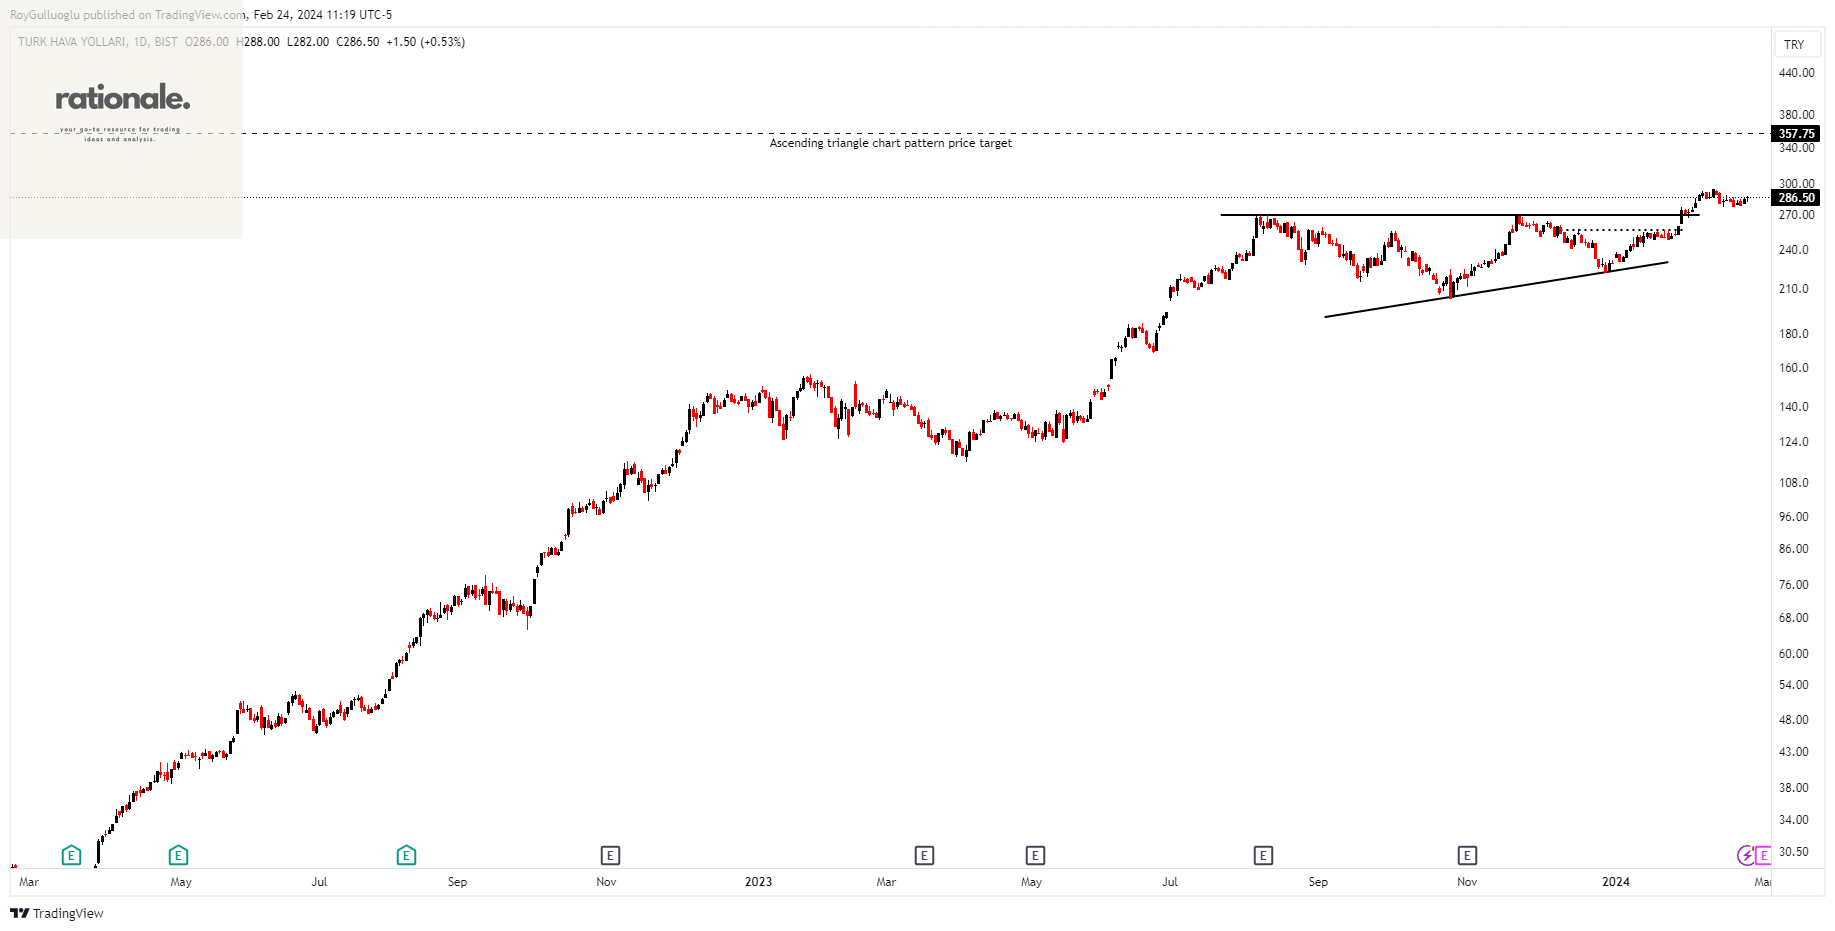
Türk Hava Yollari Anonim Ortakligi provides air transport and aircraft technical maintenance services in Turkey and internationally.
The above daily chart formed an approximately 4-month-long ascending triangle chart pattern as a bullish continuation after an uptrend.
The horizontal boundary at 270 levels acted as a resistance within this pattern.
A daily close above 278 levels validated the breakout from the 4-month-long ascending triangle chart pattern.
Based on this chart pattern, the potential price target is 357.75 levels.
THYAO, classified under the "industrials" sector, falls under the “Large Cap - Value” stock category.
GALATA WIND ENERJI-(GWIND/BIST)-Long Idea
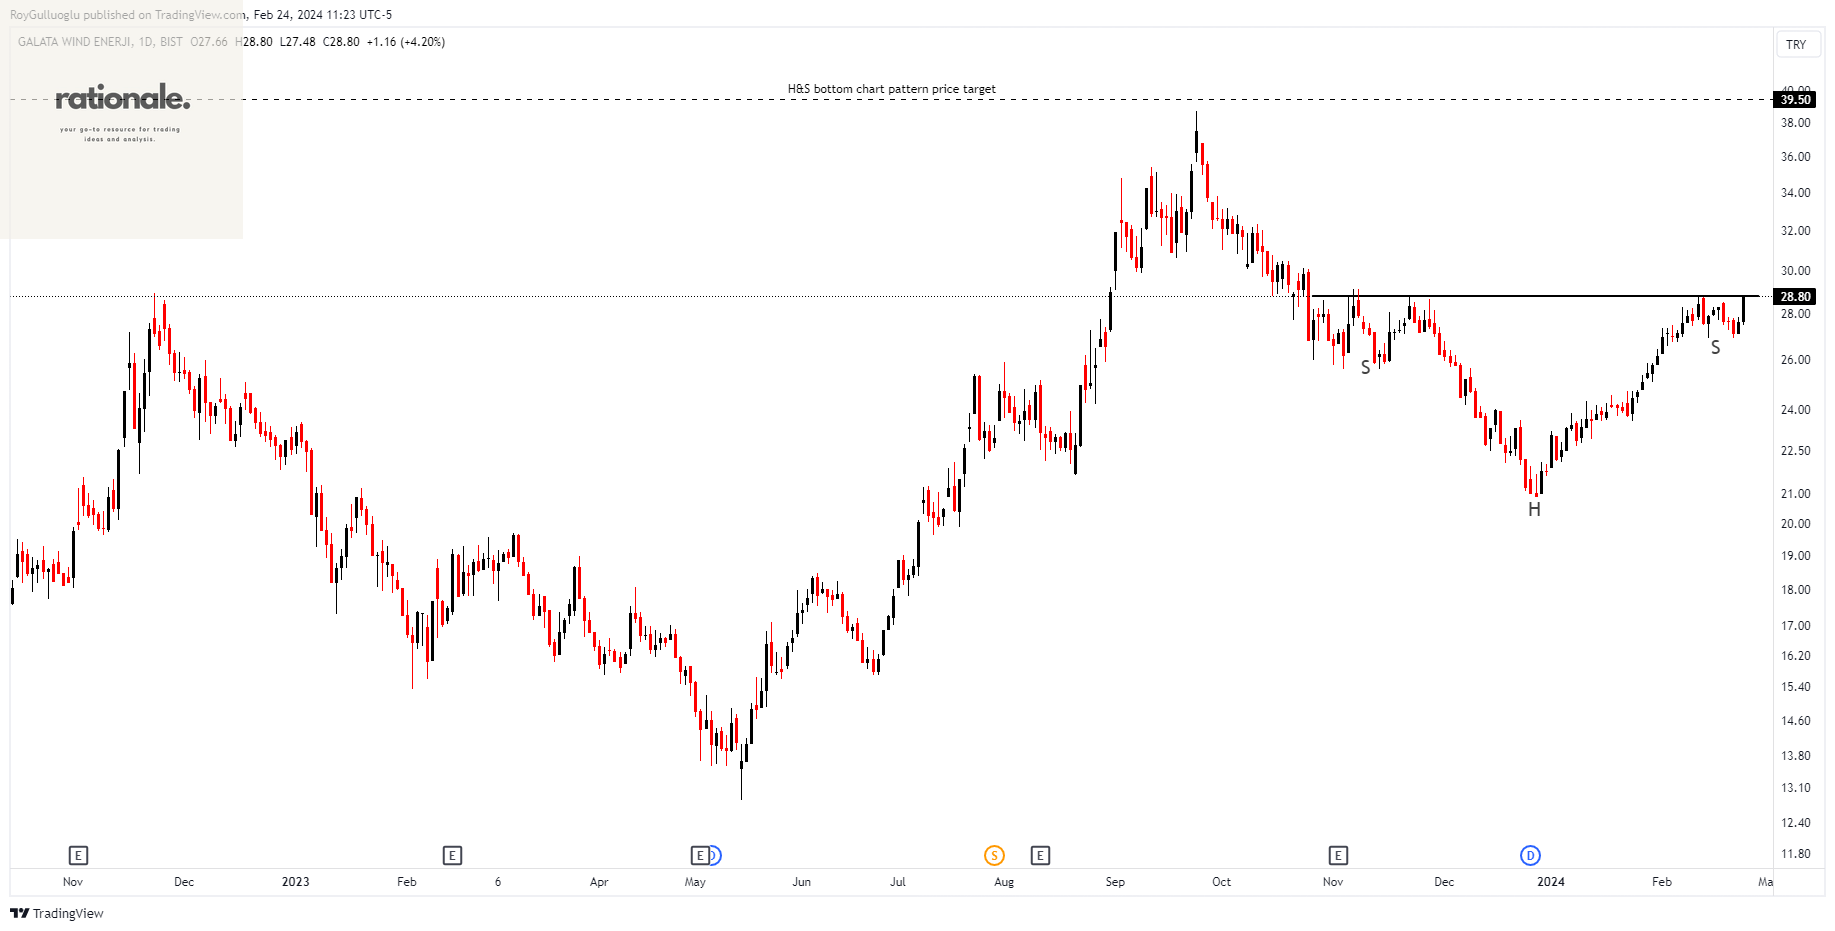
Galata Wind Enerji A.S. operates and rents electric power plants in Turkey. It operates three wind power plants and two solar power plants with a total capacity of 269 MW.
The above daily chart formed an approximately 3-month-long H&S bottom chart pattern as a bullish reversal after a downtrend.
The horizontal boundary at 28.8 levels acts as a resistance within this pattern.
A daily close above 29.6 levels would validate the breakout from the 3-month-long H&S bottom chart pattern.
Based on this chart pattern, the potential price target is 39.5 levels.
GWIND, classified under the "utilities" sector, falls under the “Small Cap - Income” stock category.
VBT YAZILIM-(VBTYZ/BIST)-Long Idea
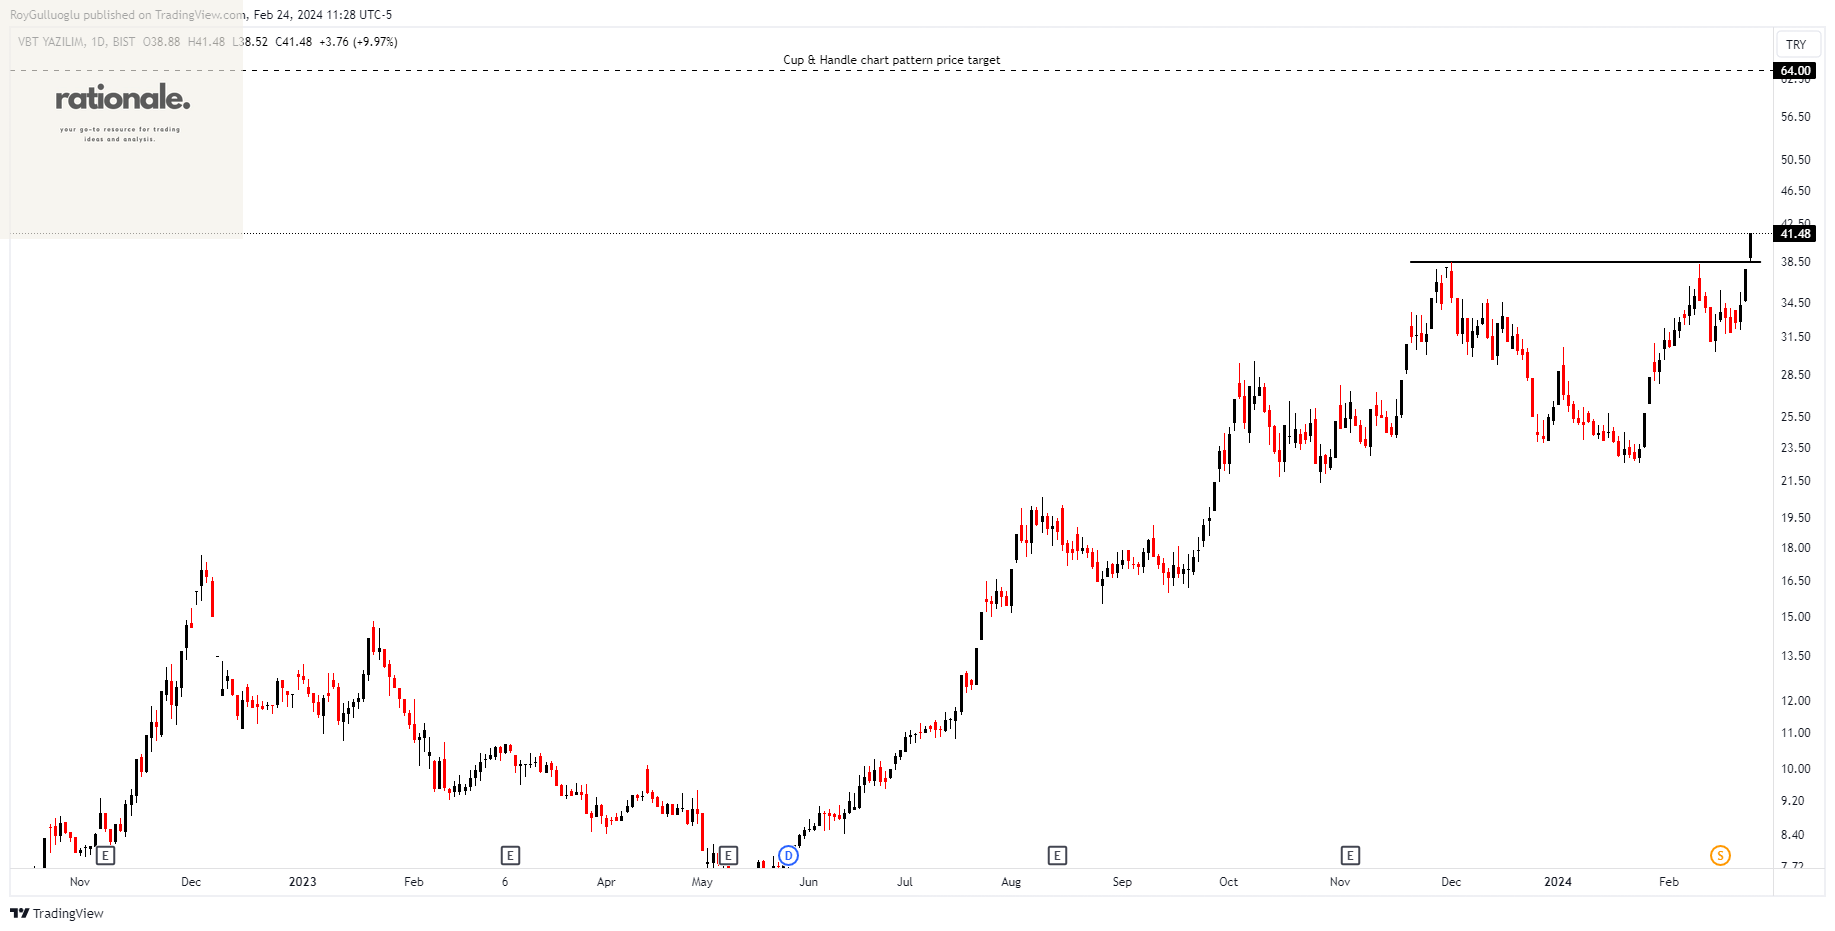
VBT Yazilim Anonim Sirketi delivers information technology services in Turkey. The company provides various outsourcing services, including payroll, project-based, and component-based system management.
The above daily chart formed an approximately 2-month-long Cup & Handle chart pattern as a bullish continuation after an uptrend.
The horizontal boundary at 38.38 levels acted as a resistance within this pattern.
A daily close above 39.53 levels validated the breakout from the 2-month-long Cup & Handle chart pattern.
Based on this chart pattern, the potential price target is 64 levels.
VBTYZ, classified under the "technology" sector, falls under the “Small Cap - Growth” stock category.
AUTO TRADER GROUP PLC ORD -(AUTO/LSE)-Long Idea
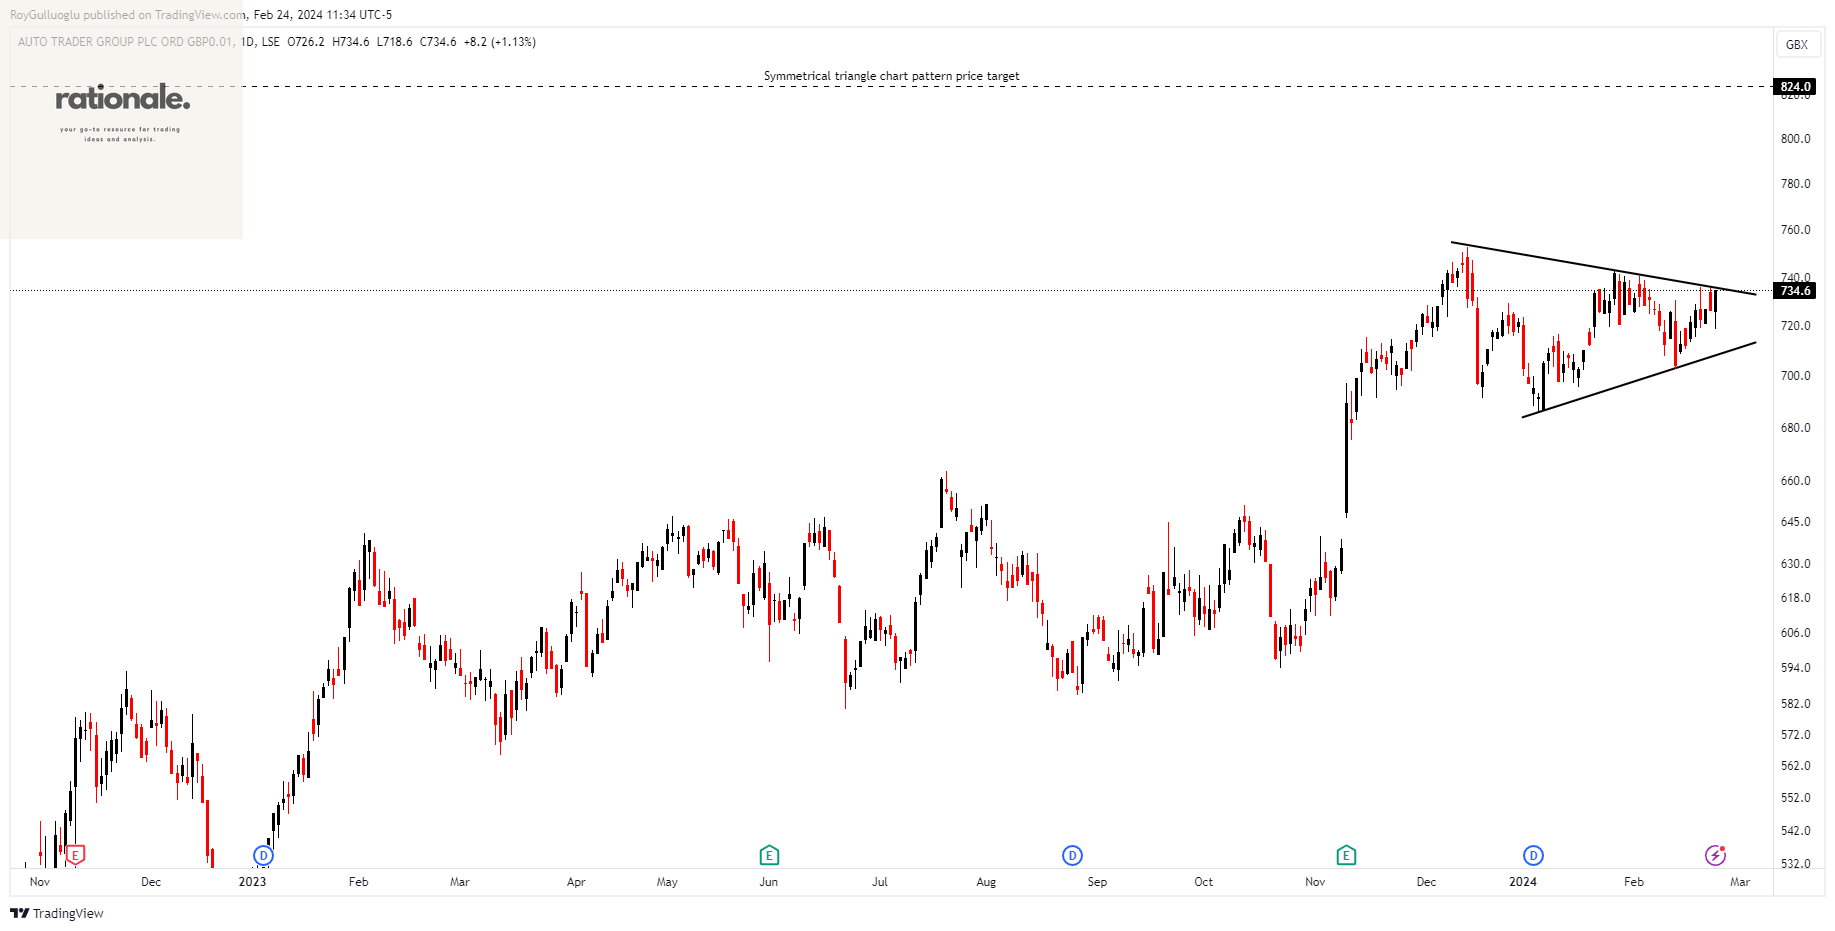
Auto Trader Group plc operates in the digital automotive marketplace in the United Kingdom and Ireland.
The above daily chart formed an approximately 2-month-long symmetrical triangle chart pattern as a bullish continuation after an uptrend.
A daily close above 742.2(ATR30 based b/o) levels would validate the breakout from the 2-month-long symmetrical triangle chart pattern.
Based on this chart pattern, the potential price target is 824 levels.
AUTO, classified under the "technology" sector, falls under the “Small Cap - Growth” stock category.
KION GROUP AG-(KGX/XETR)-Long Idea
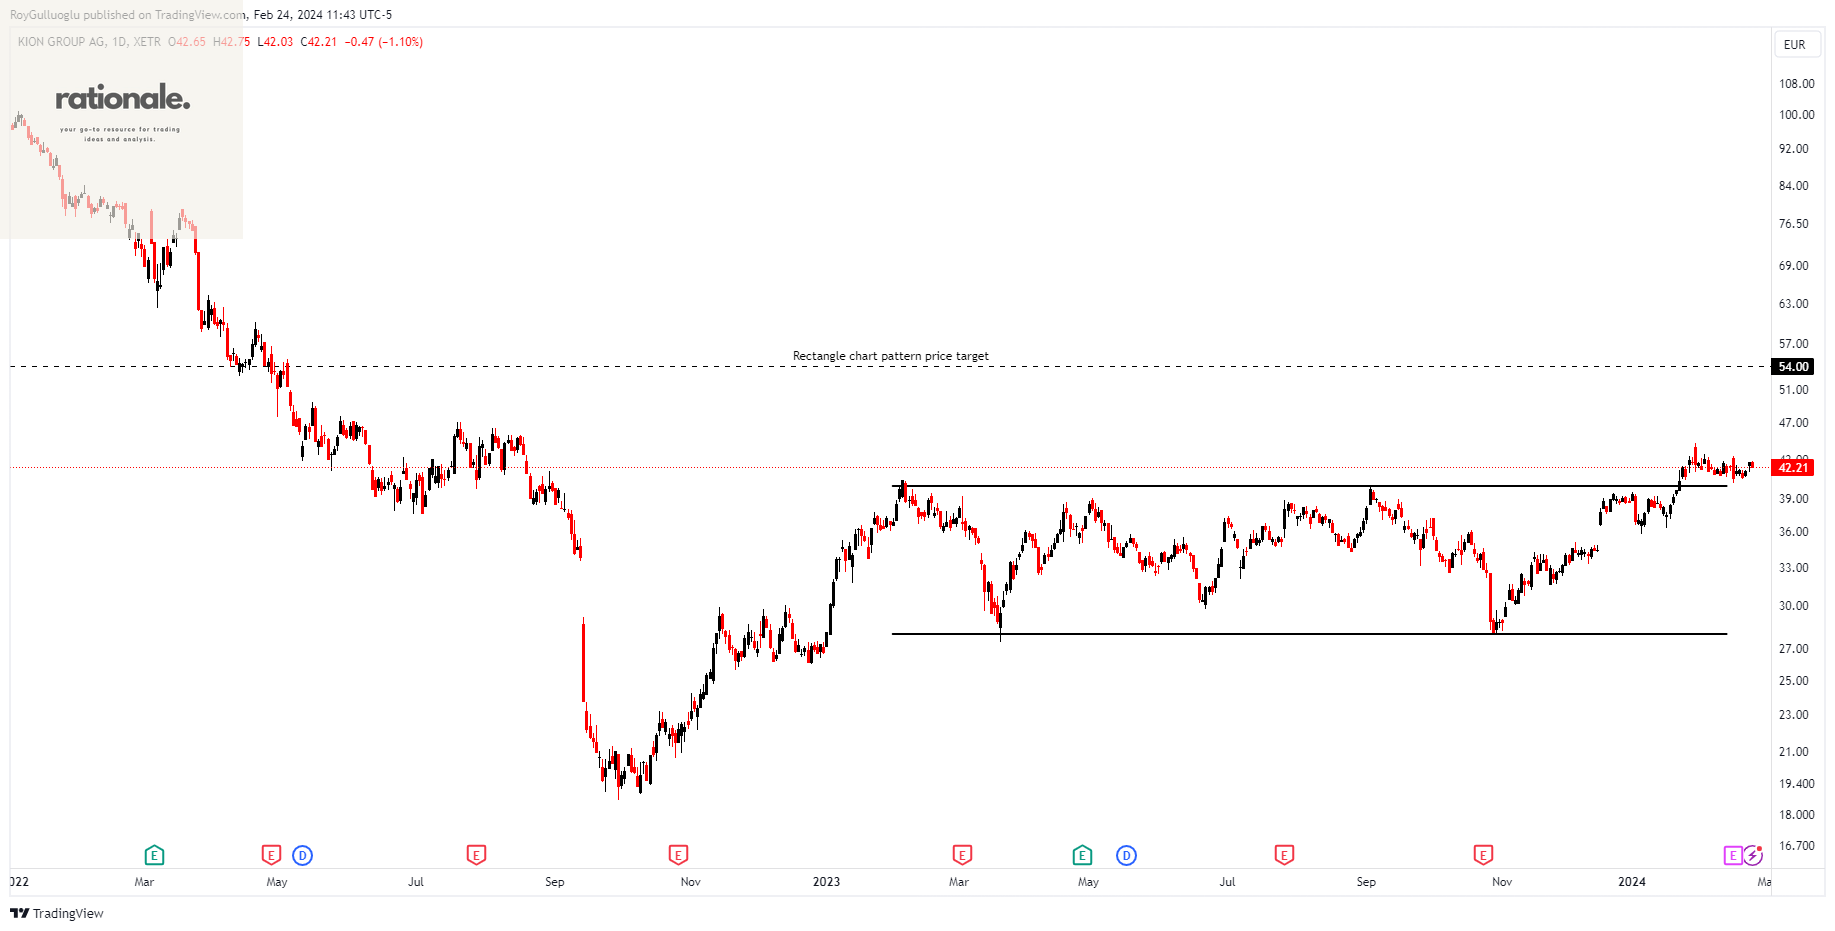
KION GROUP AG offers industrial trucks and supply chain solutions globally. The company is divided into segments, namely Industrial Trucks & Services and Supply Chain Solutions.
The above daily chart formed an approximately 8-month-long rectangle chart pattern as a bullish continuation after an uptrend.
The horizontal boundary at 40.28 levels acted as a resistance within this pattern.
A daily close above 41.48 levels validated the breakout from the 8-month-long rectangle chart pattern.
Based on this chart pattern, the potential price target is 54 levels.
KGX, classified under the "industrials" sector, falls under the “Mid Cap - Value” stock category.
Follow-ups
Ross Stores Inc.-(ROST/NASDAQ)-Long Idea
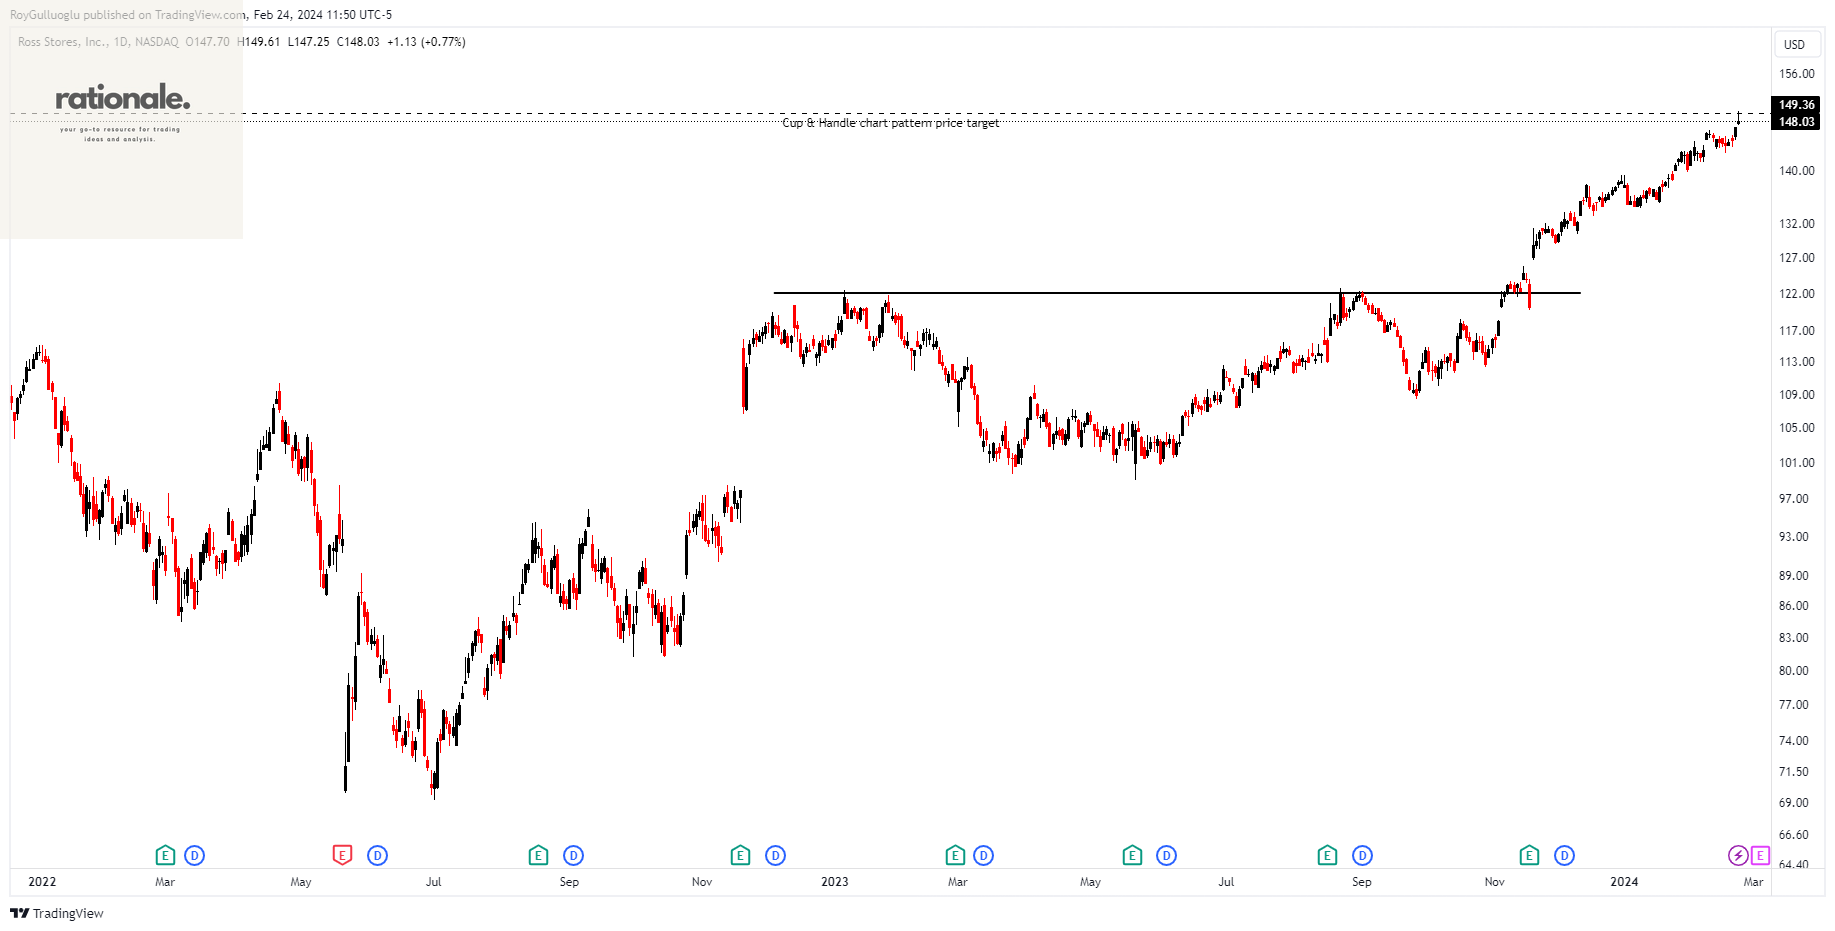
You can click the ROST ticker above to access the first report explaining the RATIONALE behind the trade idea.
The chart pattern price target is reached.
Q2 Holdings, Inc-(QTWO/NYSE)-Long Idea
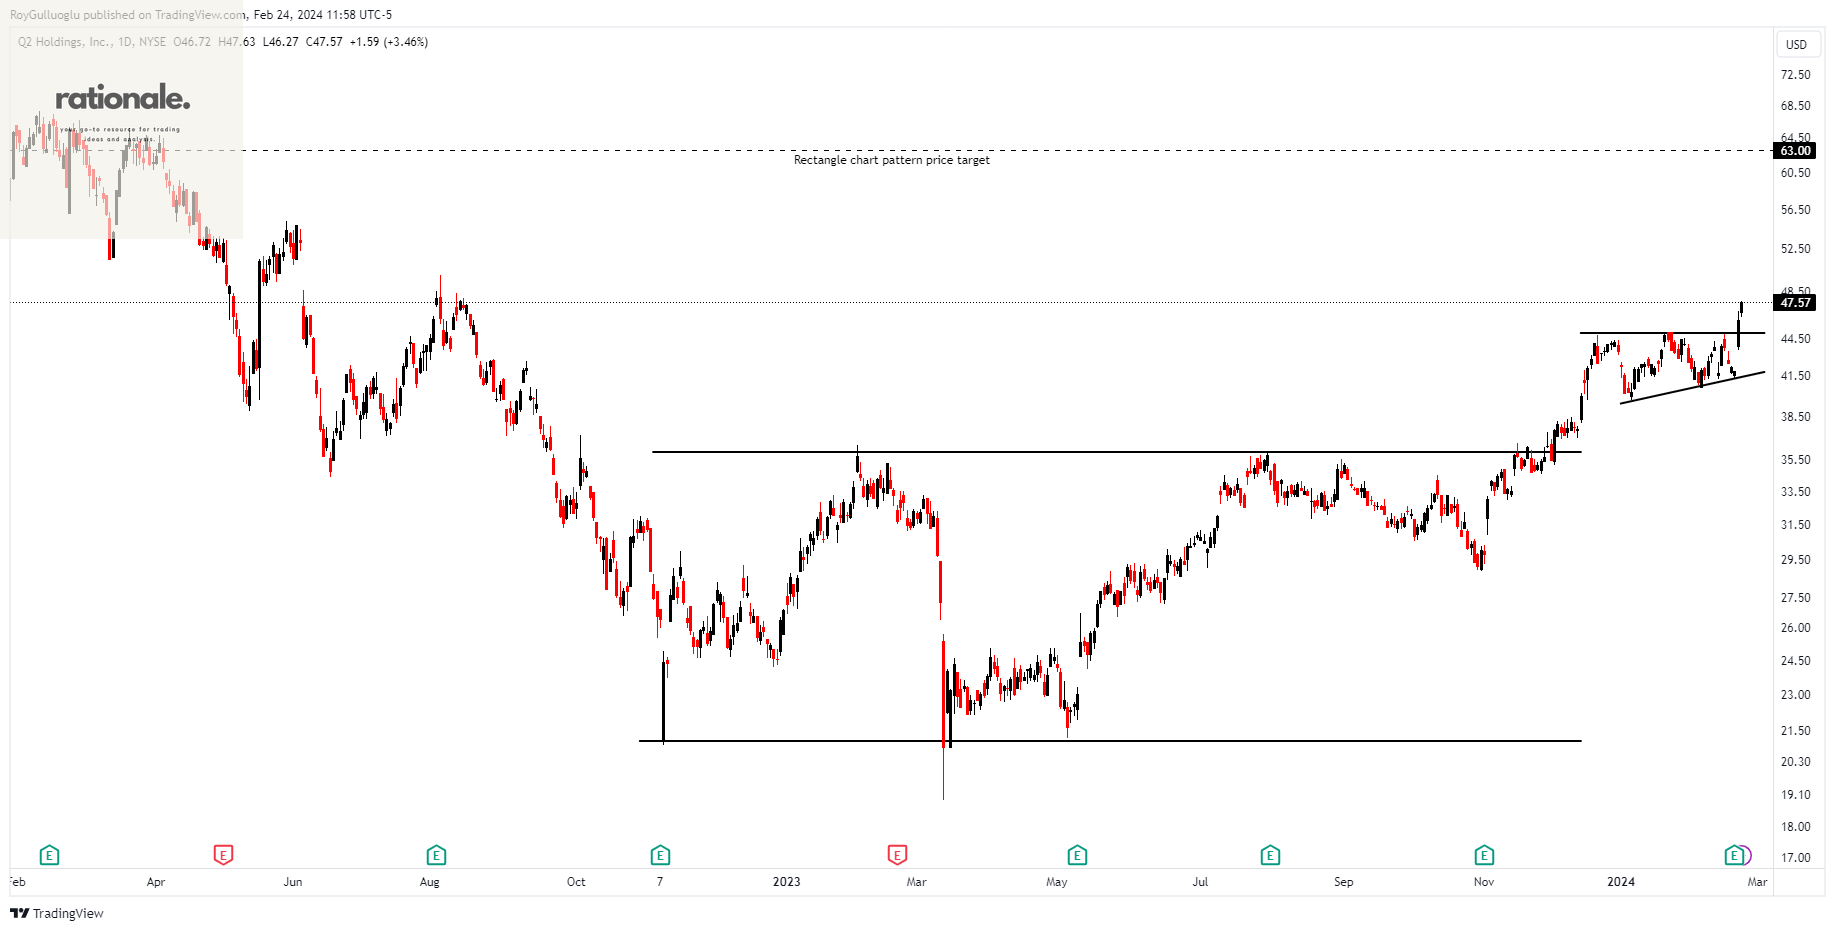
You can click the QTWO ticker above to access the first report explaining the RATIONALE behind the trade idea.
Energy Transfer LP-(ET/NYSE)-Long Idea
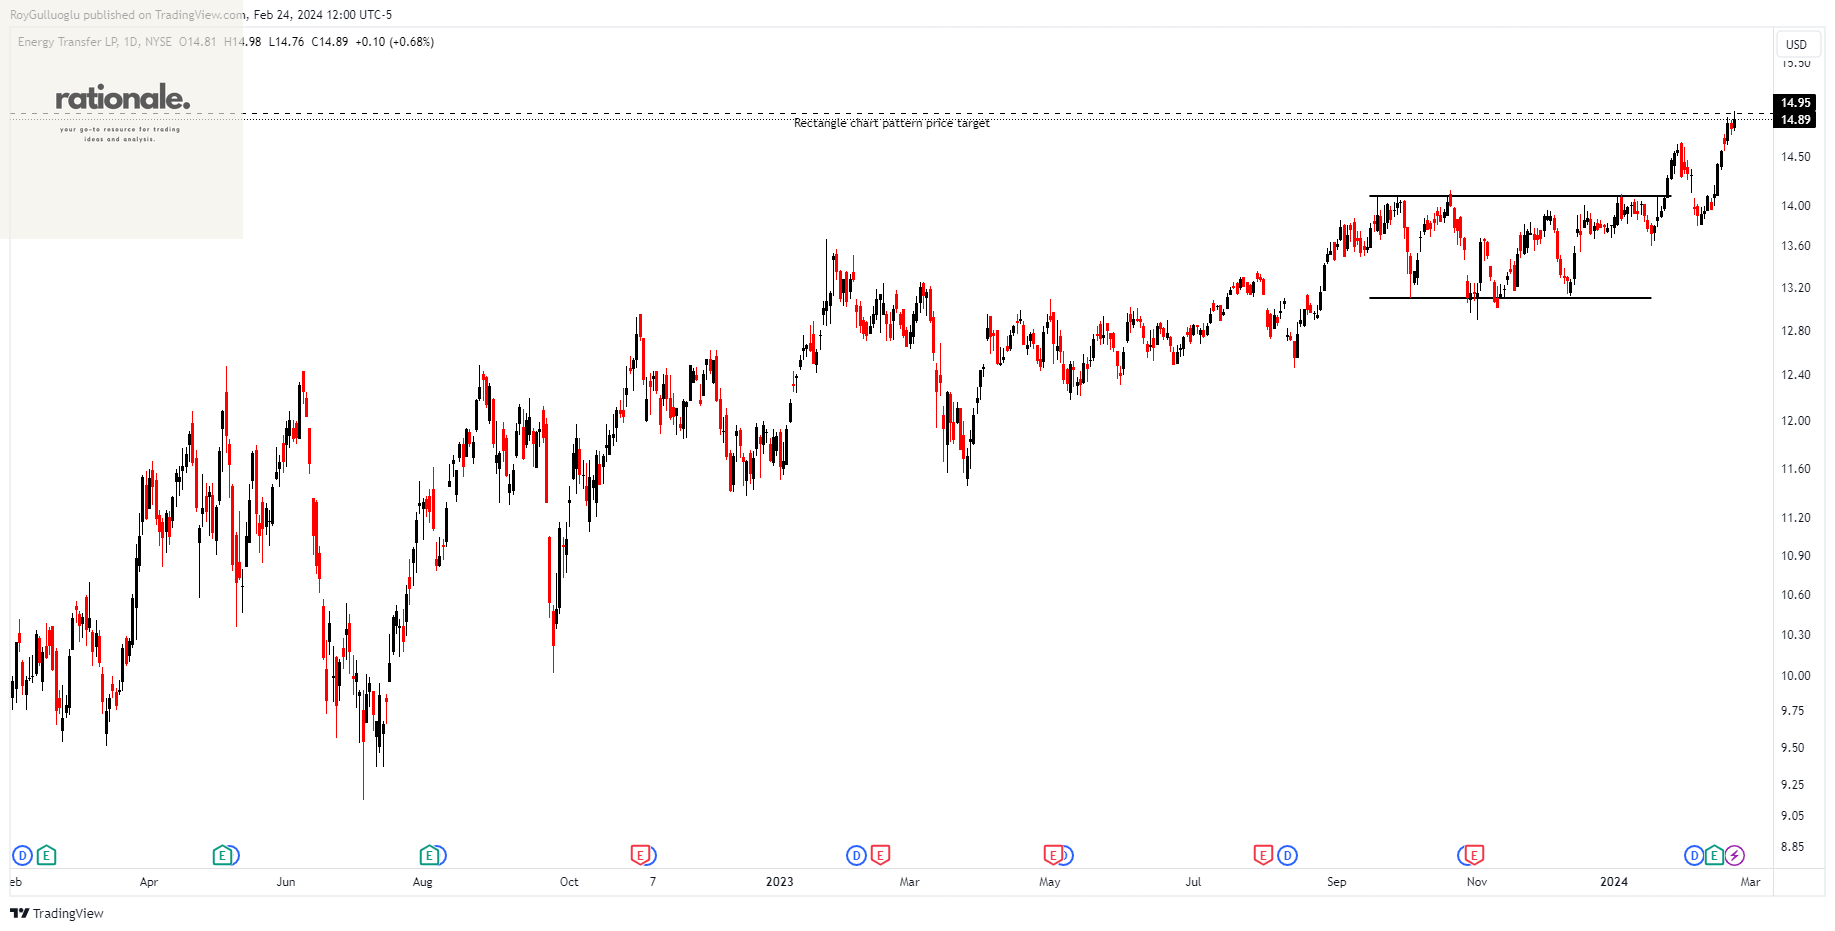
You can click the ET ticker above to access the first report explaining the RATIONALE behind the trade idea.
Weatherford International plc-(WFRD/NASDAQ)-Long Idea
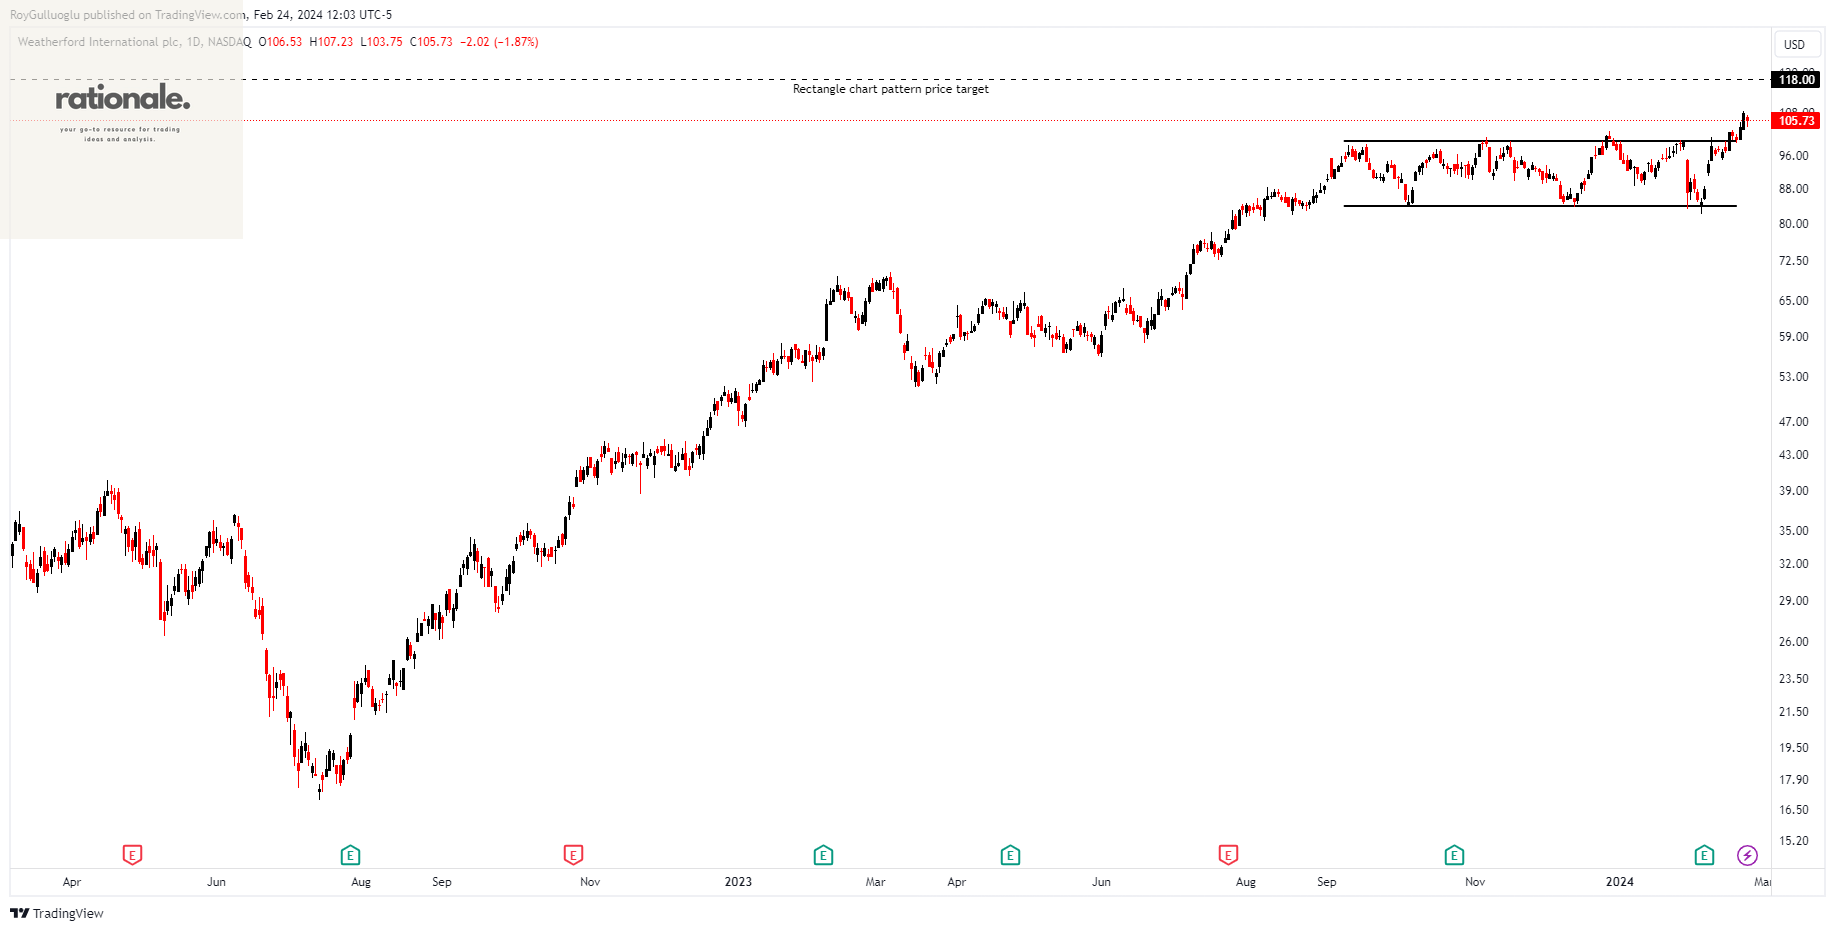
You can click the WFRD ticker above to access the first report explaining the RATIONALE behind the trade idea.