


Synchrony Financial-(SYF/NYSE)-Long Idea
Synchrony Financial, together with its subsidiaries, operates as a consumer financial services company in the United States.
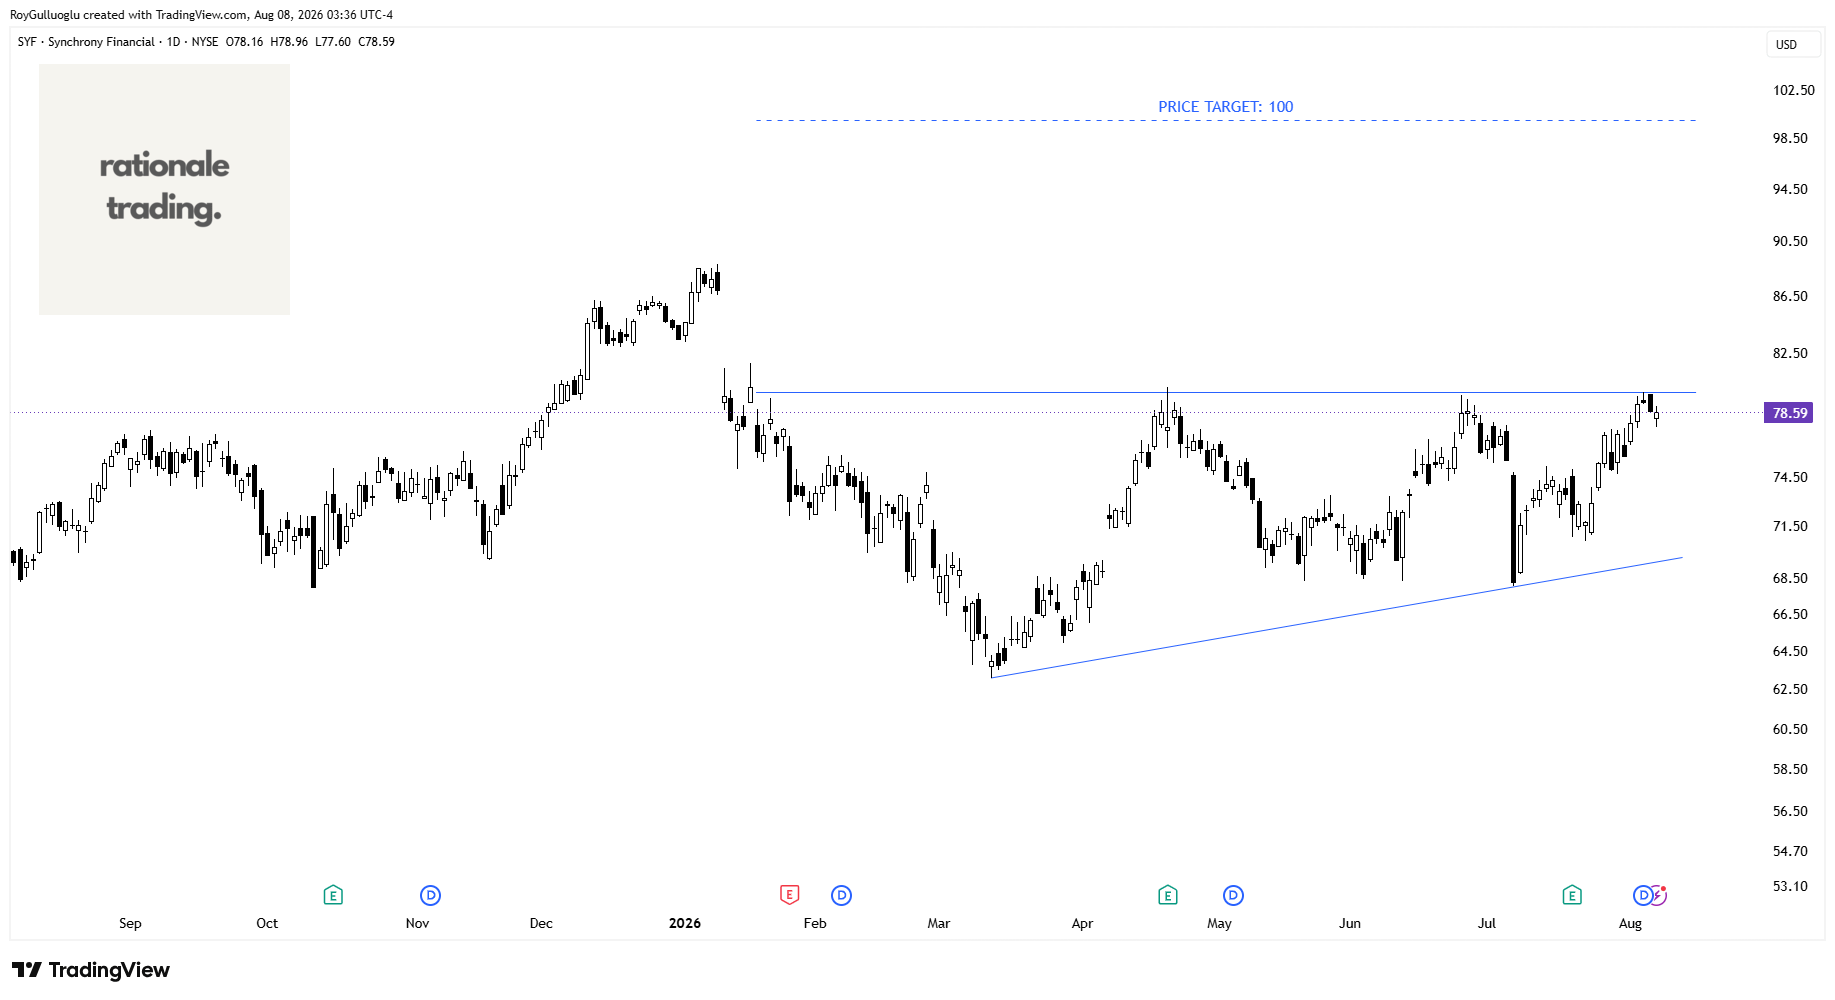
The above daily chart formed an approximately 5-month-long ascending triangle chart pattern as a bullish reversal after a downtrend.
Within this pattern, the horizontal boundary at 79.87 levels acts as a resistance.
A daily close below 82.26 levels would validate the breakout from the 5-month-long ascending triangle chart pattern.
Based on this chart pattern, the potential price target is 100 levels.
Ambarella, Inc.-(AMBA/NASDAQ)-Long Idea
Ambarella, Inc. develops low-power system-on-a-chip, semiconductors, and software for edge and physical artificial intelligence, applications, and intelligent automation.
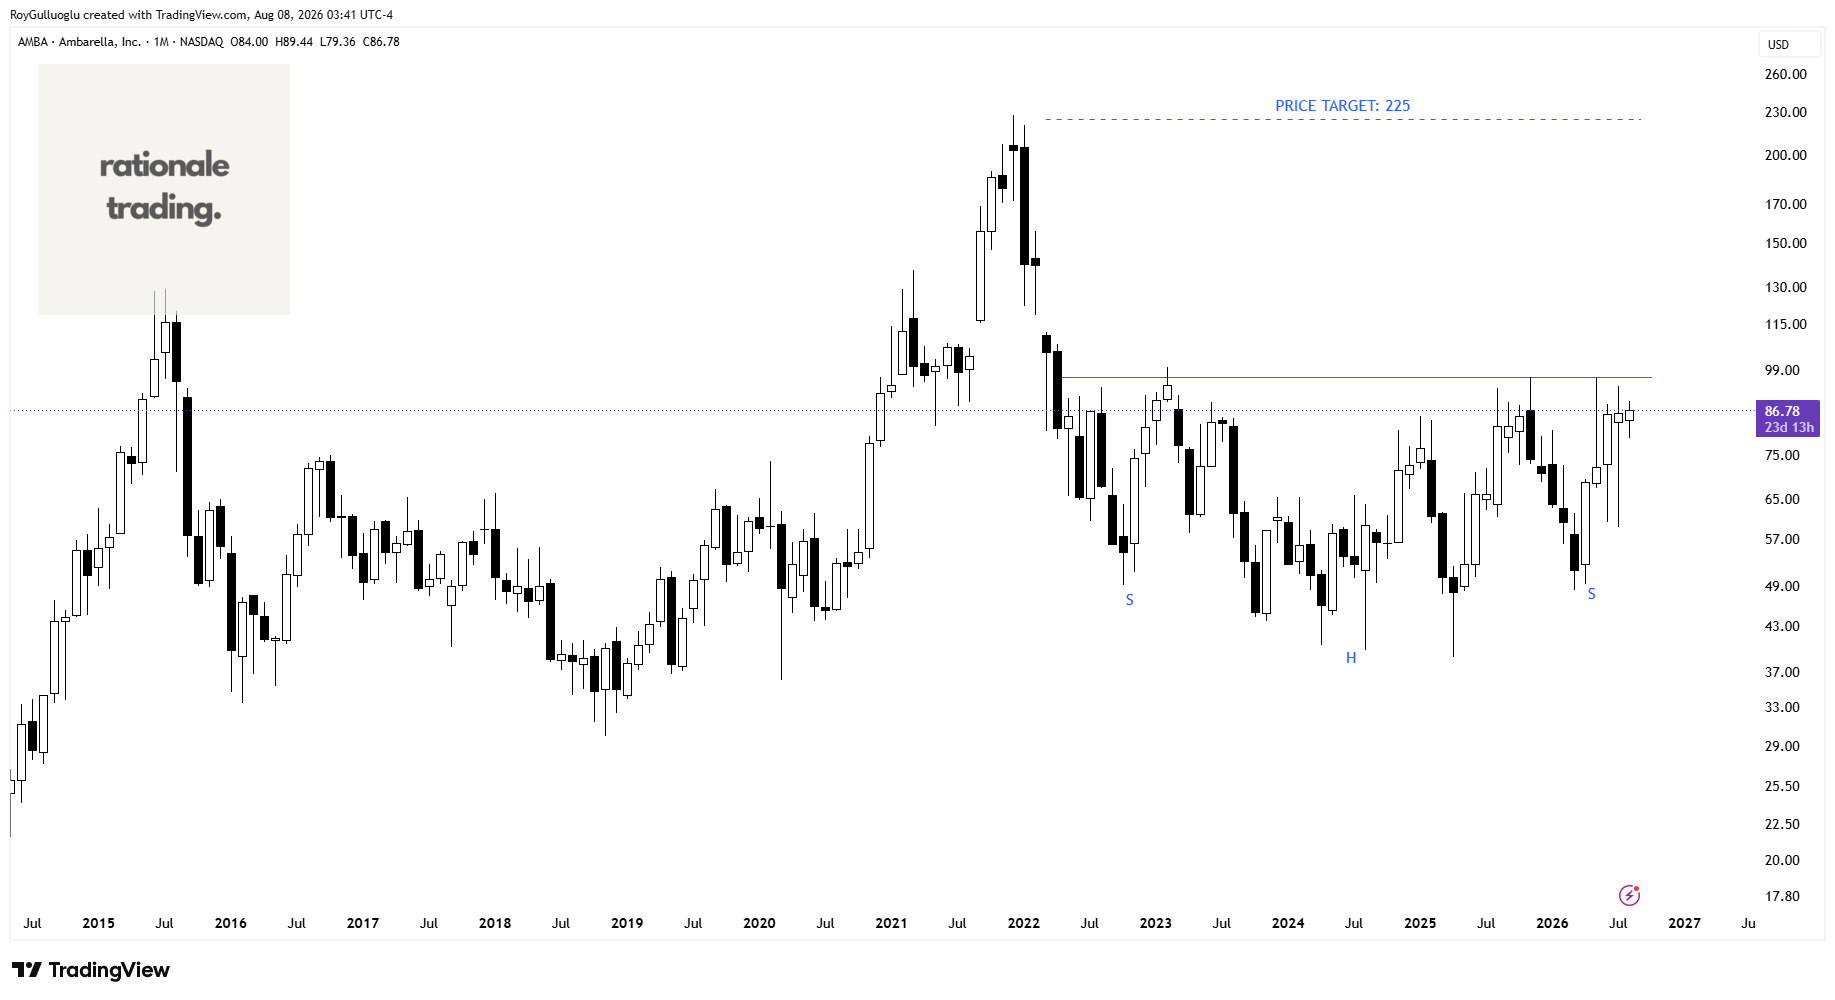
The above monthly chart formed an approximately 3-year-long H&S bottom chart pattern as a bullish reversal after a downtrend.
A daily close above 99.59 levels would validate the breakout from the 3-year-long H&S bottom chart pattern.
Based on this chart pattern, the potential price target is 225 levels.
Carvana Co.-(CVNA/NYSE)-Long/Short Idea
Carvana Co., together with its subsidiaries, operates an e-commerce platform for buying and selling used cars.
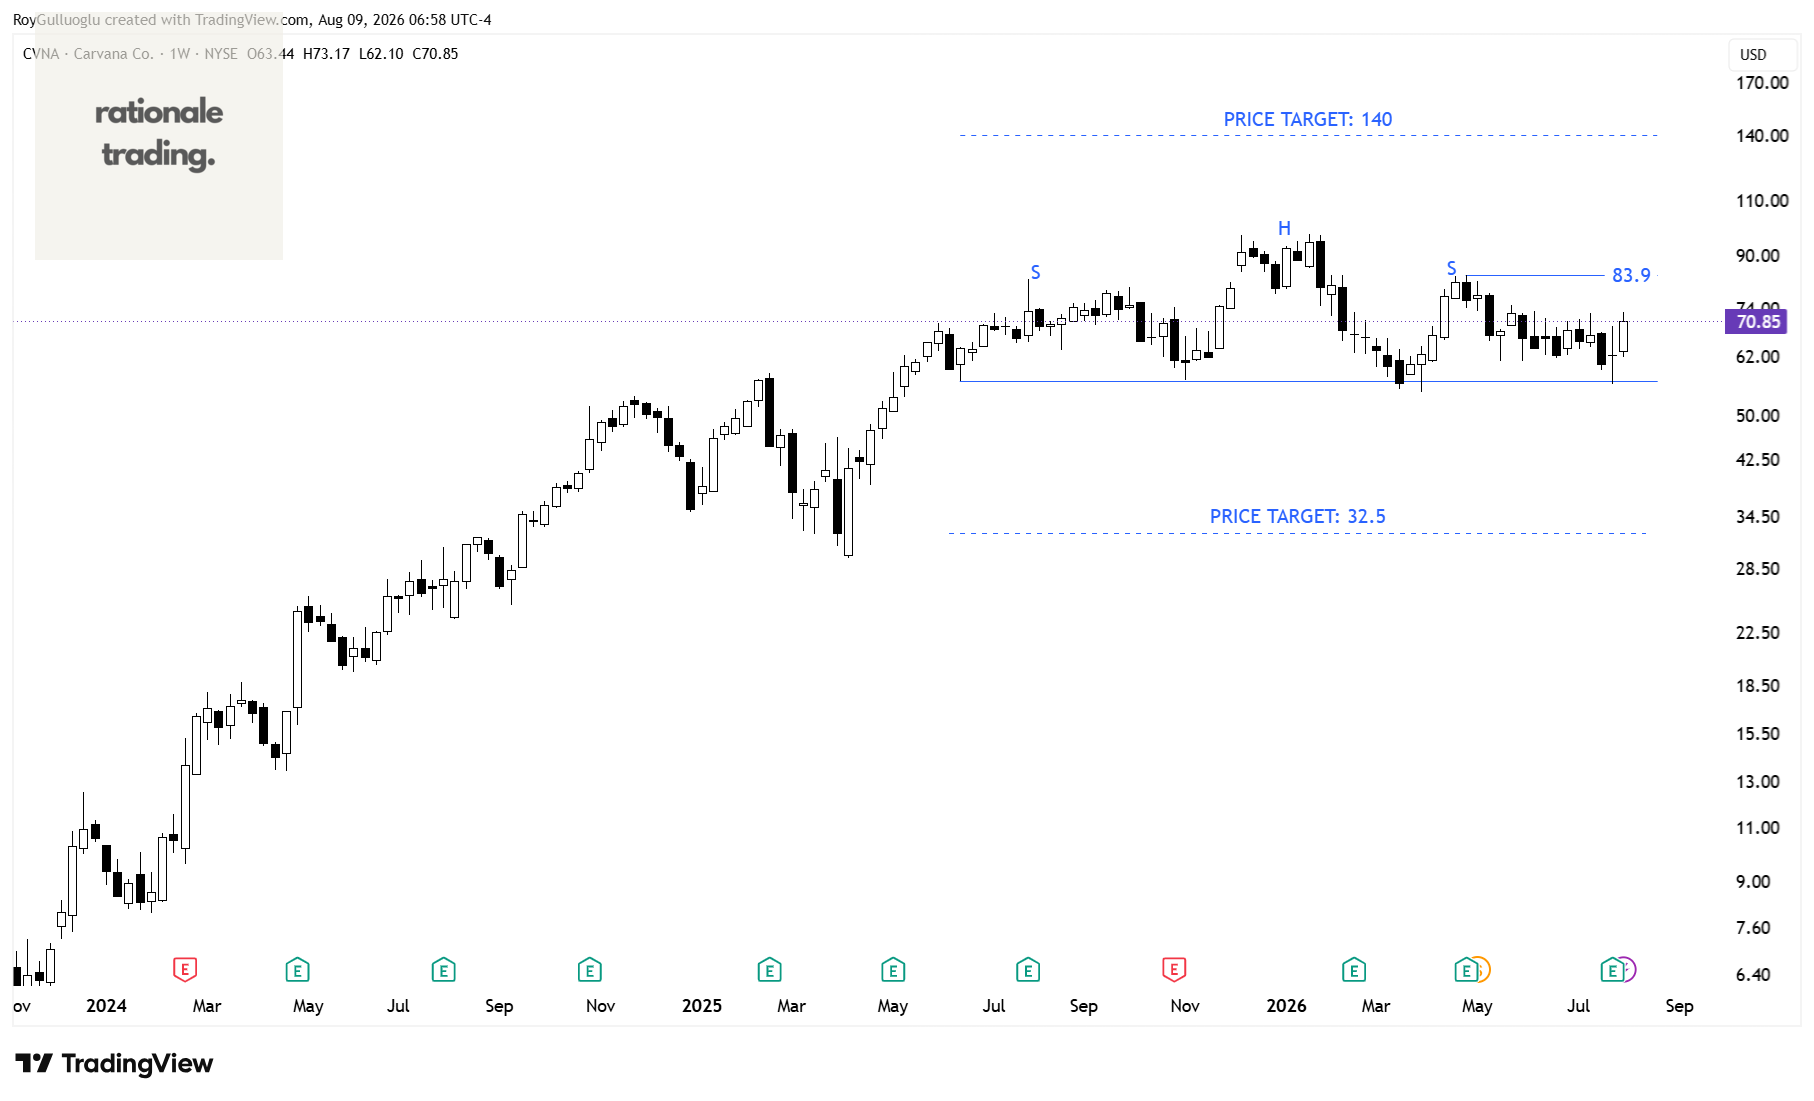
The above weekly chart formed an approximately 15-month-long H&S top chart pattern.
Within this pattern, the horizontal boundary at 83.9 levels acts as a resistance and 56.73 acts as a support.
A daily close above 86.4 levels would validate the breakout and a daily close below 55 would validate the breakdown from the 15-month-long H&S top chart pattern..
Based on these chart patterns, the potential price targets are 32.5 and 140 levels.
Steven Madden, Ltd.-(SHOO/NASDAQ)-Long Idea
Steven Madden, Ltd. designs, sources, and markets fashion-forward branded and private label footwear, accessories, and apparel in the United States and internationally.
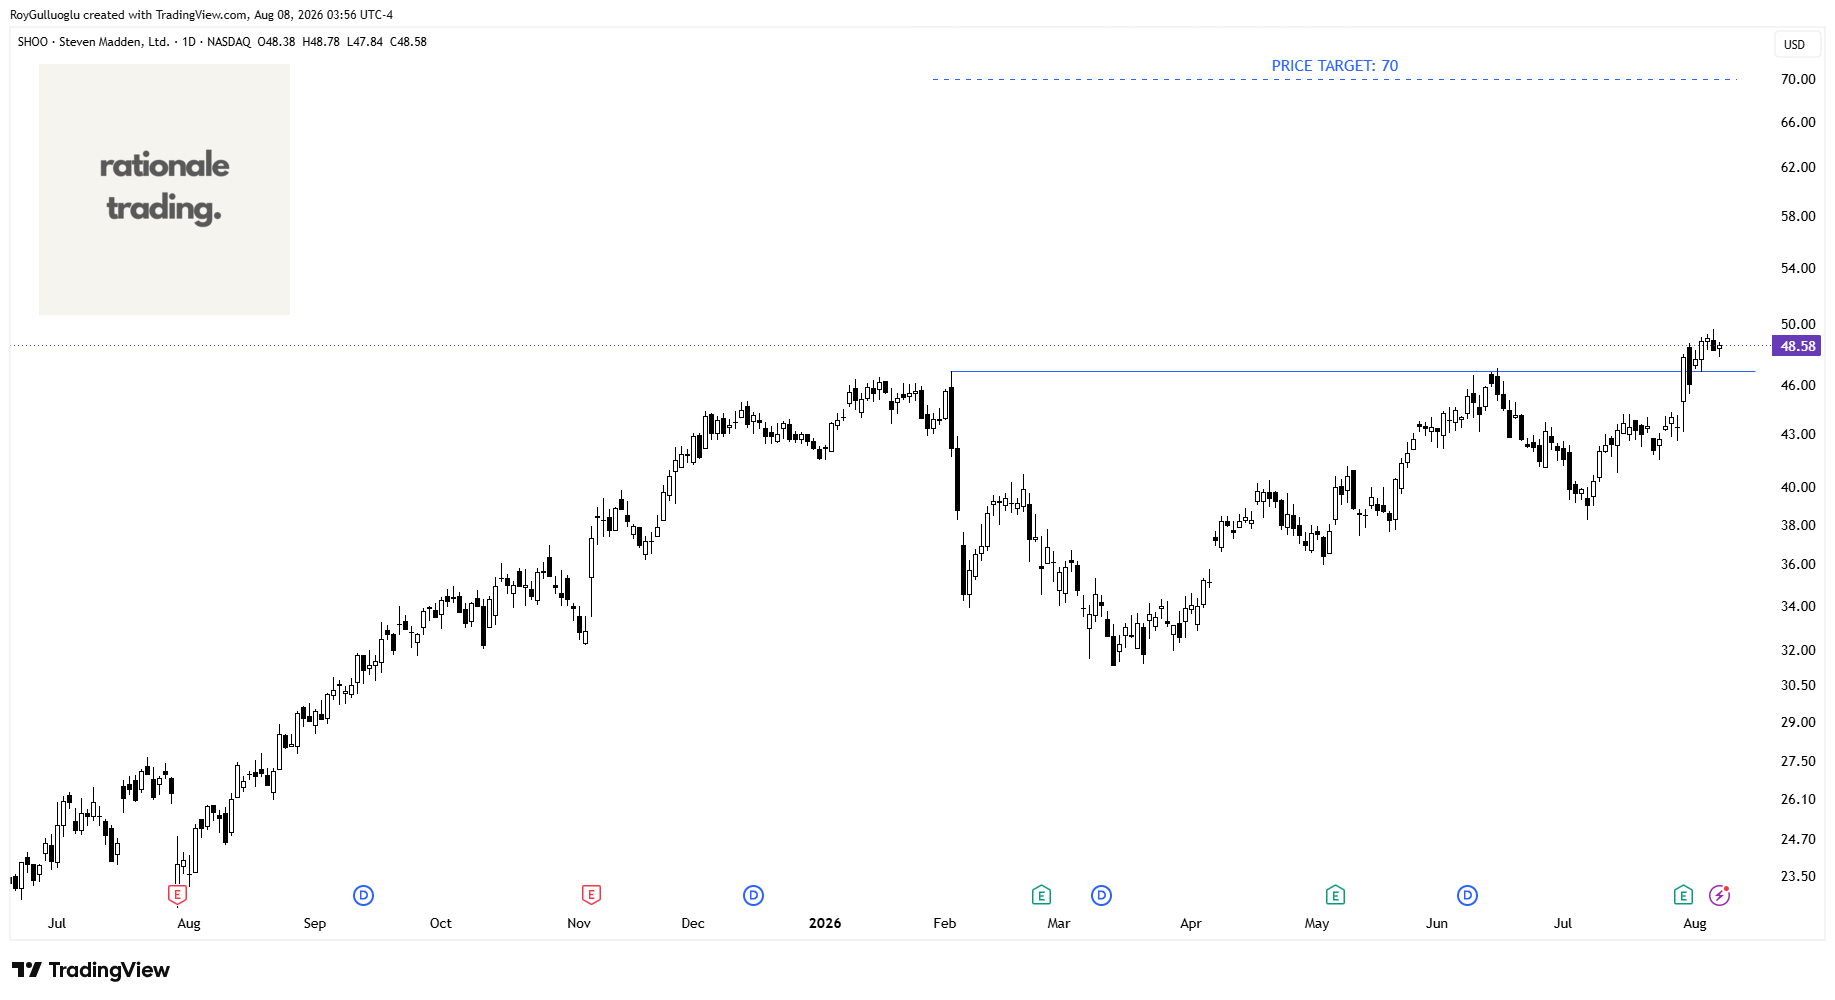
The above daily chart formed an approximately 4-month-long cup & handle chart pattern as a bullish continuation after an uptrend.
Within this pattern, the horizontal boundary at 46.88 levels acted as a resistance.
A daily close above 48.28 levels validated the breakout from the 4-month-long cup & handle chart pattern.
Based on this chart pattern, the potential price target is 70 levels.
Berkshire Hathaway Inc.-(BRK.B/NYSE)-Long Idea
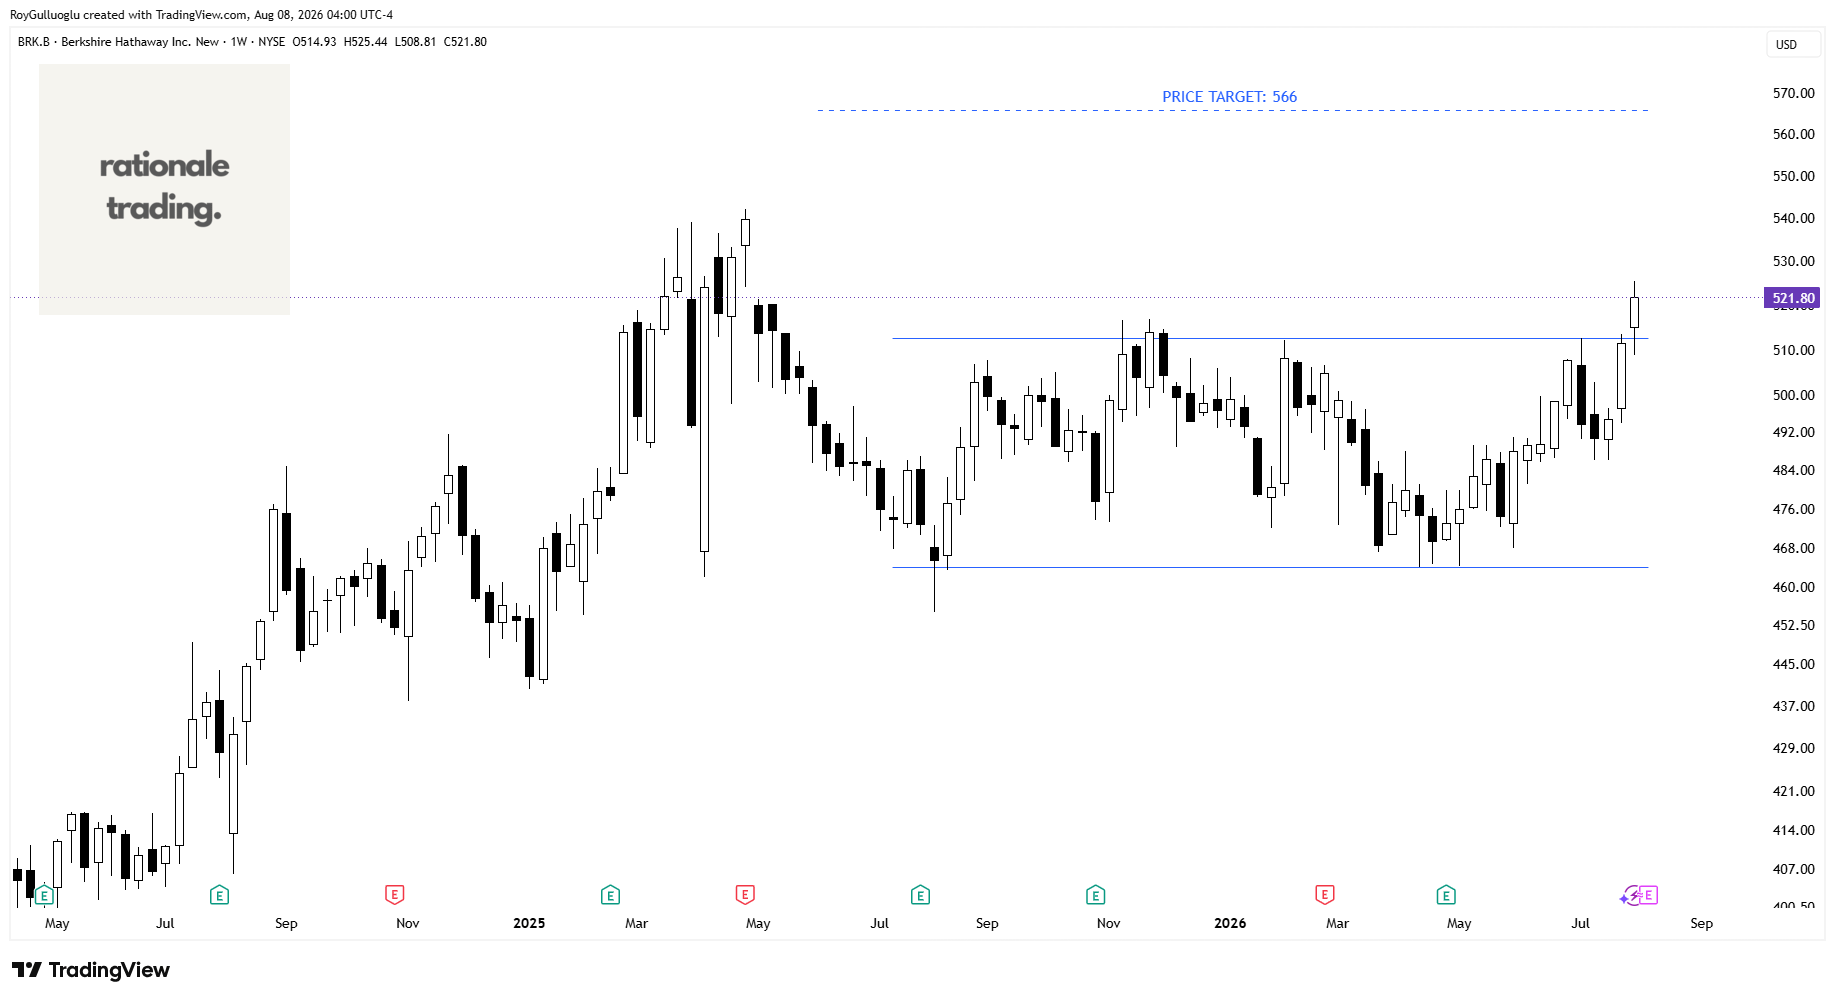
Berkshire Hathaway Inc., together with its subsidiaries, engages in the insurance, freight rail transportation, and utility businesses.
The above daily chart formed an approximately 12-month-long rectangle chart pattern as a bullish reversal after an downtrend.
Within this pattern, the horizontal boundary at 512.58 levels acts as a resistance.
A daily close above 527.95 levels would validate the breakout from the 12-month-long rectangle chart pattern.
Based on this chart pattern, the potential price target is 566 levels.
Dollar General Corporation-(DG/NYSE)-Long Idea
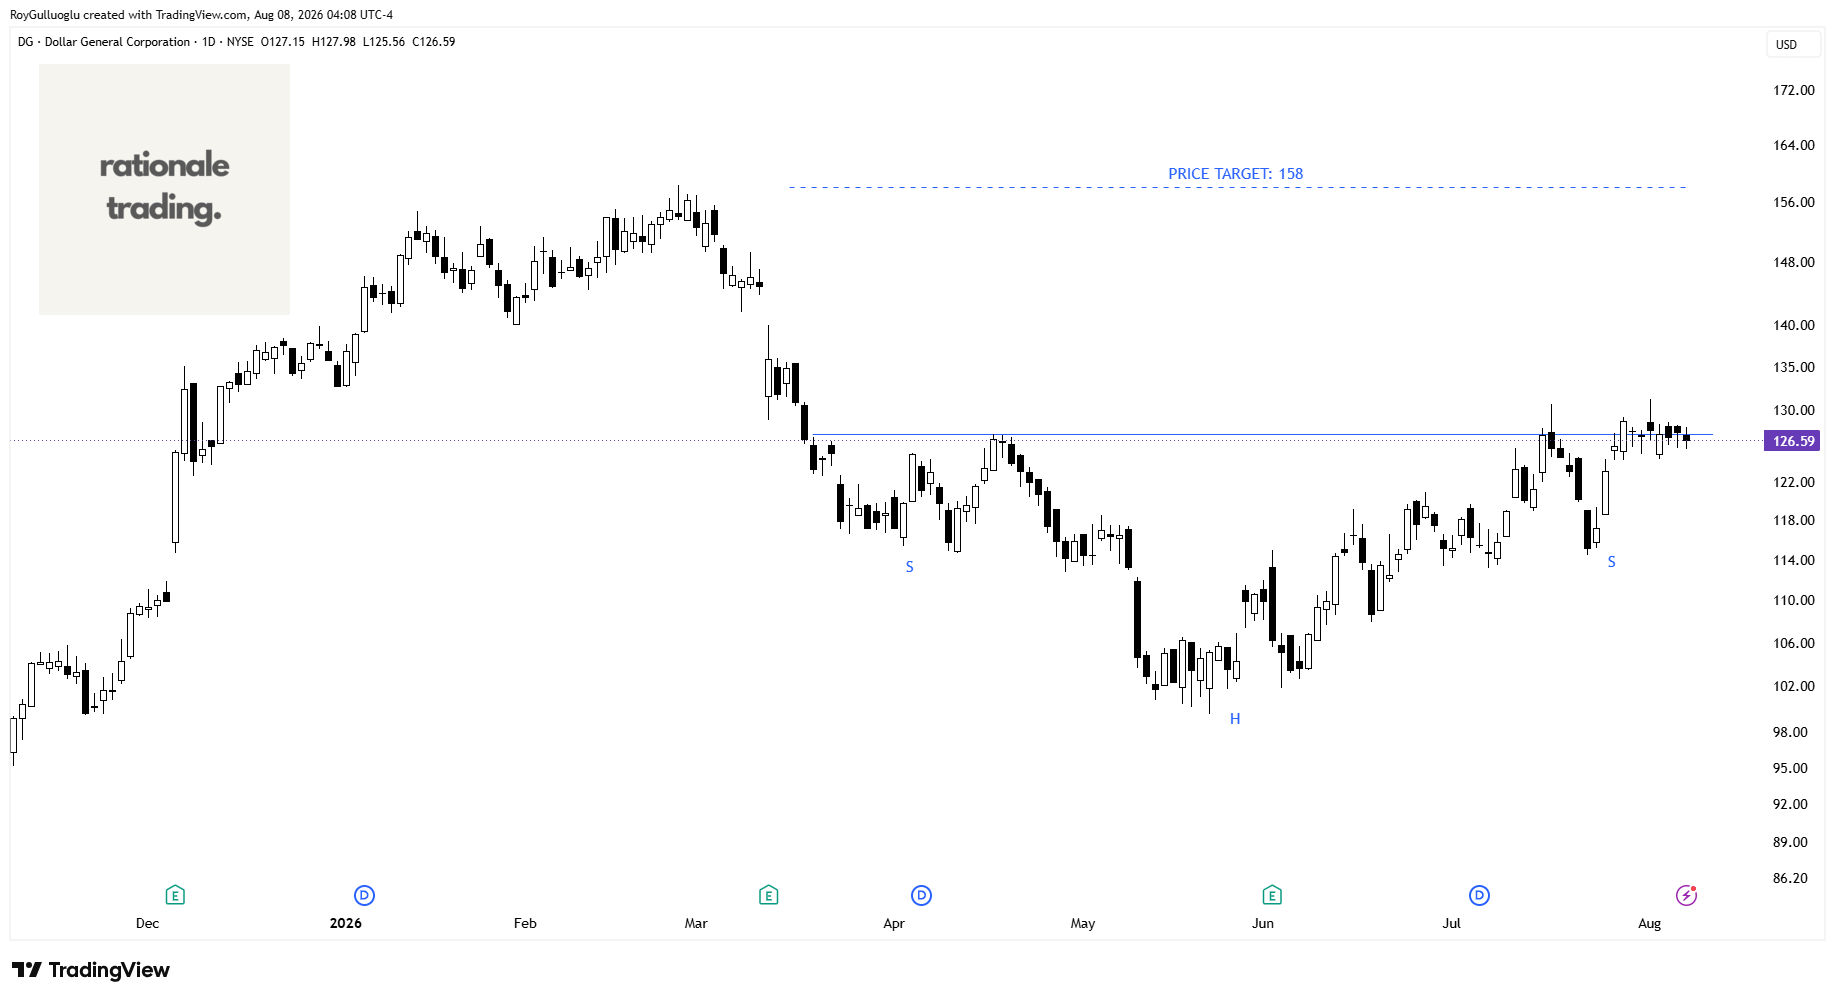
Dollar General Corporation, a discount retailer, provides various merchandise products in the southern, southwestern, midwestern, and eastern United States.
The above daily chart formed an approximately 3-month-long H&S bottom chart pattern as a bullish reversal after a downtrend.
Within this pattern, the horizontal boundary at 127.26 levels acts as a resistance.
A daily close above 131 levels would validate the breakout from the 3-month-long H&S bottom chart pattern.
Based on this chart pattern, the potential price target is 158 levels.
monday.com Ltd.-(MNDY/NASDAQ)-Long Idea
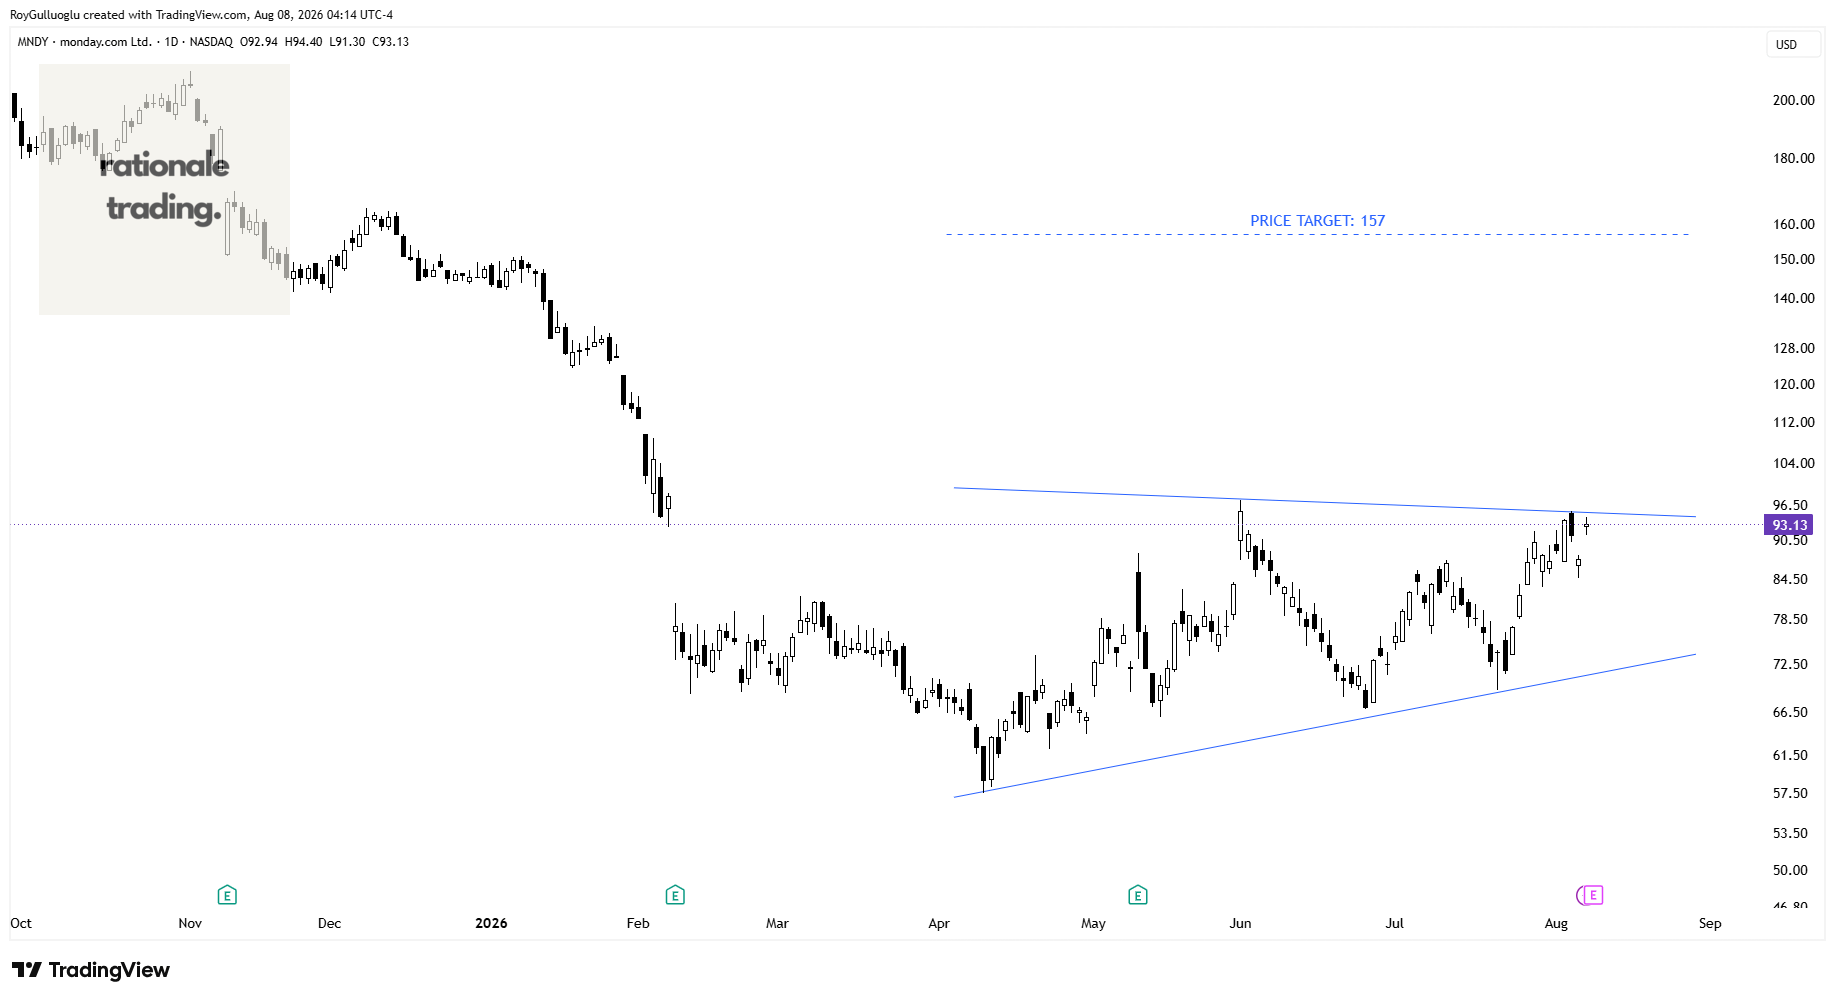
monday.com Ltd., together with its subsidiaries, develops software applications in the United States, Europe, the Middle East, Africa, the United Kingdom, and internationally.
The above daily chart formed an approximately 3-month-long symmetrical triangle chart pattern.
A daily close above 98.33 levels would validate the breakout from the 3-month-long symmetrical triangle chart pattern.
Based on this chart pattern, the potential price target is 157 levels.
Hi Roy, quick question regarding CVNA - in the event of H&S failure, would a breach of 86.42 (3% penetration of 84.90) and a target of approx 140 be your read?
Hi thank you for your great work! What is your rule for setting stop losses?