


New setups
TICKERS: CCJ(NYSE), CHK(NASDAQ), AR(NYSE), EQT(NYSE), BIMAS(BIST), ANHYT(BIST), HSBA(LSE), ENEV3(BOVESPA), 941(HKEX), 9896(HKEX)
Cameco Corporation-(CCJ/NYSE)-Long Idea
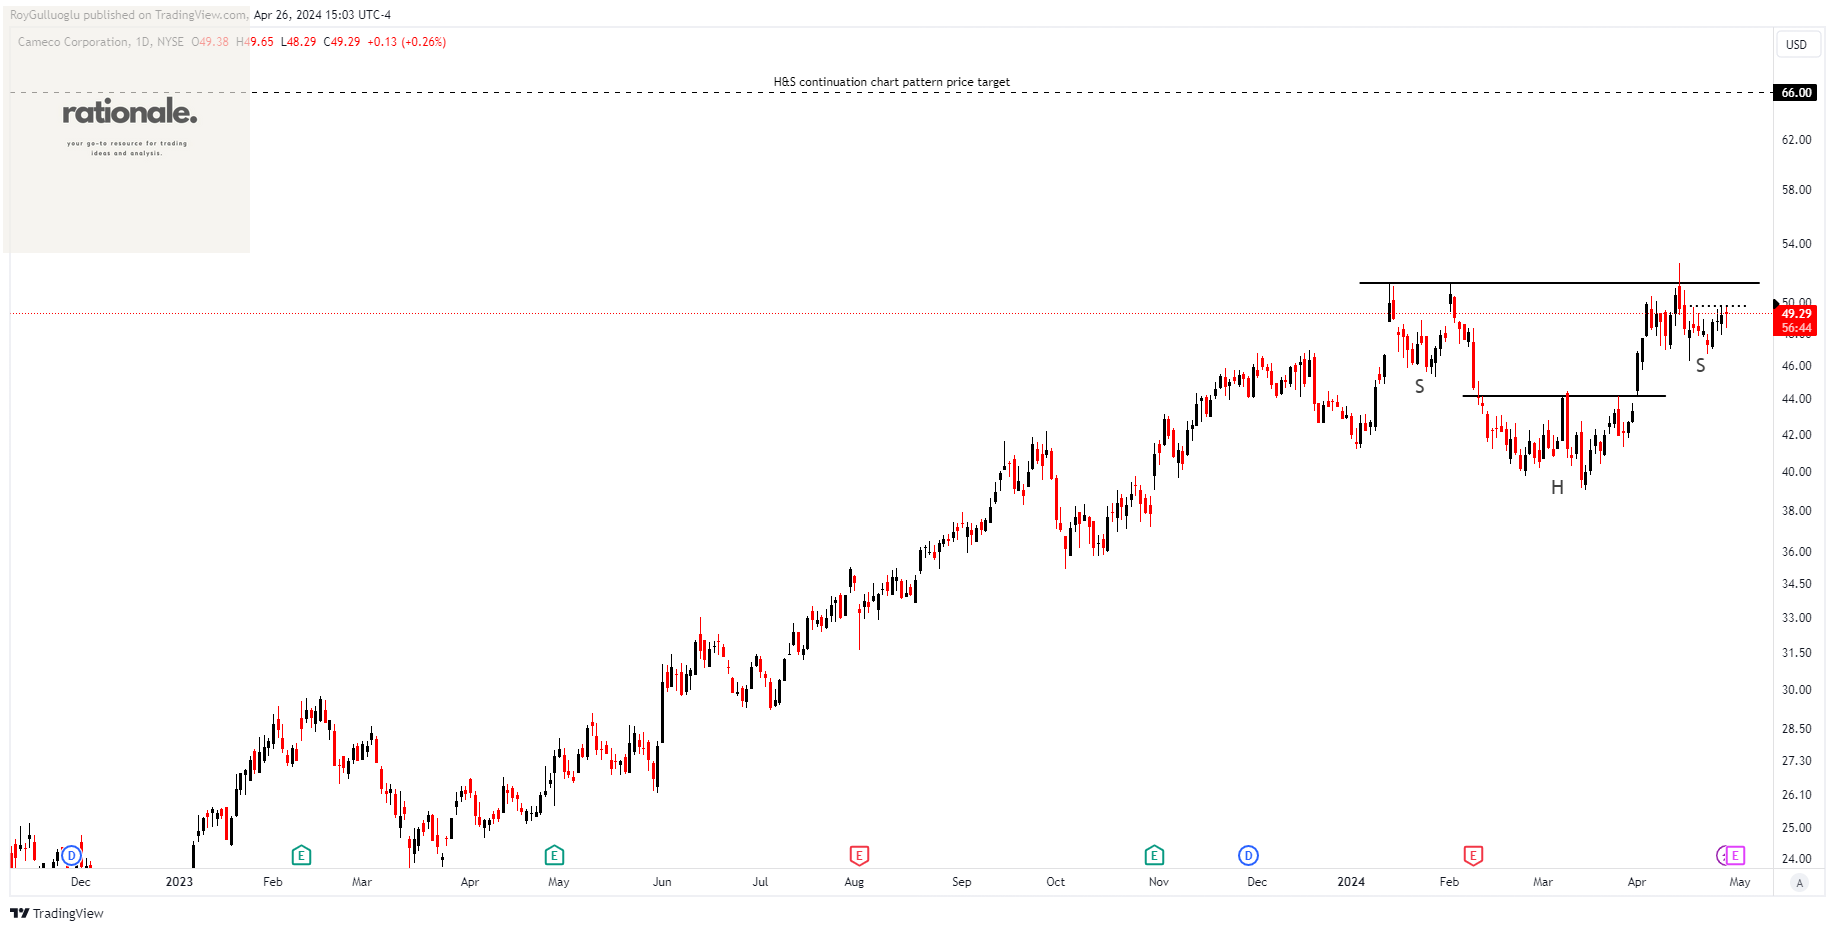
Cameco Corporation supplies uranium for electricity generation and operates through segments including Uranium, Fuel Services, and Westinghouse.
The above daily chart formed an approximately 3-month-long H&S continuation chart pattern as a bullish continuation after an uptrend.
The horizontal boundary at 51.28 levels acts as a support within this pattern.
A daily close below 52.8 levels would validate the breakdown from the 3-month-long H&S continuation chart pattern.
Based on this chart pattern, the potential price target is 66 levels.
CCJ, classified under the "energy" sector, falls under the “Large Cap - Income” stock category.
Chesapeake Energy Corporation-(CHK/NASDAQ)-Long Idea
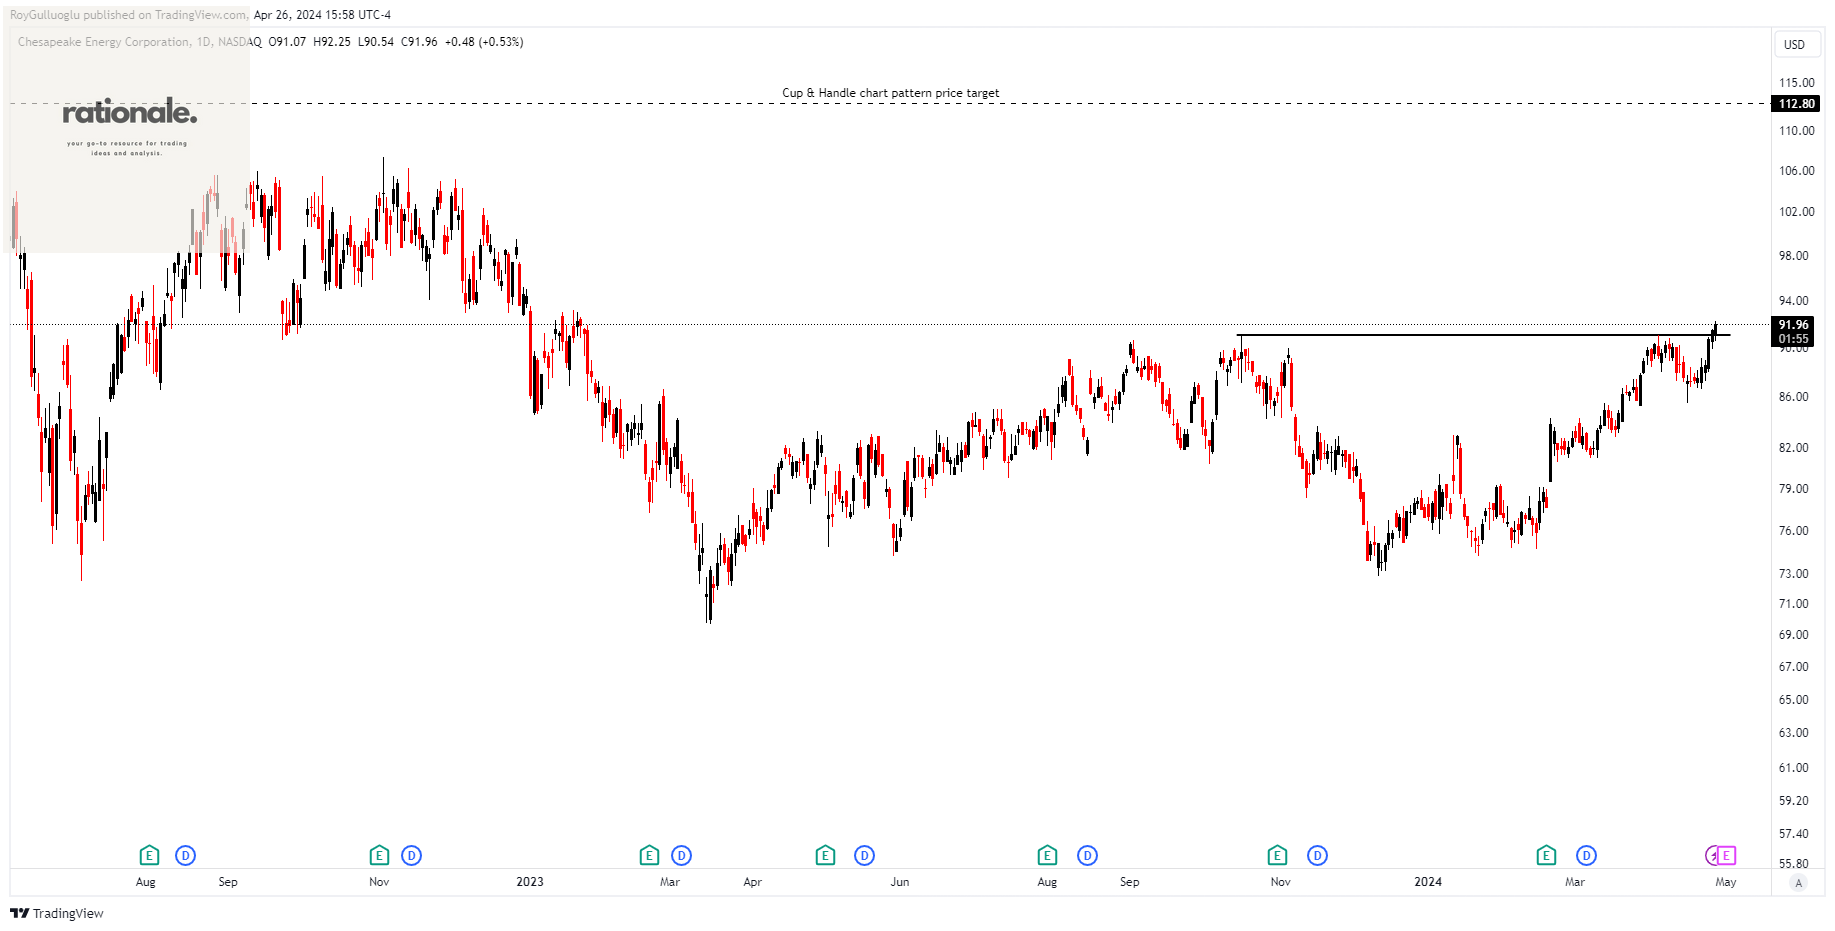
Chesapeake Energy Corporation functions as a standalone exploration and production entity within the United States. Its activities encompass acquiring, exploring, and developing properties aimed at extracting oil, natural gas, and natural gas liquids from subterranean reservoirs.
The above weekly chart formed an approximately 4-month-long Cup & Handle chart pattern as a bullish continuation after an uptrend.
The horizontal boundary at 91 levels acts as a support within this pattern.
A daily close above 93.73 levels would validate the breakout from the 4-month-long Cup & Handle chart pattern.
Based on this chart pattern, the potential price target is 112.8 levels.
CHK, classified under the "energy" sector, falls under the “Large Cap - Income” stock category.
Antero Resources Corporation.-(AR/NYSE)-Long Idea
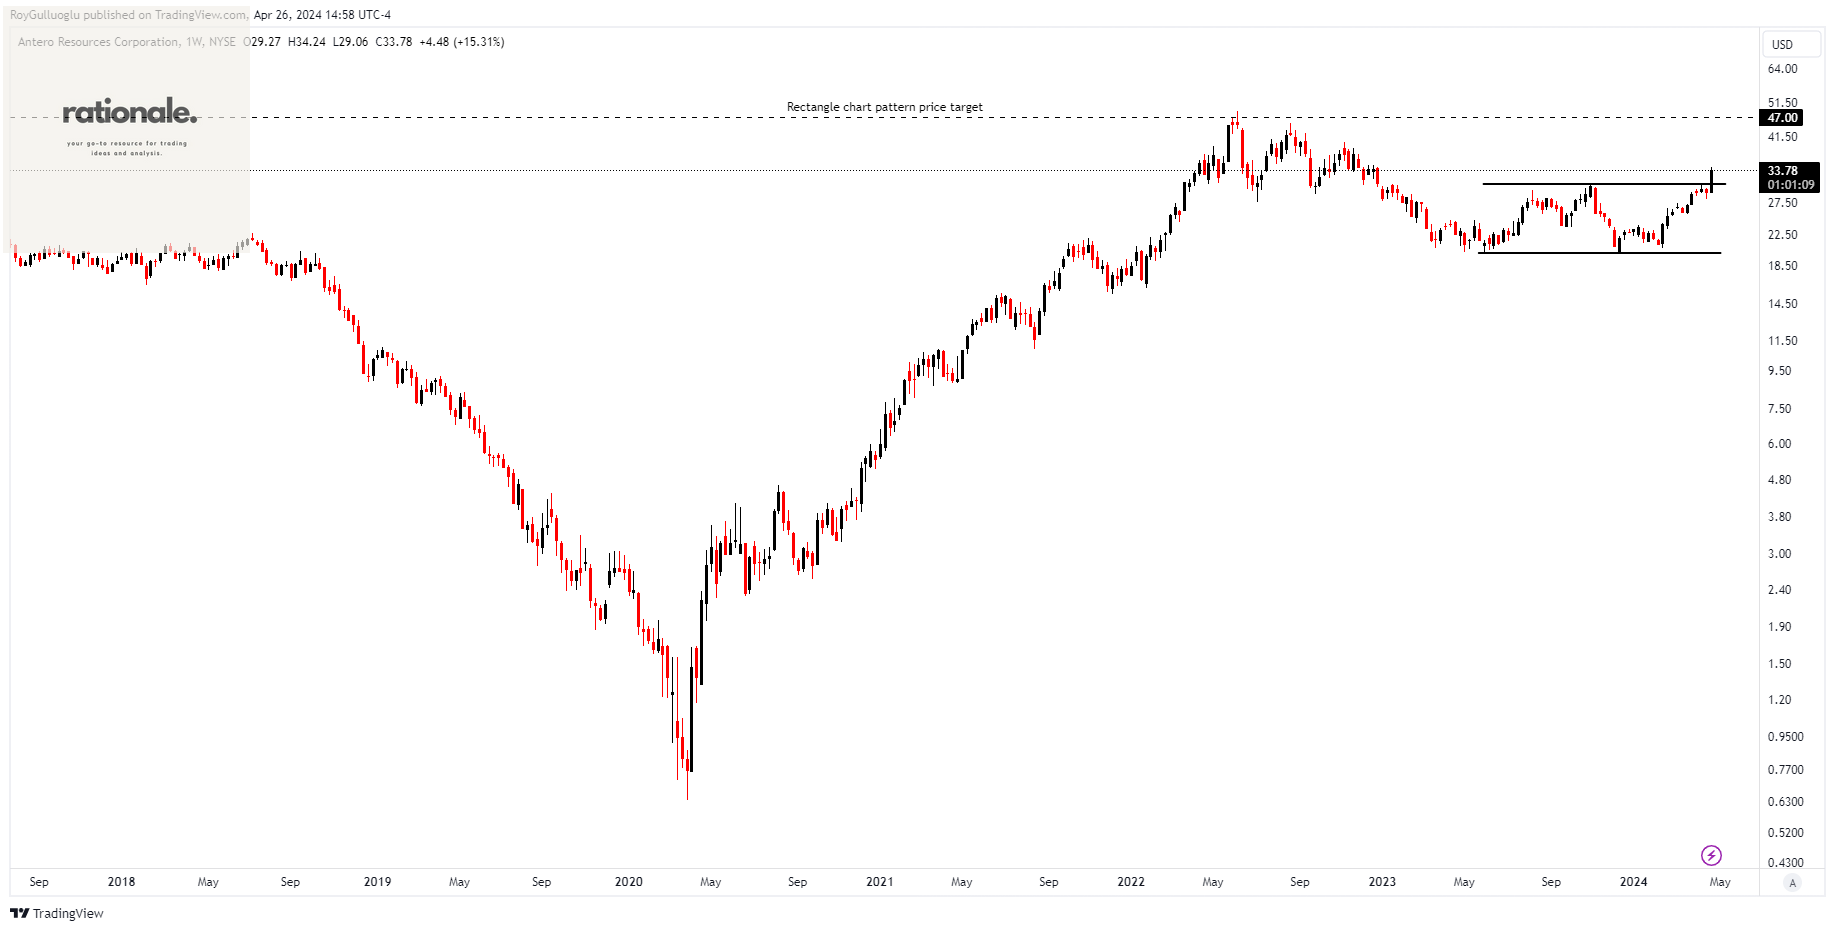
Antero Resources Corporation, an independent oil and natural gas firm, focuses on the development, production, exploration, and acquisition of natural gas, natural gas liquids (NGLs), and oil assets within the United States.
The above weekly chart formed an approximately 10-month-long rectangle chart pattern as a bullish reversal after a downtrend.
The horizontal boundary at 30.9 levels acted as a support within this pattern.
A daily close above 31.82 levels validated the breakout from the 10-month-long rectangle chart pattern.
Based on this chart pattern, the potential price target is 47 levels.
AR, classified under the "energy" sector, falls under the “Large Cap - Income” stock category.
EQT Corporation-(EQT/NYSE)-Long Idea
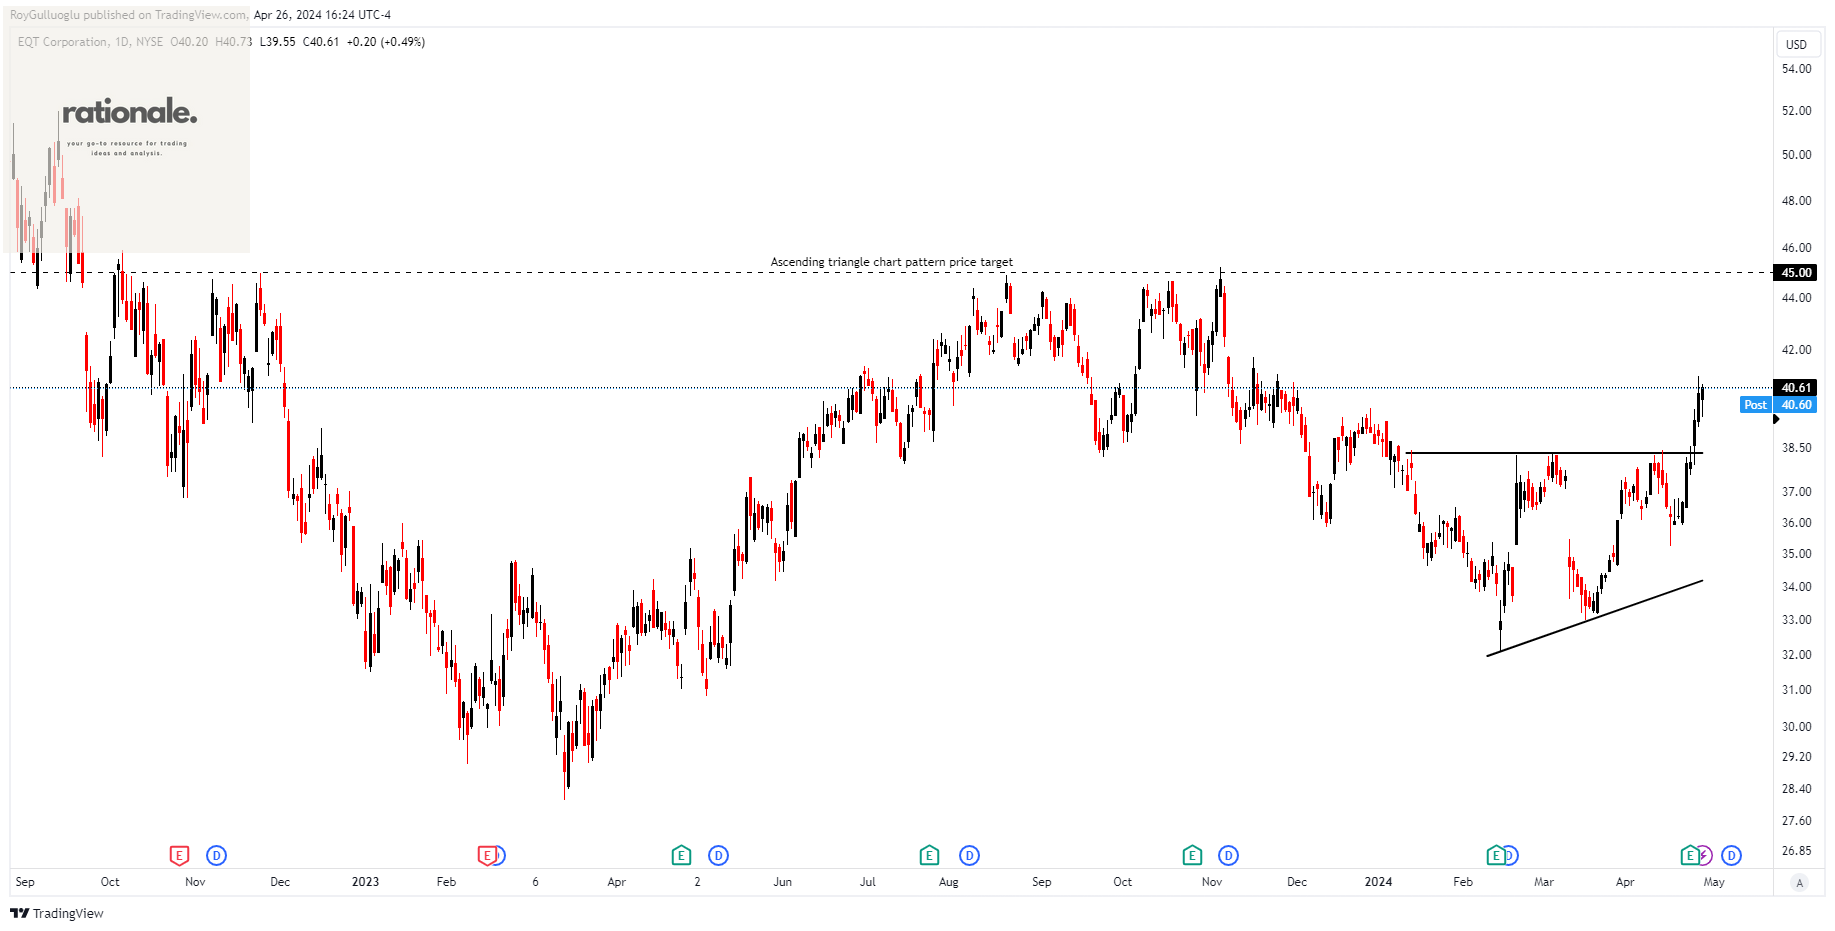
EQT Corporation functions as a company specializing in natural gas production within the United States.
The above daily chart formed an approximately 3-month-long ascending triangle chart pattern as a bullish reversal after a downtrend.
The horizontal boundary at 30.9 levels acted as a support within this pattern.
A daily close above 39.45 levels validated the breakout from the 3-month-long ascending triangle chart pattern.
Based on this chart pattern, the potential price target is 45 levels.
EQT, classified under the "energy" sector, falls under the “Large Cap - Income” stock category.
BIM Birlesik Magazalar A.S.-(BIMAS/BIST)-Long Idea
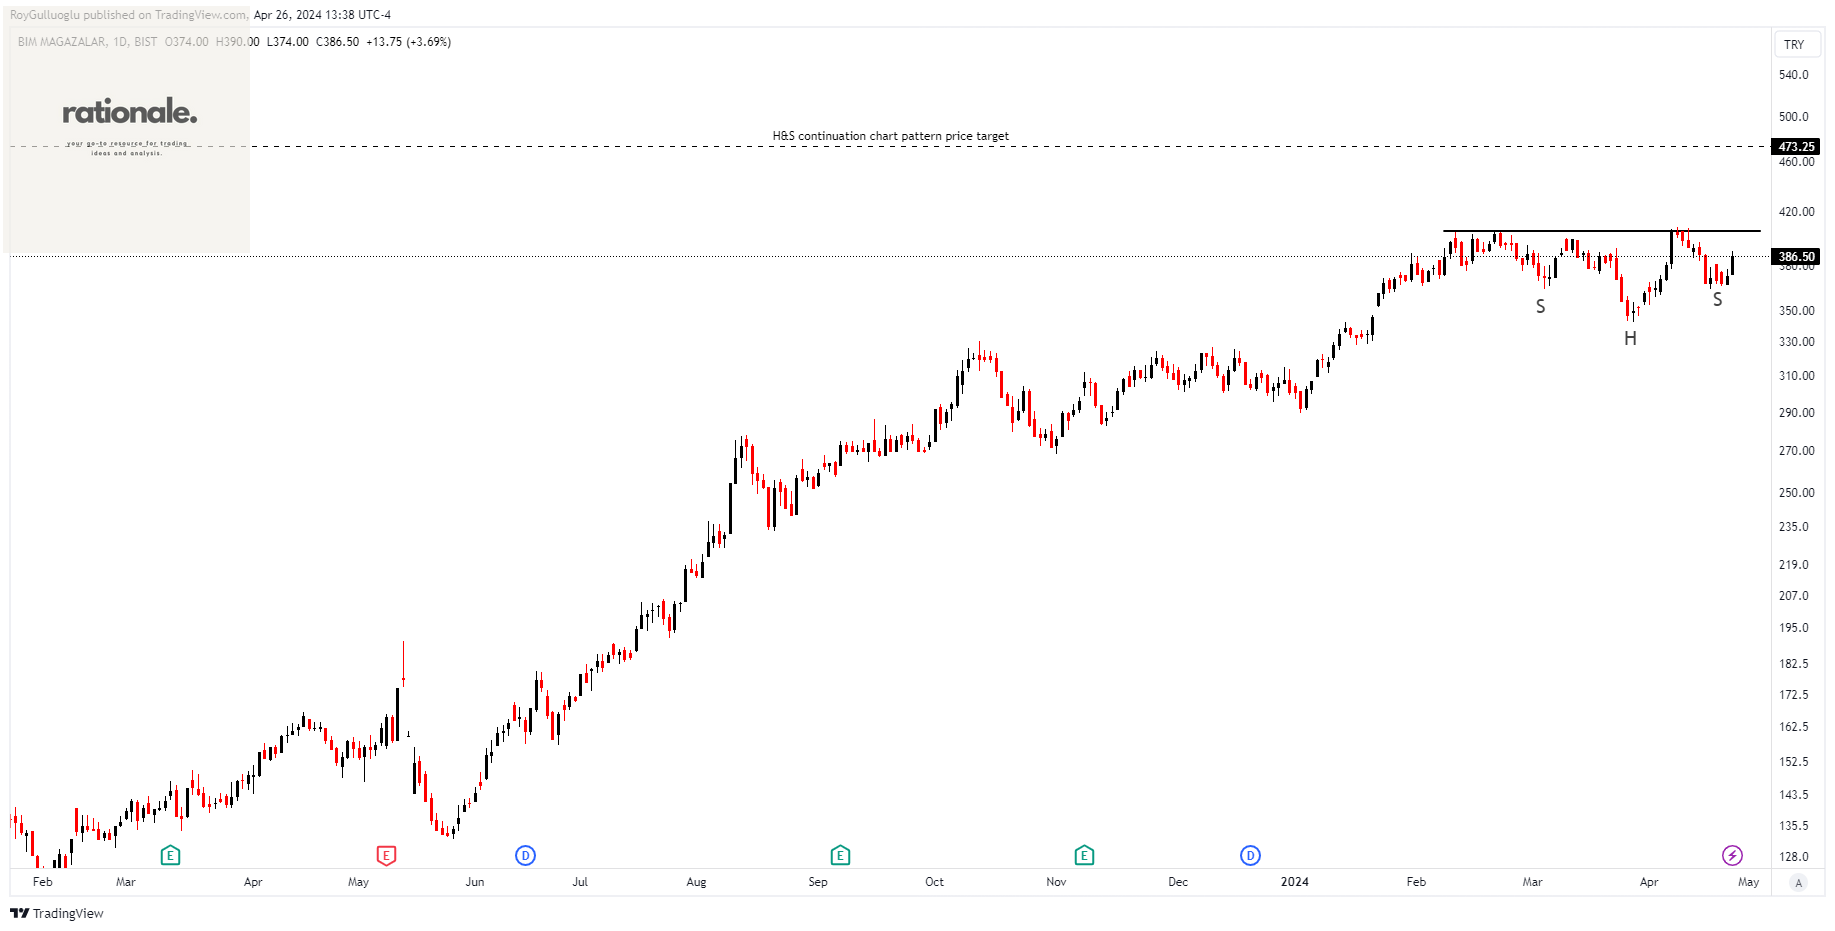
BIM Birlesik Magazalar A.S., along with its affiliated companies, manages retail outlets located in Turkey, Morocco, and Egypt. These outlets offer a wide range of products including meat, breakfast items, dairy products, legumes, bakery goods, cosmetics, paper products, beverages, snacks, sweets, fruits, vegetables, frozen foods, oils, and cleaning supplies.
The above daily chart formed an approximately 2-month-long H&S continuation chart pattern as a bullish continuation after an uptrend.
The horizontal boundary at 405 levels acts as a support within this pattern.
A daily close above 417.15 levels would validate the breakout from the 2-month-long H&S continuation chart pattern.
Based on this chart pattern, the potential price target is 473.25 levels.
BIMAS, classified under the "consumer defensive" sector, falls under the “Mid Cap - Value” stock category.
Anadolu Hayat Emeklilik Anonim Sirketi-(ANHYT/BIST)-Long Idea
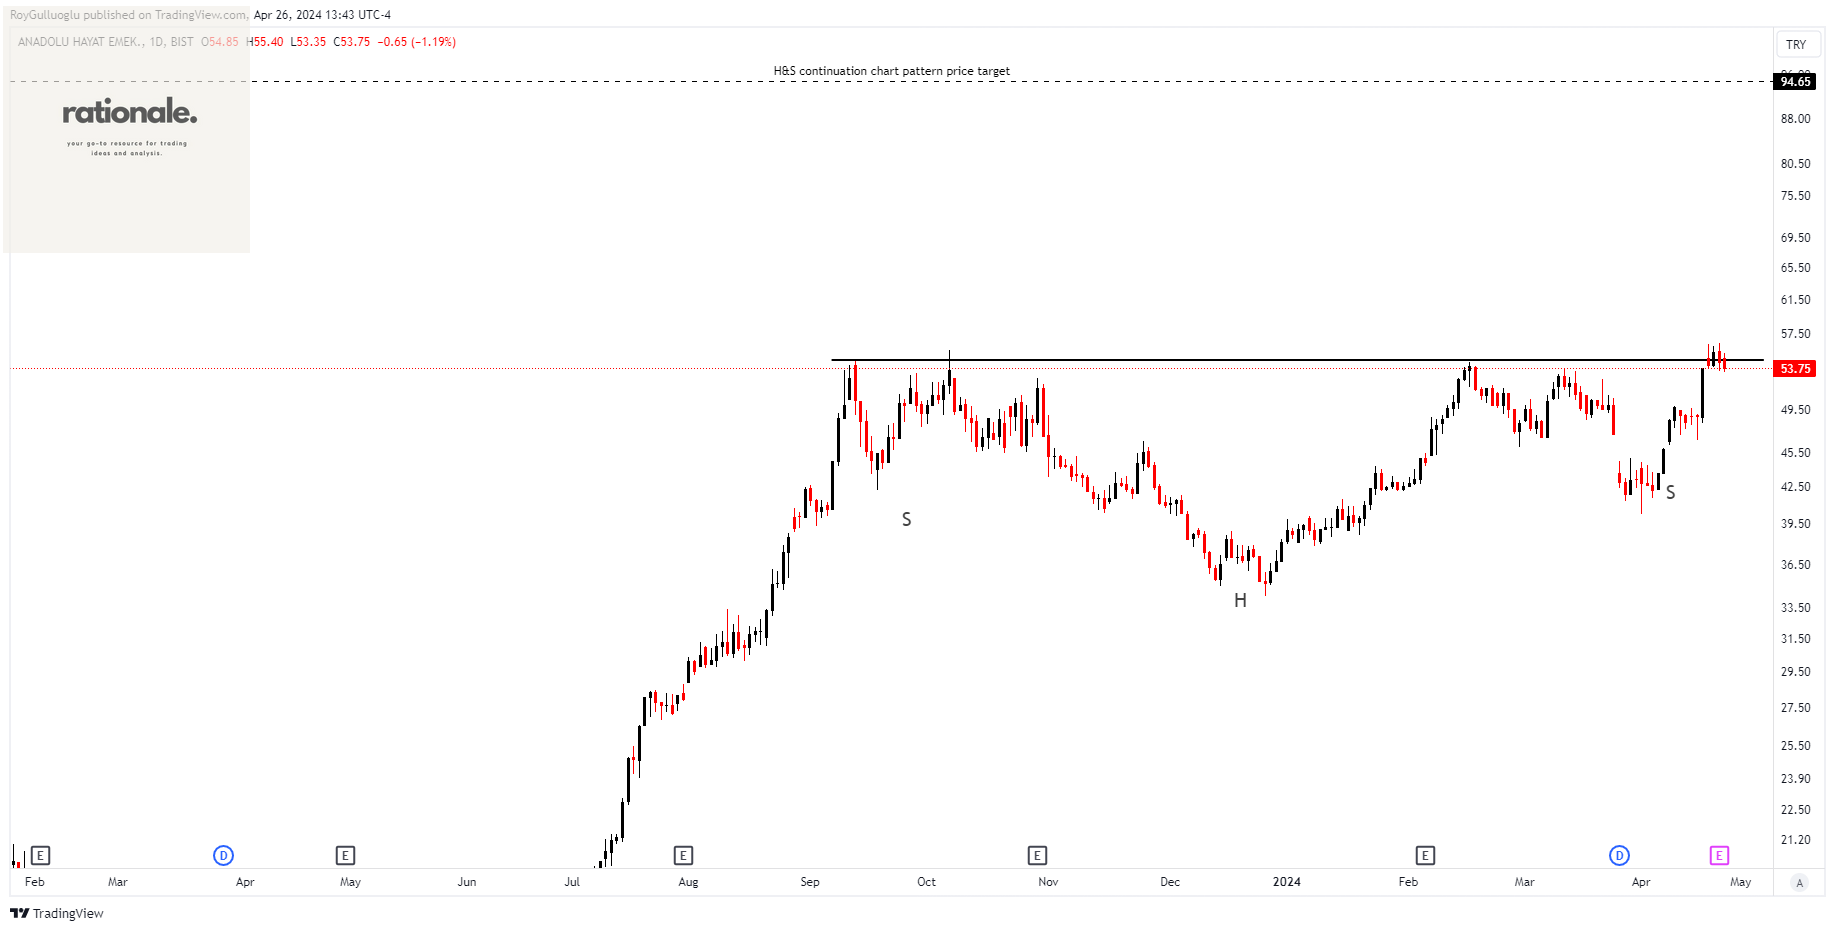
Anadolu Hayat Emeklilik Anonim Sirketi offers individual and group insurance and reinsurance services within the life, retirement, and associated personal accident sectors to both groups and individuals in Turkey.
The above daily chart formed an approximately 5-month-long H&S continuation chart pattern as a bullish continuation after an uptrend.
The horizontal boundary at 54.65 levels acts as a resistance within this pattern.
A daily close above 56.28 levels would validate the breakout from the 5-month-long H&S continuation chart pattern.
Based on this chart pattern, the potential price target is 94.65 levels.
ANHYT, classified under the "financial services" sector, falls under the “Small Cap - Income” stock category.
HSBC Holdings plc-(HSBA/LSE)-Long Idea
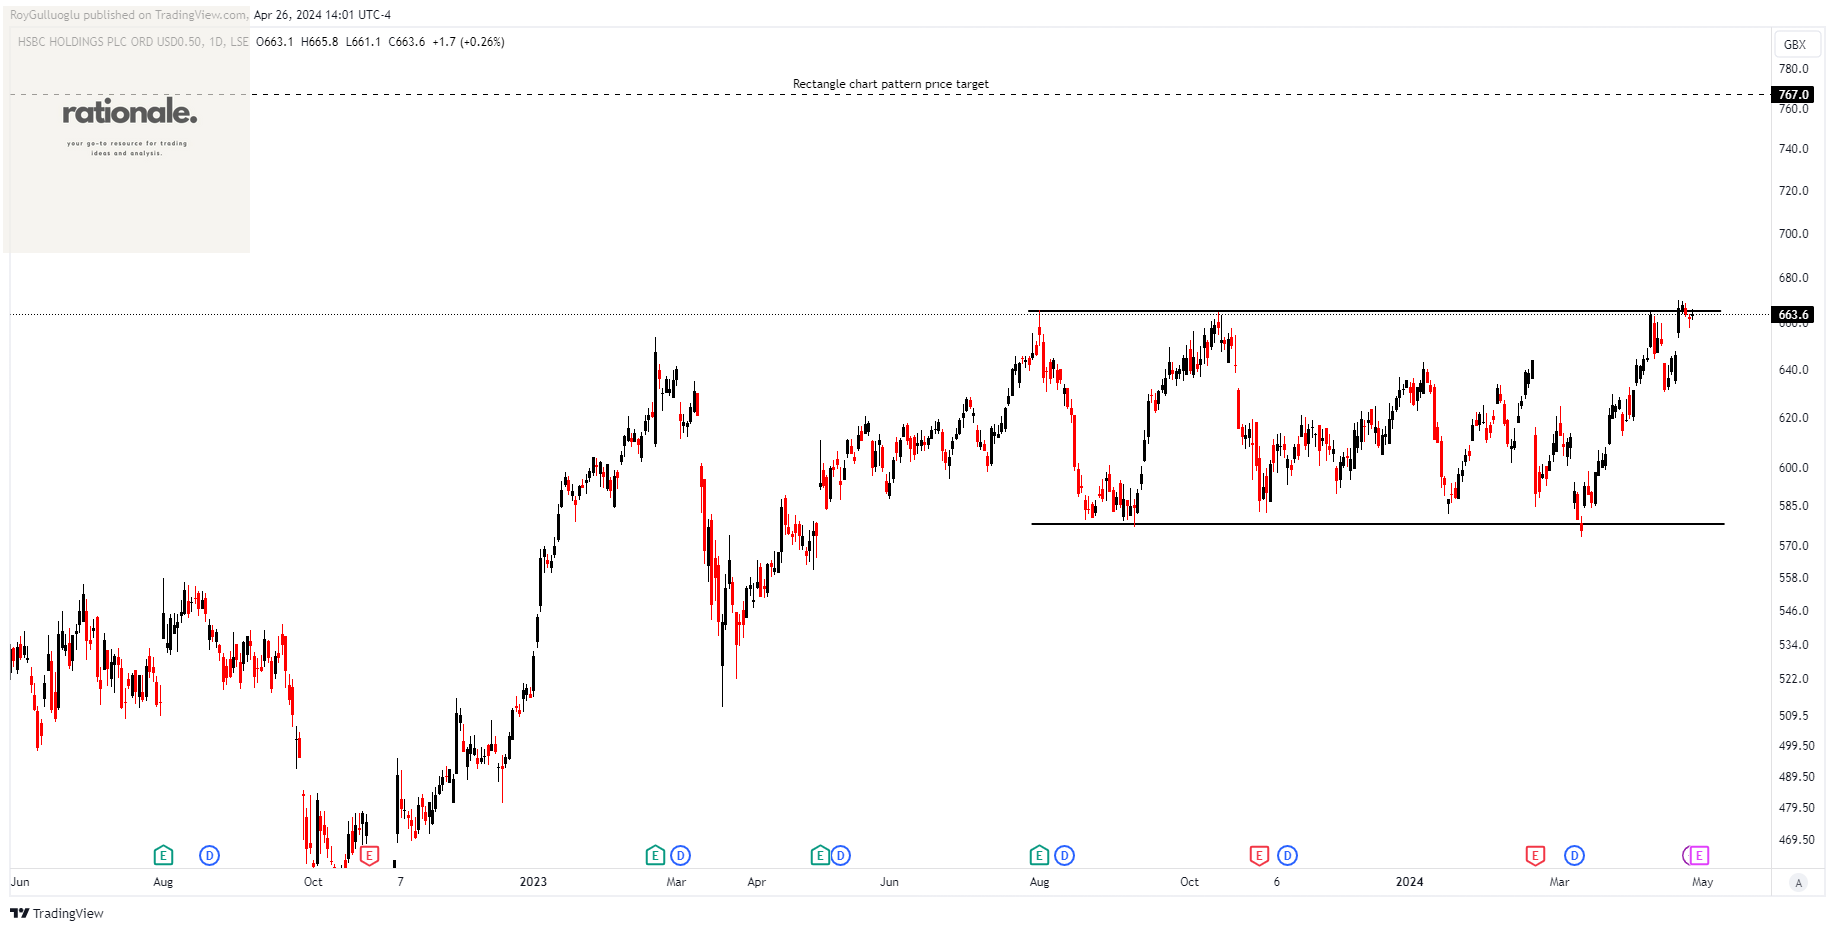
HSBC Holdings plc delivers banking and financial services on a global scale. The company's operations are divided into segments including Wealth and Personal Banking, Commercial Banking, and Global Banking and Markets.
The above daily chart formed an approximately 6-month-long rectangle chart pattern as a bullish continuation after an uptrend.
The horizontal boundary at 665 levels acts as a resistance within this pattern.
A daily close above 685 levels would validate the breakout from the 6-month-long rectangle chart pattern.
Based on this chart pattern, the potential price target is 767 levels.
HSBA, classified under the "financial services" sector, falls under the “Large Cap - Income” stock category.
Eneva S.A.-(ENEV3/BOVESPA)-Long Idea
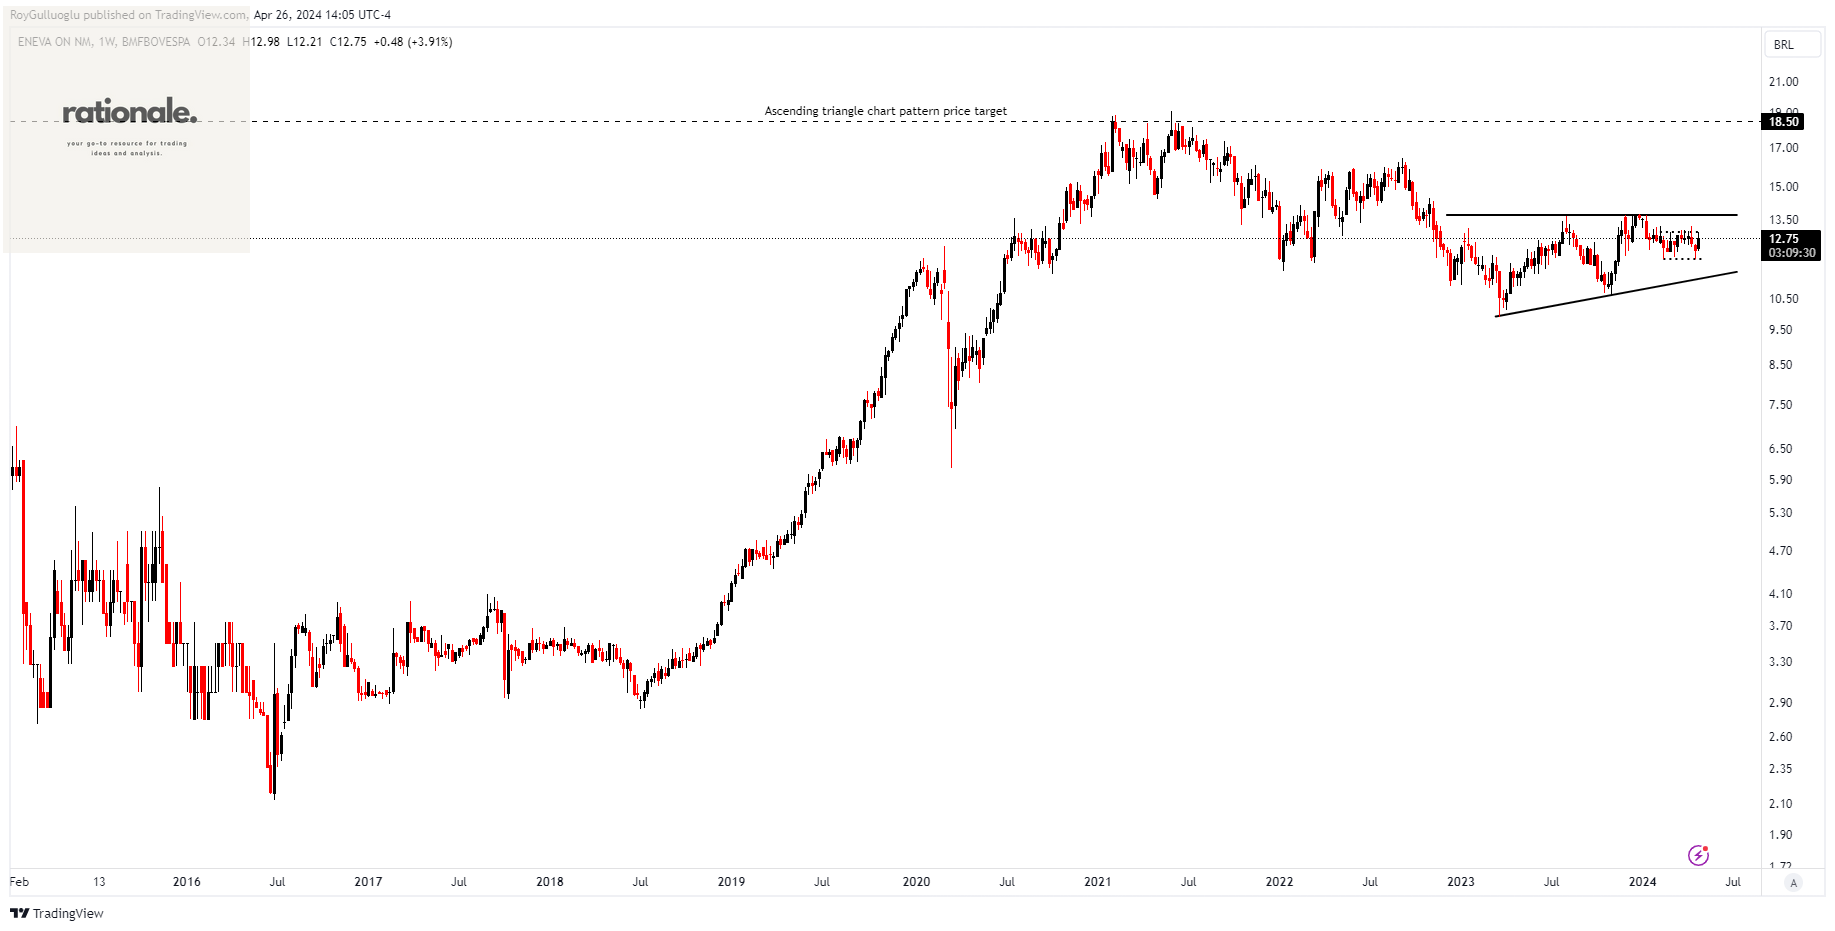
Eneva S.A., along with its subsidiary companies, functions as an integrated power generation firm in Brazil, producing electricity from coal, natural gas, and solar energy sources.
The above weekly chart potentially forms an approximately 20-month-long ascending triangle chart pattern as a bullish reversal after a downtrend.
The horizontal boundary at 13.68 levels acts as a support within this pattern.
A daily close above 14 levels would validate the breakout from the 20-month-long ascending triangle chart pattern.
Based on this chart pattern, the potential price target is 18.5 levels.
China Mobile Limited-(941/HKEX)-Long Idea
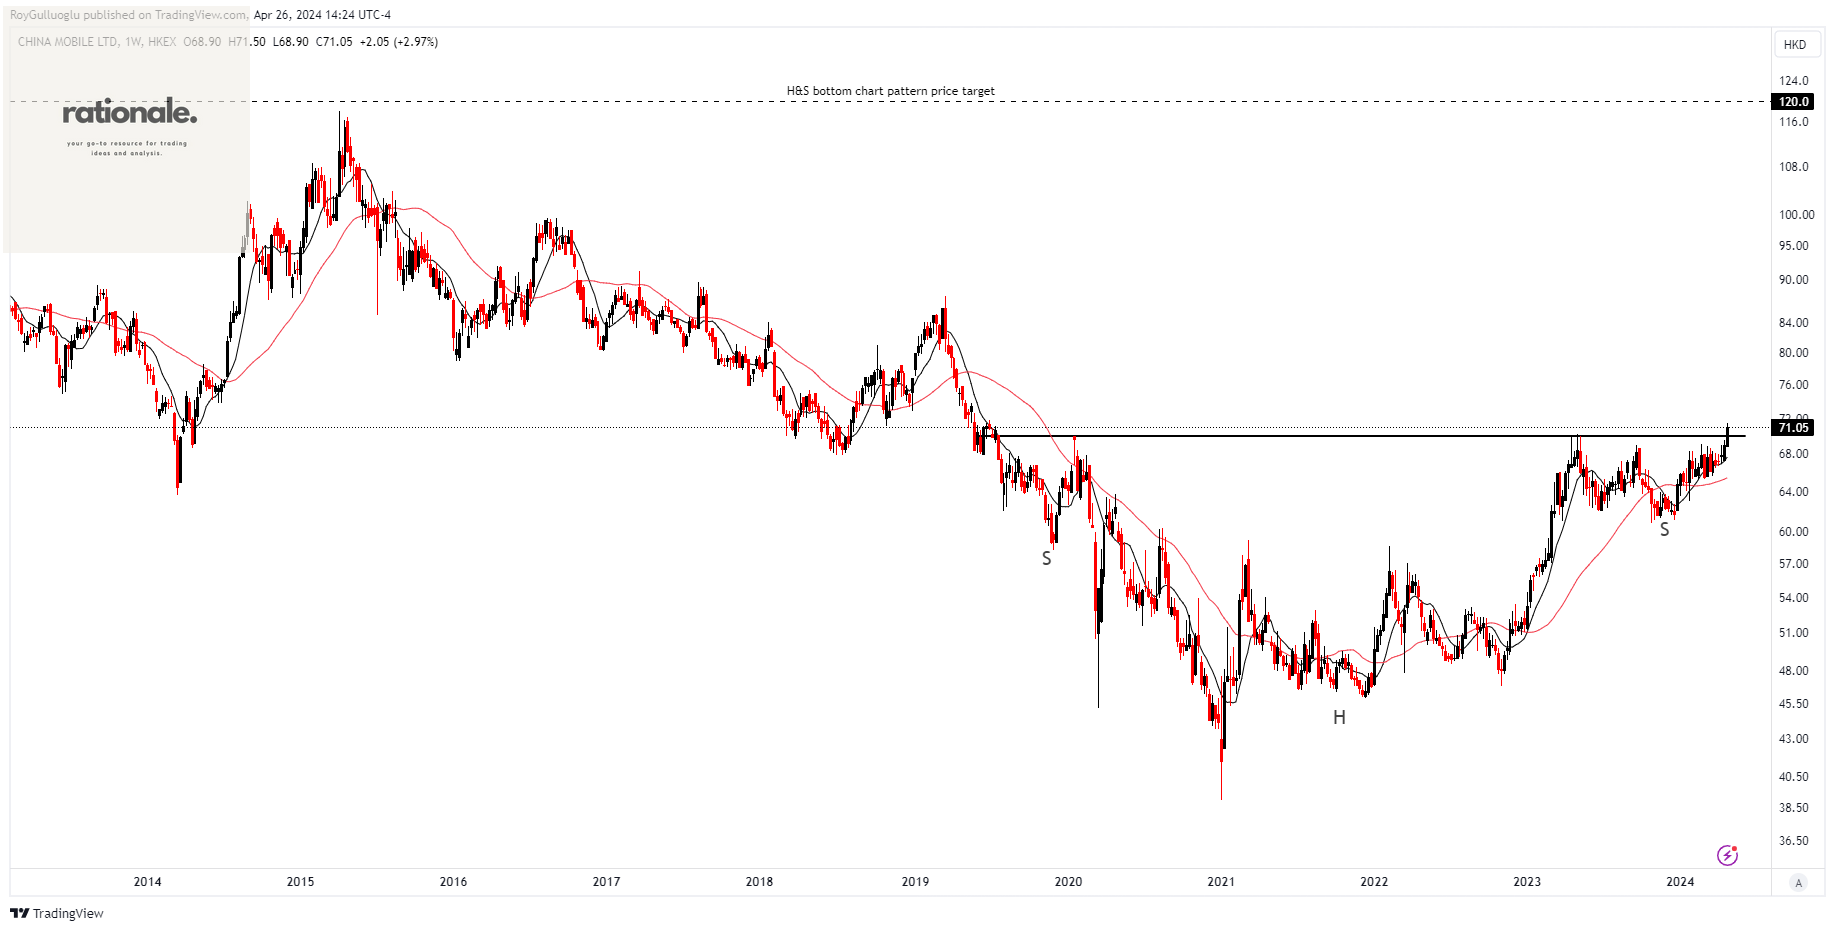
China Mobile Limited offers telecommunications and information-related services in Mainland China and Hong Kong. Its core services include voice, data, broadband, dedicated lines, internet data center, cloud computing, IoT, and other services tailored for customers, households, businesses, and emerging markets.
The above weekly chart formed an approximately 4-year-long H&S bottom chart pattern as a bullish reversal after a downtrend.
The horizontal boundary at 70 levels acts as a resistance within this pattern.
A daily close above 72.1 levels would validate the breakout from the 4-year-long H&S bottom chart pattern.
Based on this chart pattern, the potential price target is 120 levels.
941, classified under the "communication services" sector, falls under the “Large Cap - Growth” stock category.
MINISO Group Holding Limited-(9896/HKEX)-Long Idea
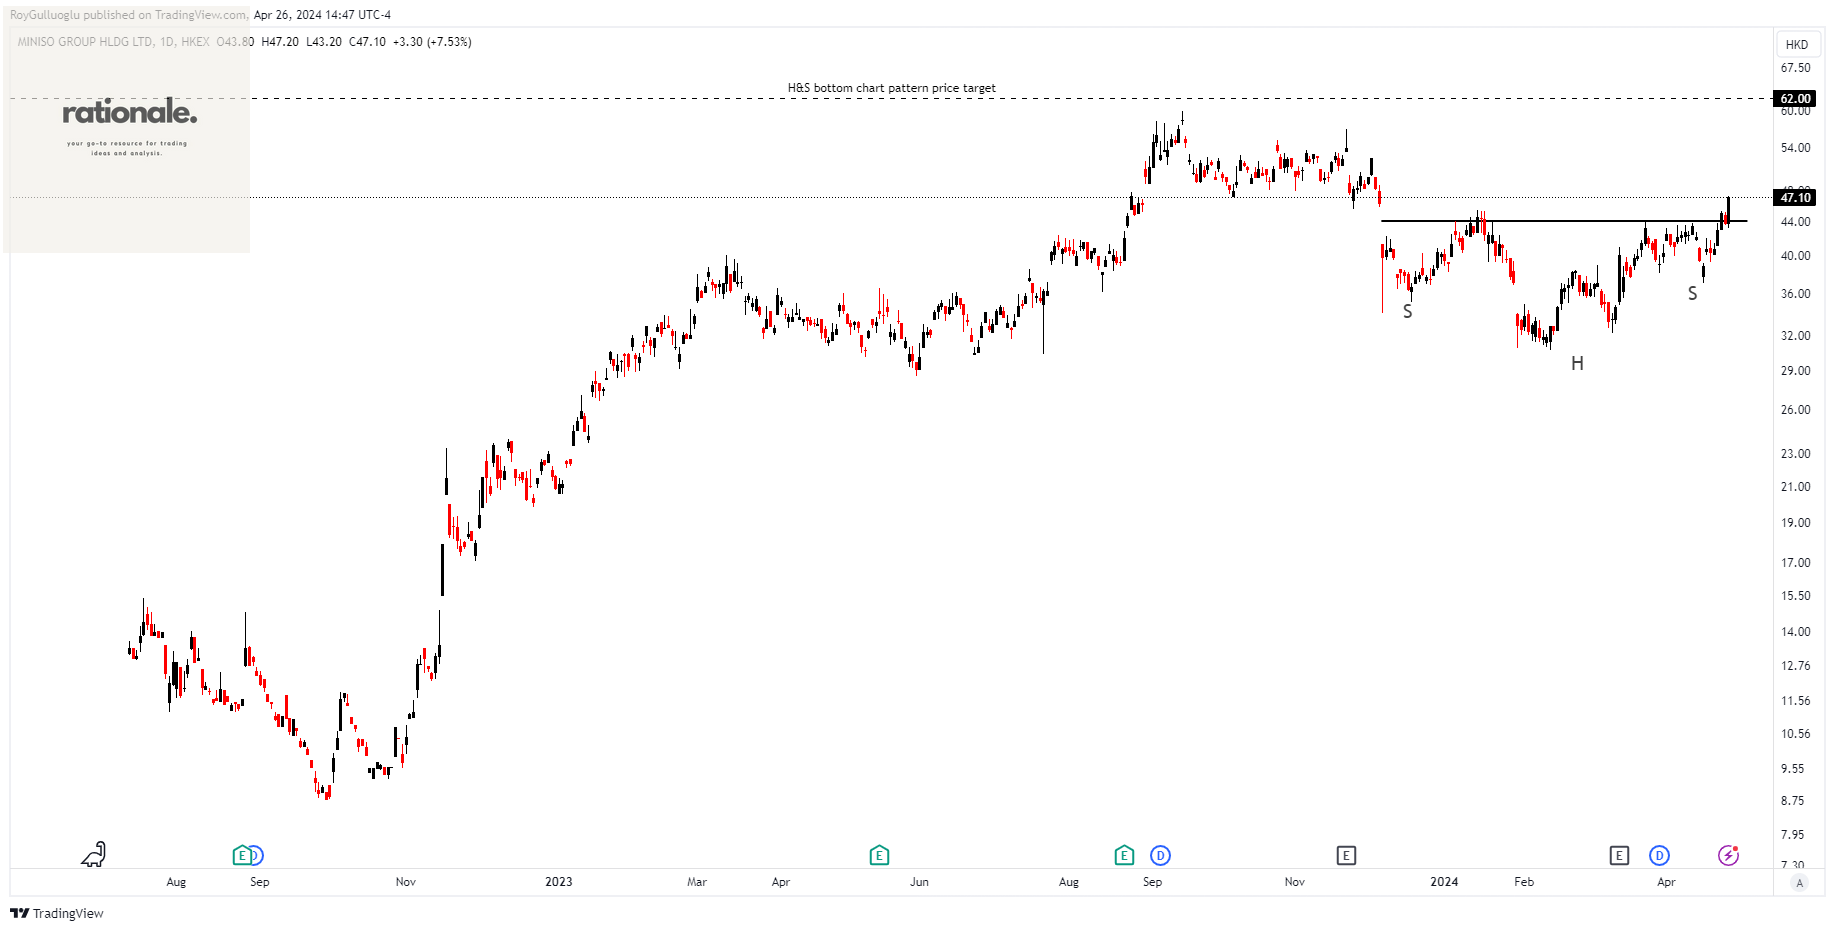
MINISO Group Holding Limited, an investment holding company, is involved in the retail and wholesale of lifestyle products and pop toy items across China, Asia, the United States, and Europe.
The above daily chart formed an approximately 3-month-long H&S bottom chart pattern as a bullish reversal after a downtrend.
The horizontal boundary at 44 levels acted as a resistance within this pattern.
A daily close above 45.32 levels validated the breakout from the 3-month-long H&S bottom chart pattern.
Based on this chart pattern, the potential price target is 62 levels.
9896, classified under the "consumer cyclical" sector, falls under the “Mid Cap - Growth” stock category.