


FTAI Aviation Ltd.-(FTAI/NASDAQ)-Long Idea
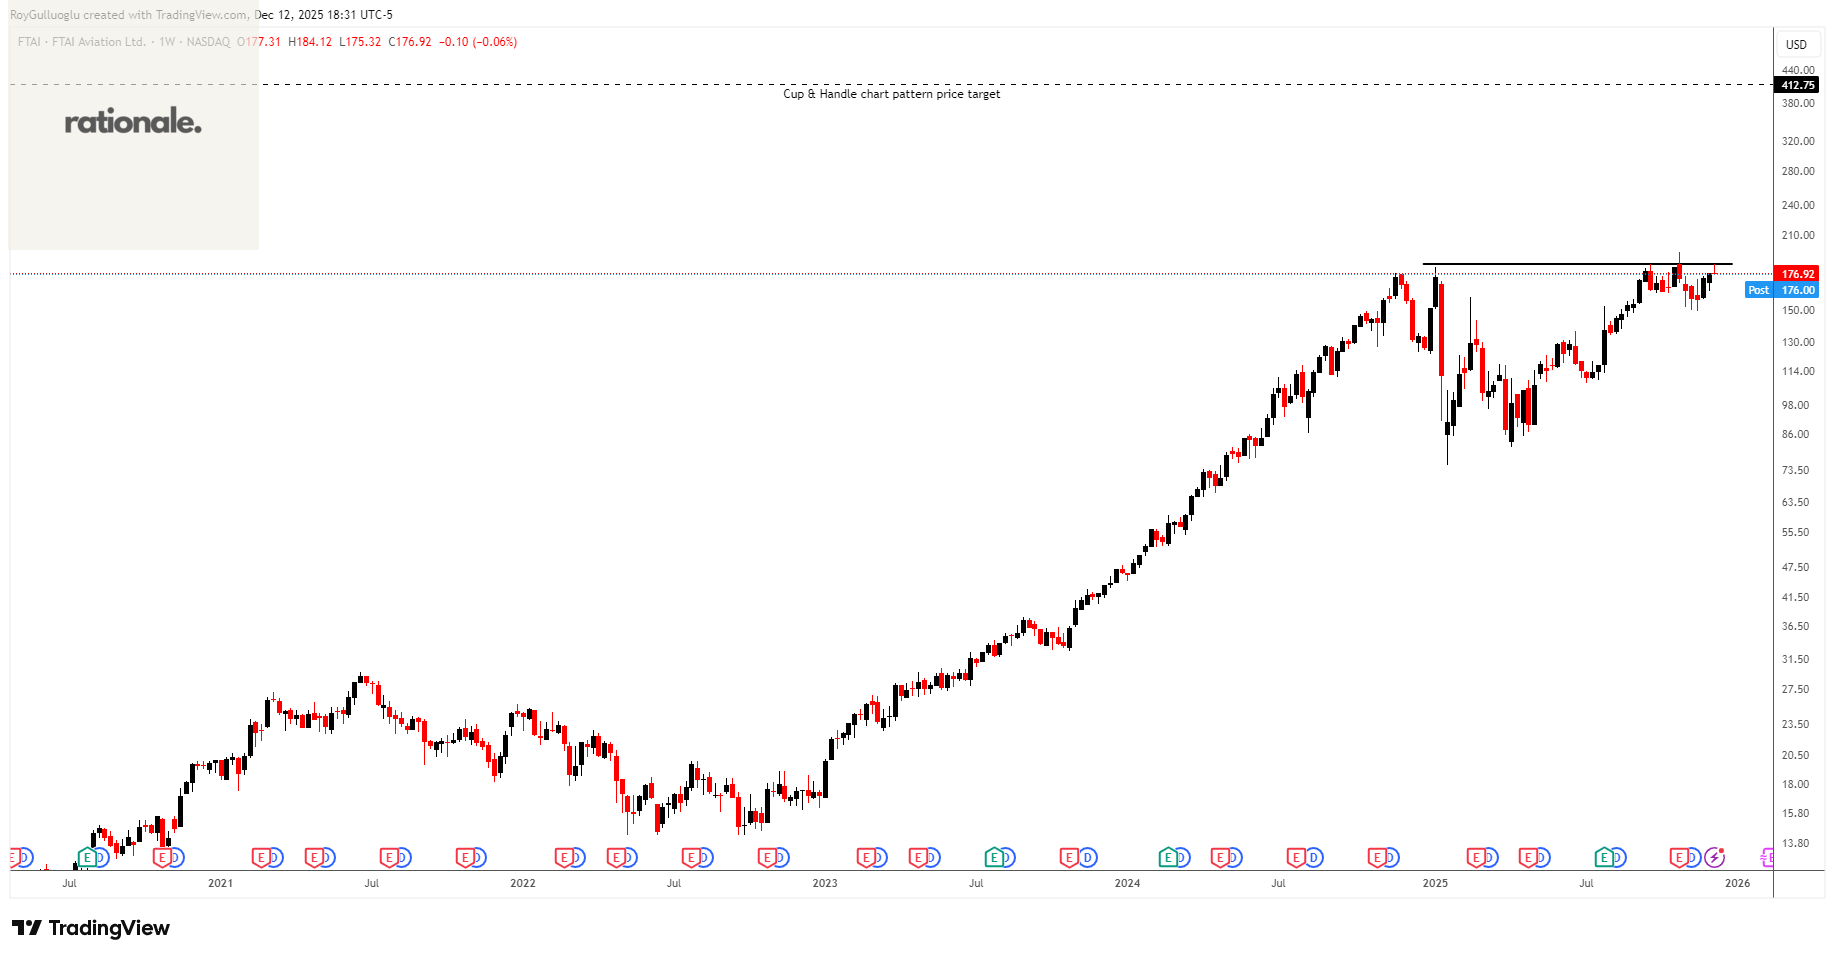
FTAI Aviation Ltd. owns, acquires, and sells aviation equipment for the transportation of goods and people worldwide.
The above daily chart formed an approximately 2-month-long cup & handle chart pattern as a bullish continuation after an uptrend.
The horizontal boundary at 184.44 levels acts as a resistance within this pattern.
A daily close below 189.97 levels would validate the breakdown from the 2-month-long cup & handle chart pattern.
Based on this chart pattern, the potential price target is 412.75 levels.
The Brink’s Company-(BCO/NYSE)-Long Idea
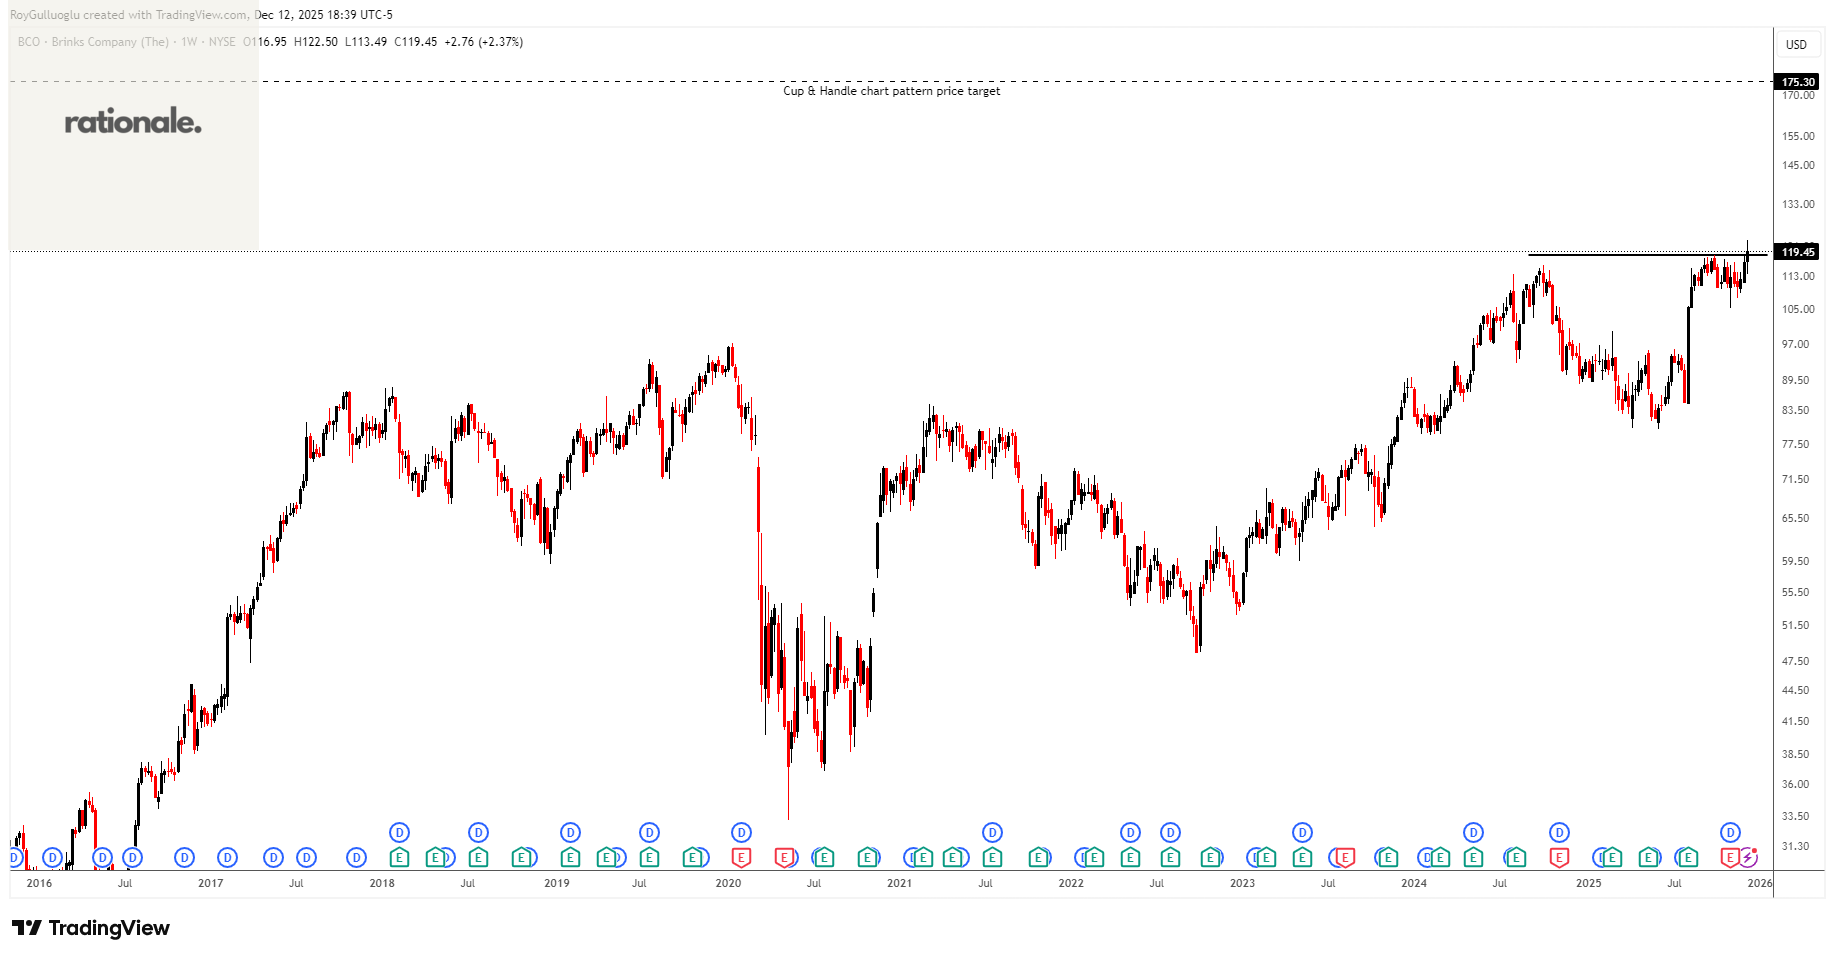
The Brink’s Company provides cash and valuables management, digital retail solutions, and automated teller machines (ATM) managed services in North America, Latin America, Europe, and internationally
The above weekly chart formed an approximately 15-month-long cup & handle chart pattern as a bullish continuation after an uptrend.
The horizontal boundary at 118.6 levels acts as a resistance within this pattern.
A daily close above 122.15 levels would validate the breakout from the 15-month-long cup & handle chart pattern.
Based on this chart pattern, the potential price target is 175.3 levels.
Jabil Inc.-(JBL/NYSE)-Long Idea
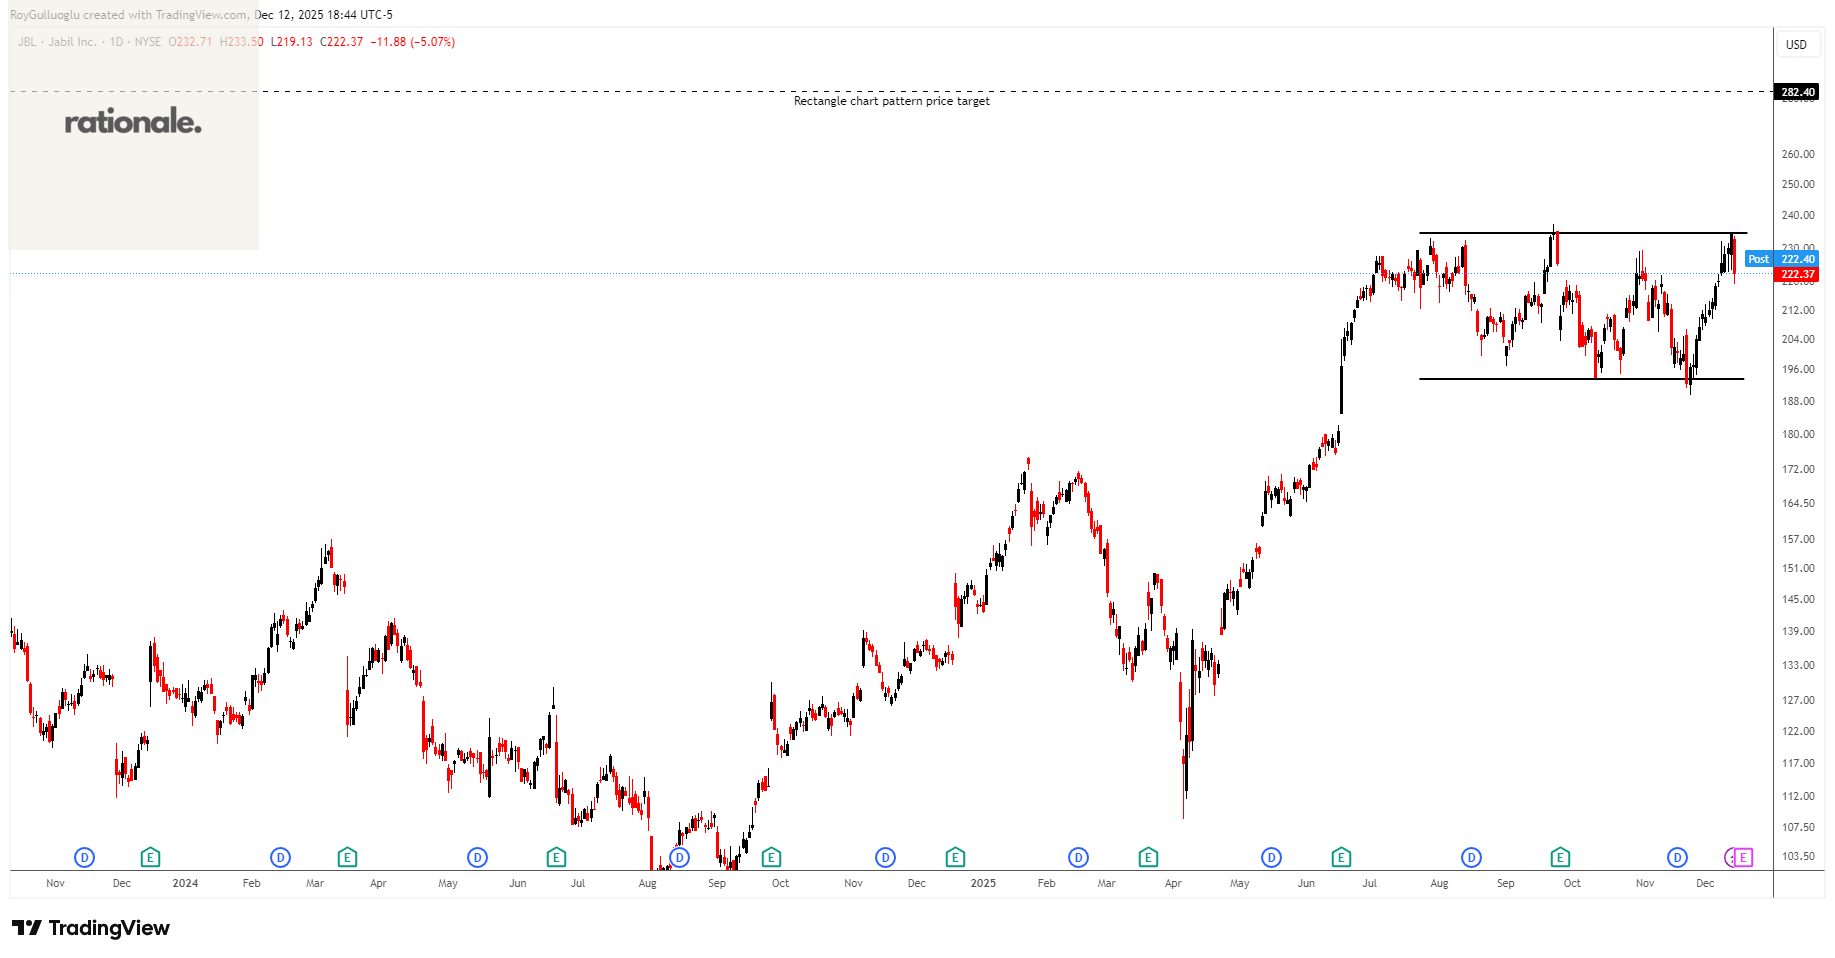
Jabil Inc. provides engineering, manufacturing, and supply chain solutions worldwide.
The above daily chart formed an approximately 3-month-long rectangle chart pattern as a bullish continuation after an uptrend.
The horizontal boundary at 234.32 levels acts as a resistance within this pattern.
A daily close below 241.35 levels would validate the breakdown from the 3-month-long rectangle chart pattern.
Based on this chart pattern, the potential price target is 282.4 levels.
Flagstar Bank, National Association-(FLG/NYSE)-Long Idea
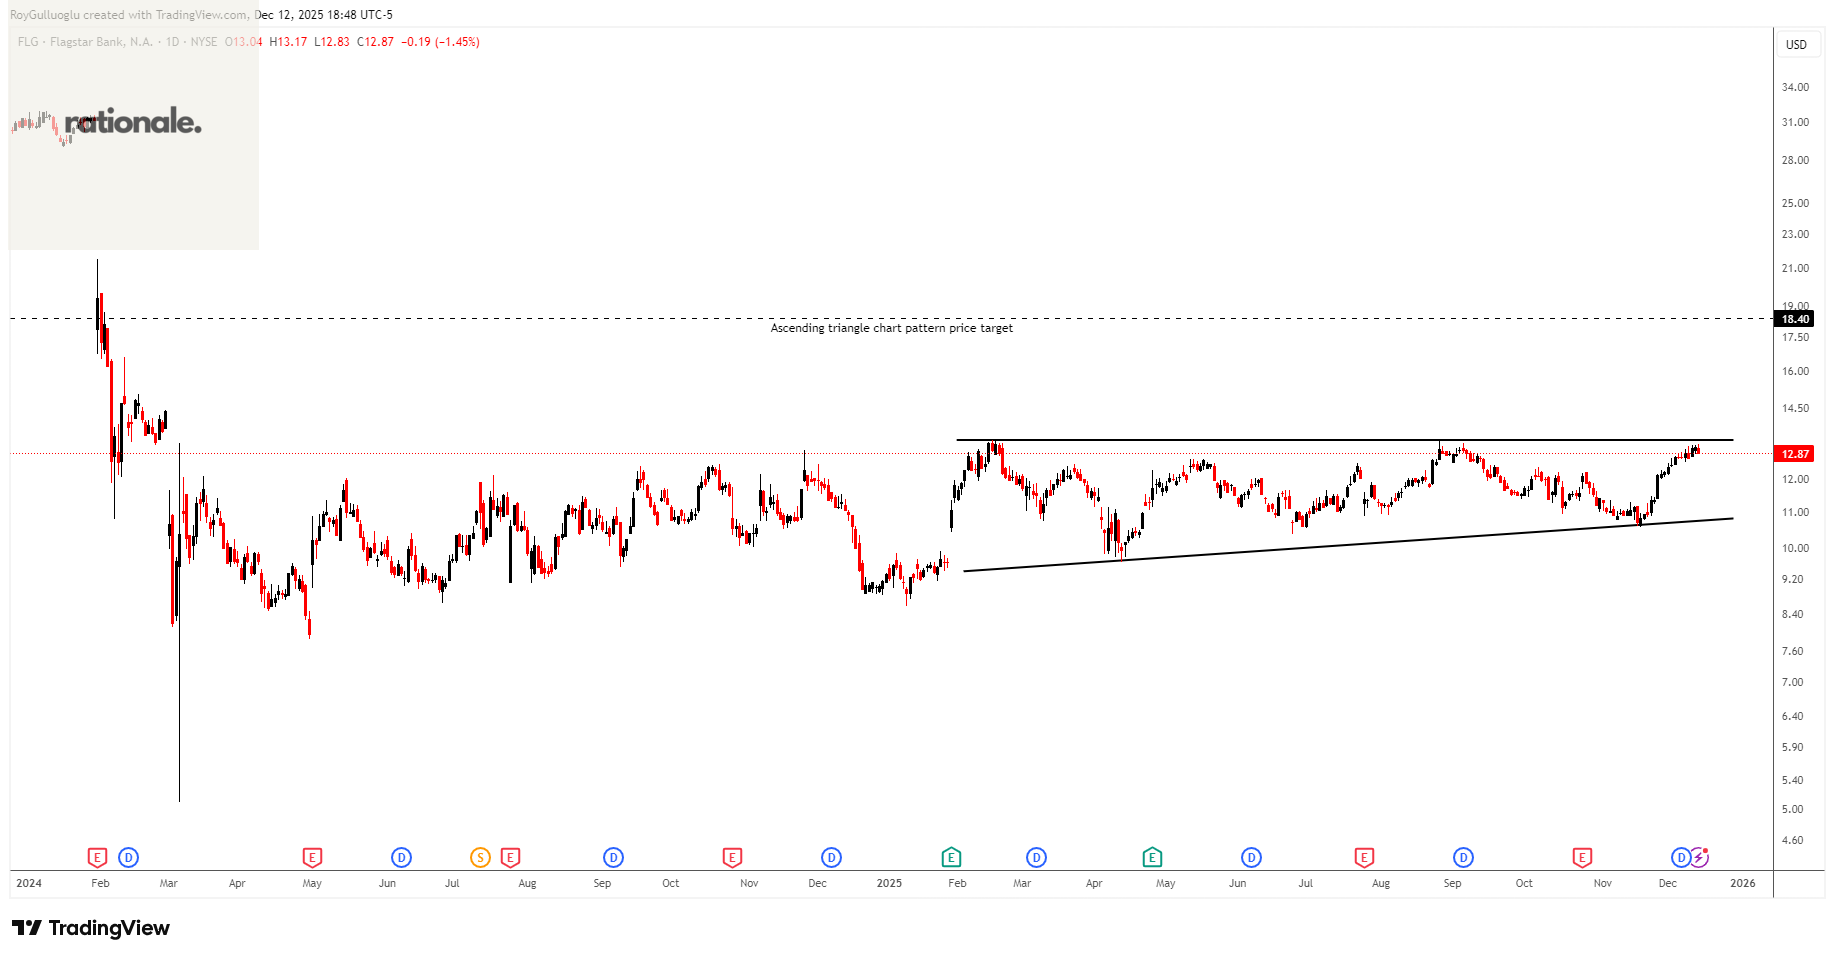
Flagstar Bank, National Association provides banking products and services in the United States.
The above daily chart formed an approximately 7-month-long ascending triangle chart pattern as a bullish continuation after an uptrend.
The horizontal boundary at 13.31 levels acts as a resistance within this pattern.
A daily close above 13.71 levels would validate the breakout from the 7-month-long ascending triangle chart pattern.
Based on this chart pattern, the potential price target is 18.4 levels.
Teşekkürler Roy