

Trade Ideas Equities
RBB(NASDAQ), SAM(NYSE), IDYA(NASDAQ), RNG(NYSE), IAC(NASDAQ), ONTO(NYSE), TTMI(NASDAQ), ACLS(NASDAQ)

RBB Bancorp-(RBB/NASDAQ)-Long Idea
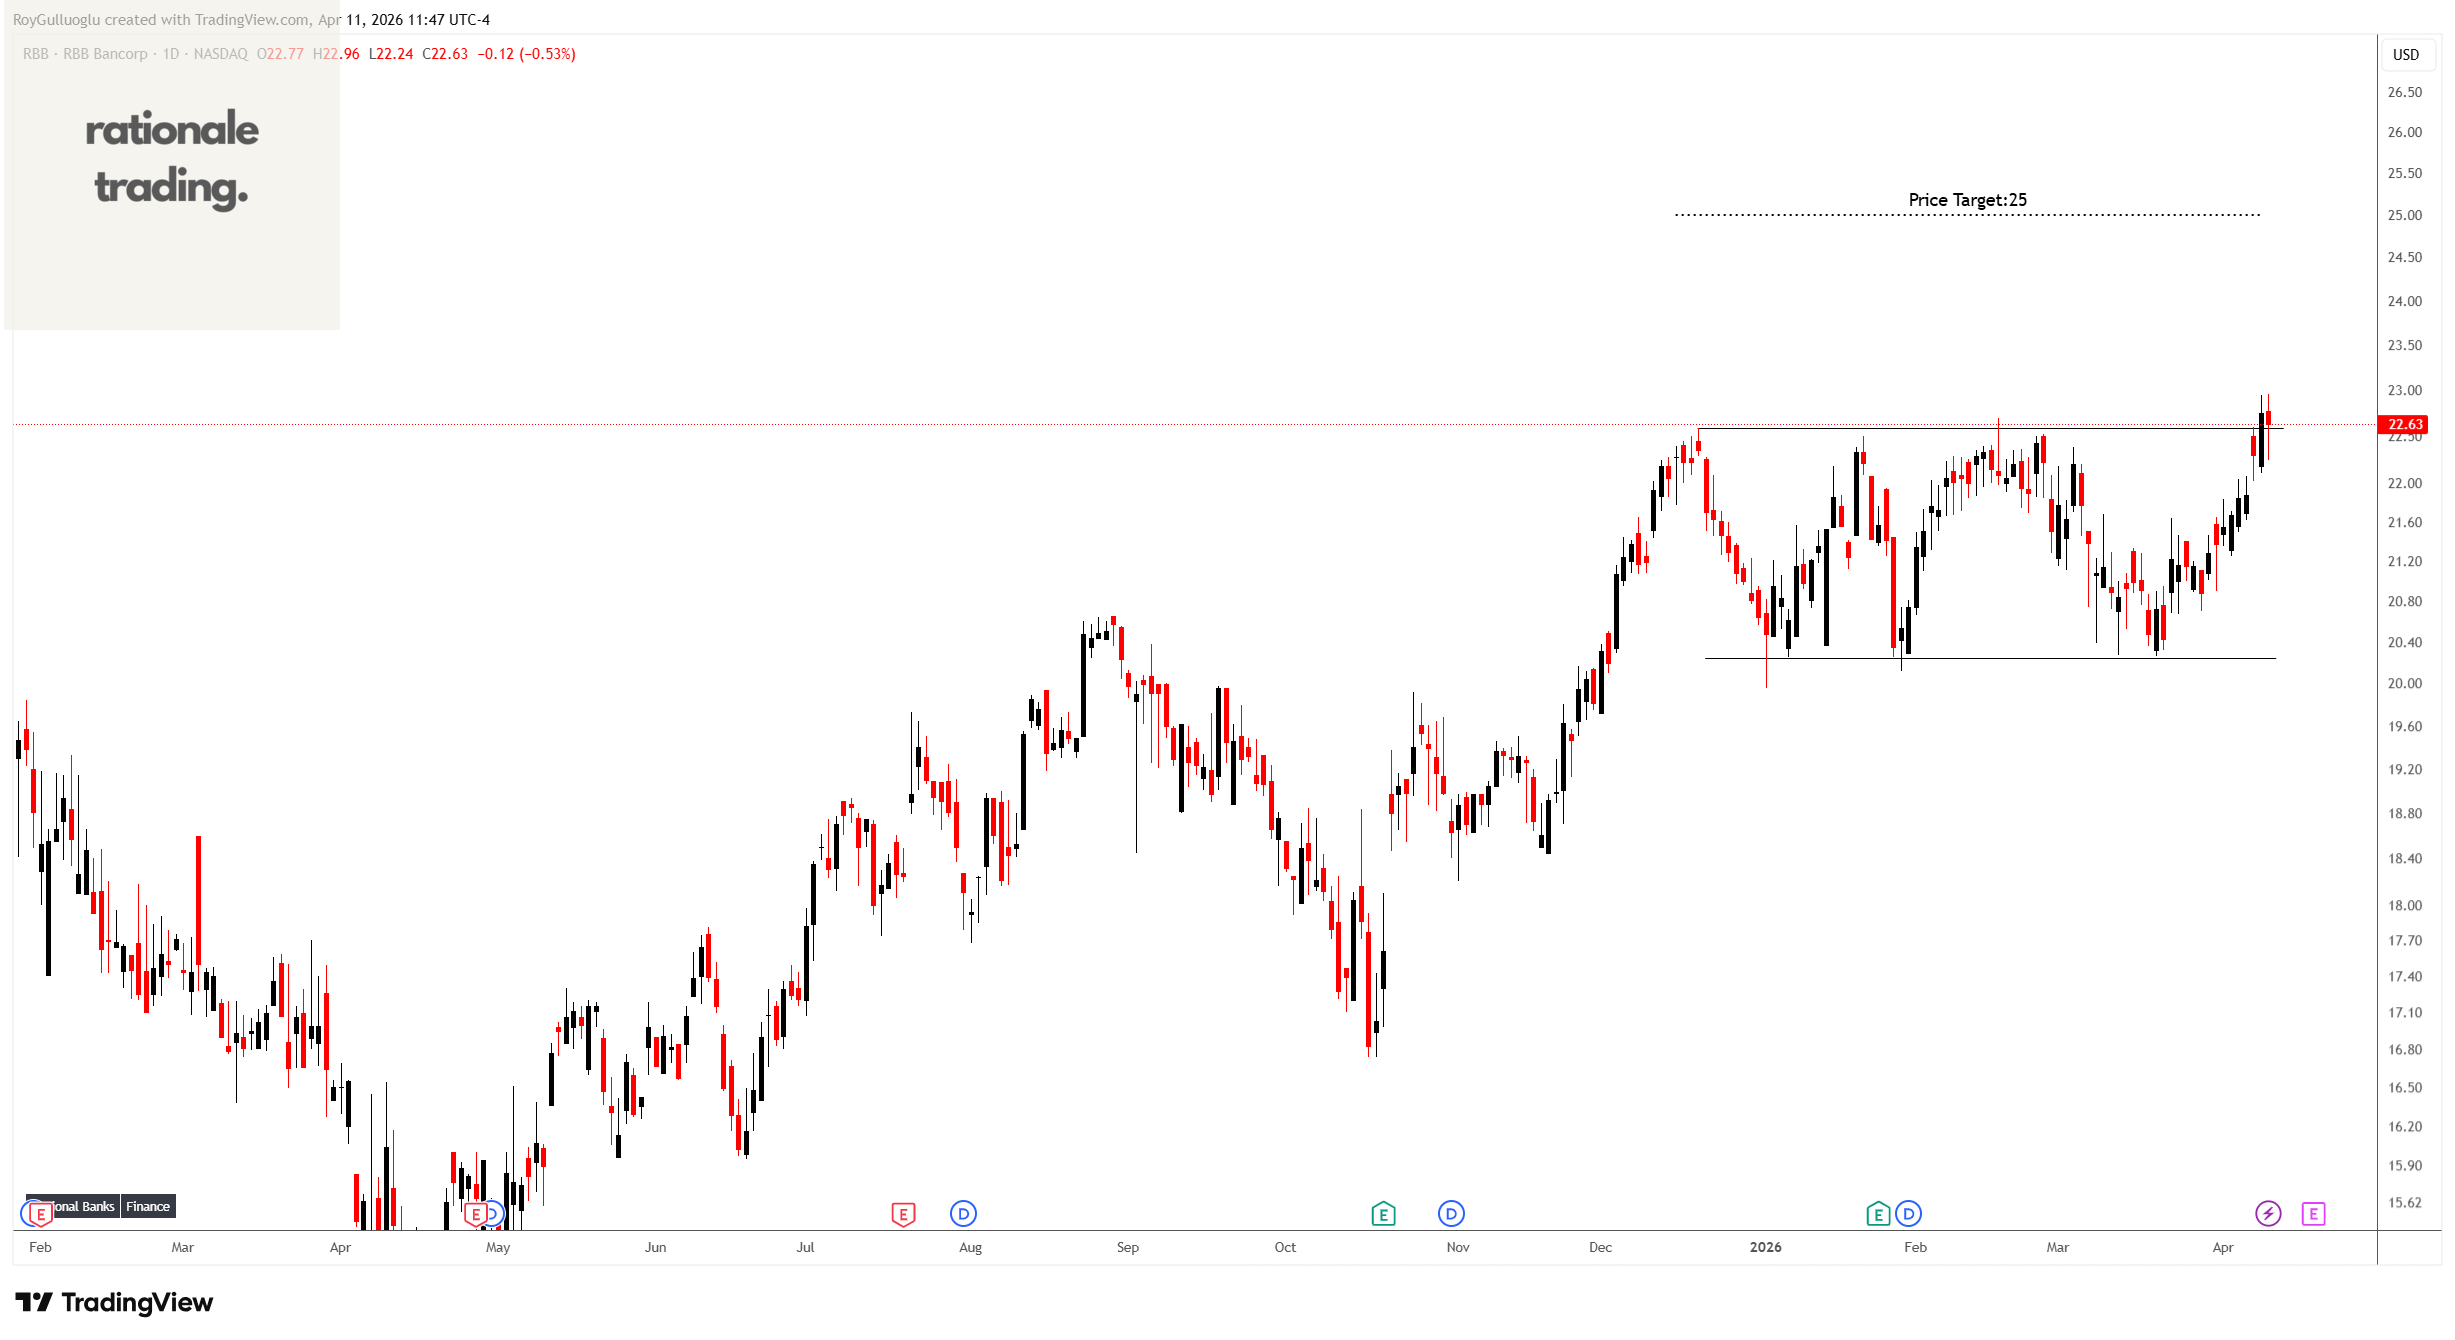
RBB Bancorp operates as the bank holding company for Royal Business Bank that provides business-banking and consumer products and services to Asian-centric communities in the United States.
The above daily chart formed an approximately 3-month-long rectangle chart pattern as a bullish continuatuon after an uptrend.
The horizontal boundary at 22.59 levels acts as a resistance within this pattern.
A daily close above 23.27 levels would validate the breakout from the 17-month-long H&S bottom chart pattern.
Based on this chart pattern, the potential price target is 25 levels.
RBB, classified under the “financial services” sector, falls under the “Small Cap - Income” stock category.
The Boston Beer Company, Inc.-(SAM/NYSE)-Long Idea
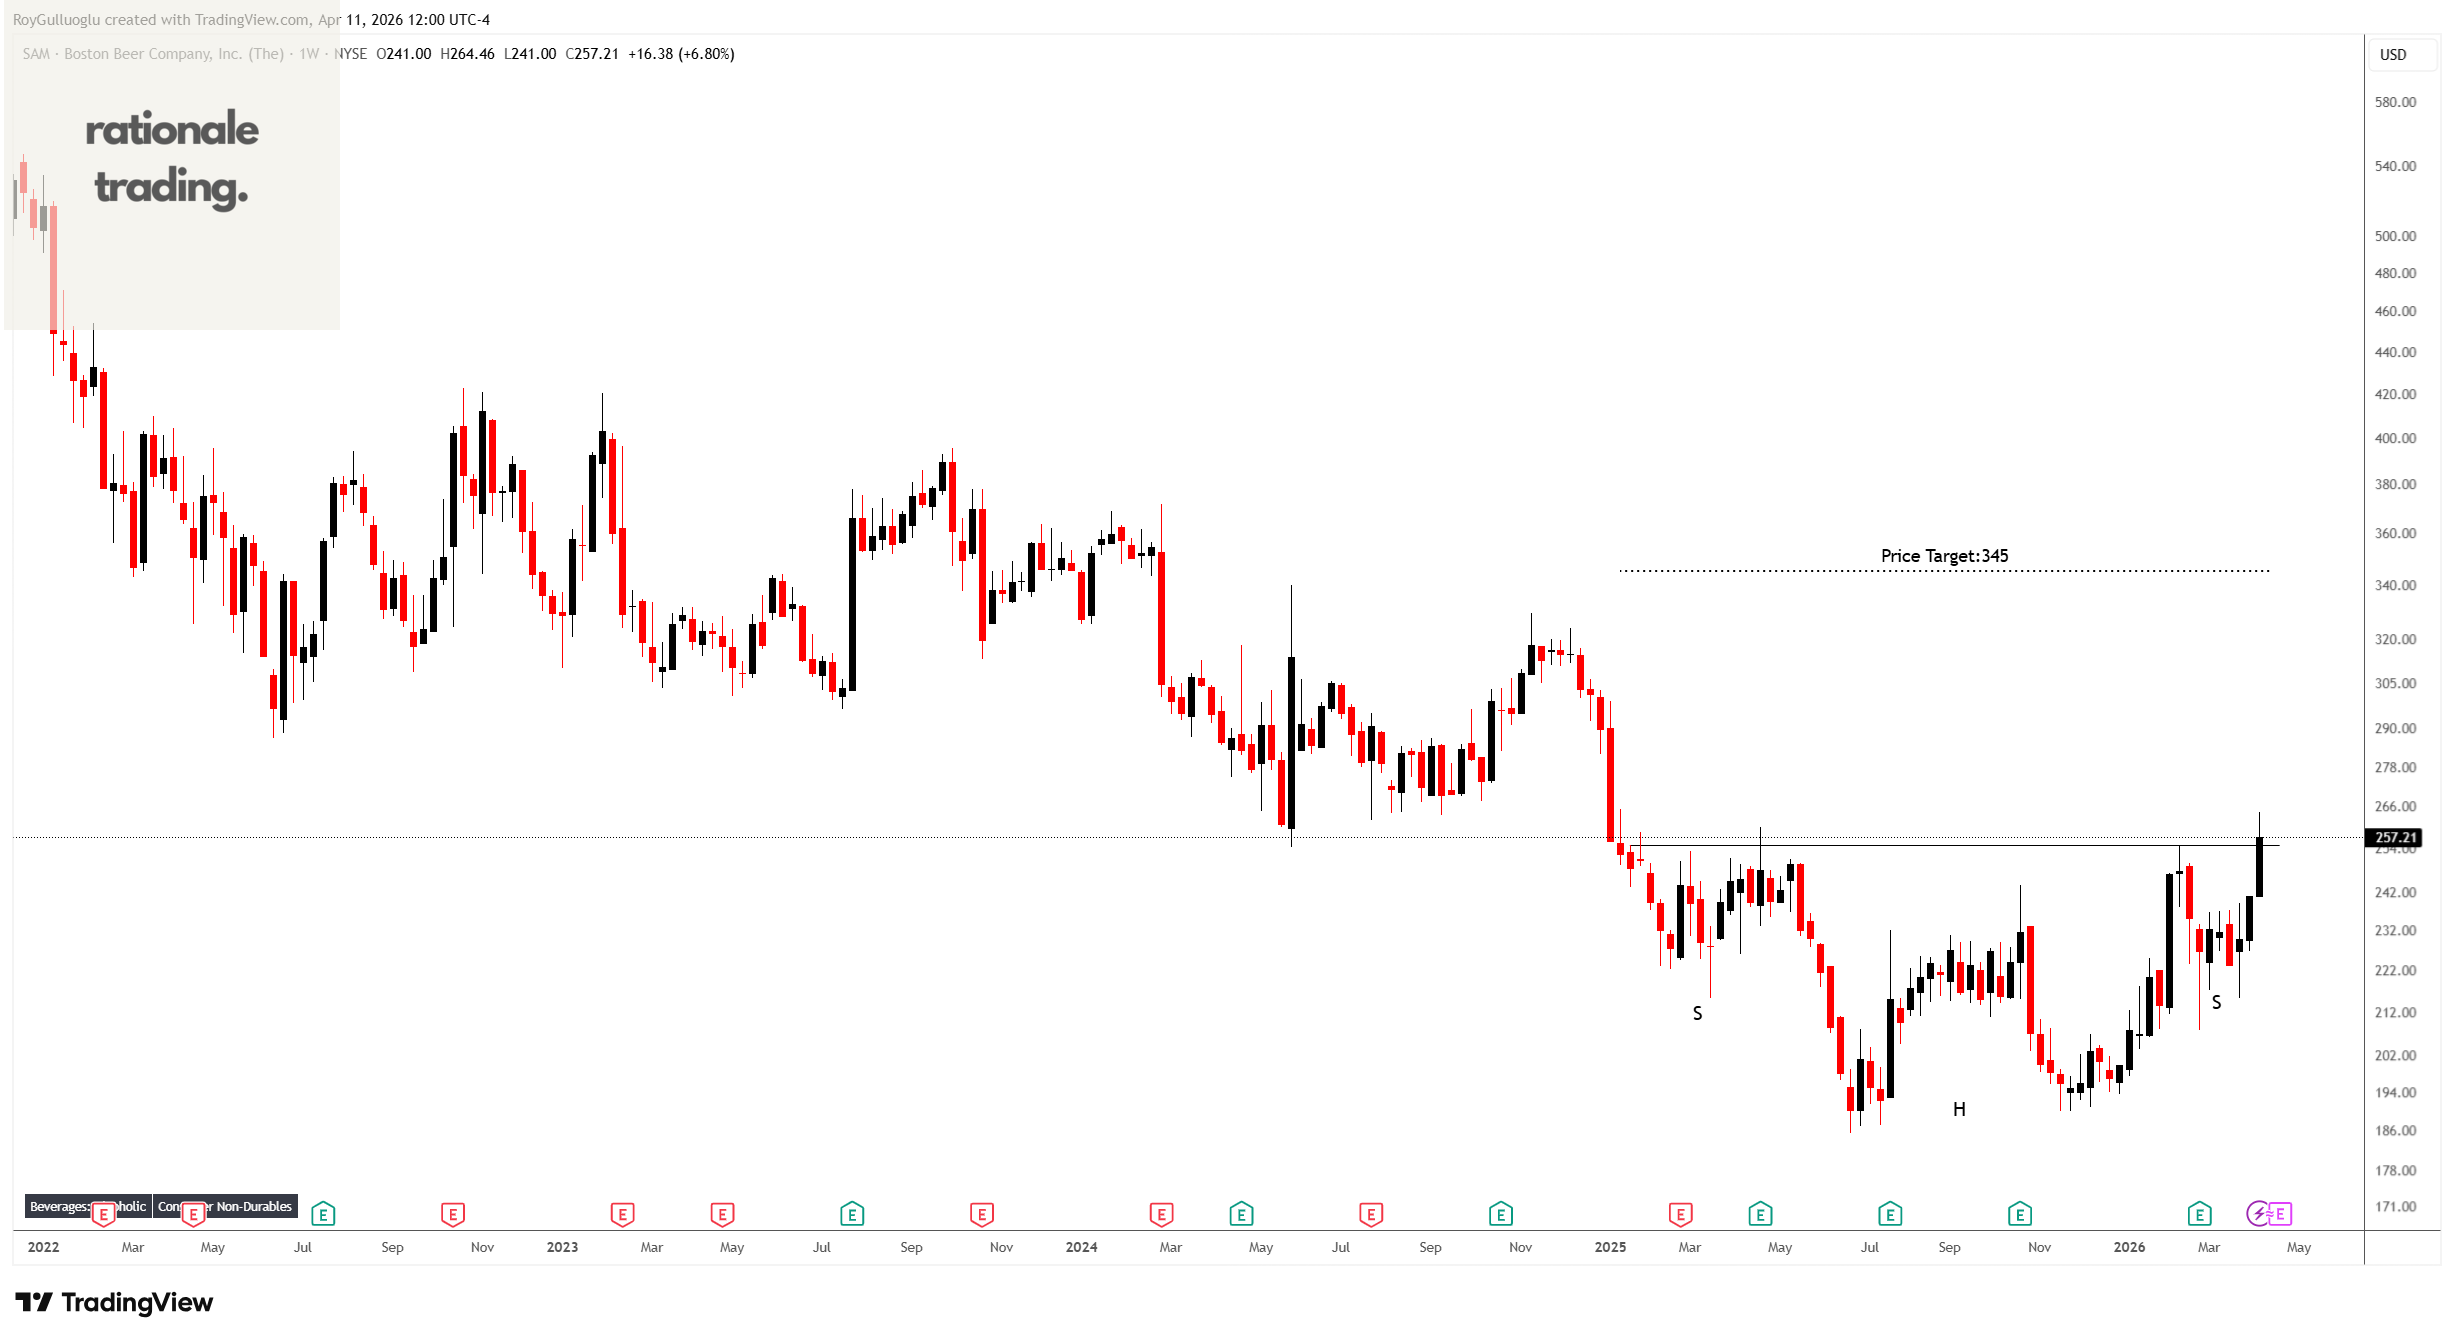
The Boston Beer Company, Inc. produces and sells alcohol beverages primarily in the United States. Its flagship beer is Samuel Adams Boston Lager.
The above weekly chart formed an approximately 15-month-long H&S bottom chart pattern as a bullish reversal after a downtrend.
The horizontal boundary at 254.89 levels acts as a resistance within this pattern.
A daily close above 262.5 levels would validate the breakout from the 15-month-long H&S bottom chart pattern.
Based on this chart pattern, the potential price target is 345 levels.
SAM, classified under the “consumer defensive” sector, falls under the “Mid Cap - Value” stock category.
IDEAYA Biosciences, Inc.-(IDYA/NASDAQ)-Short Idea
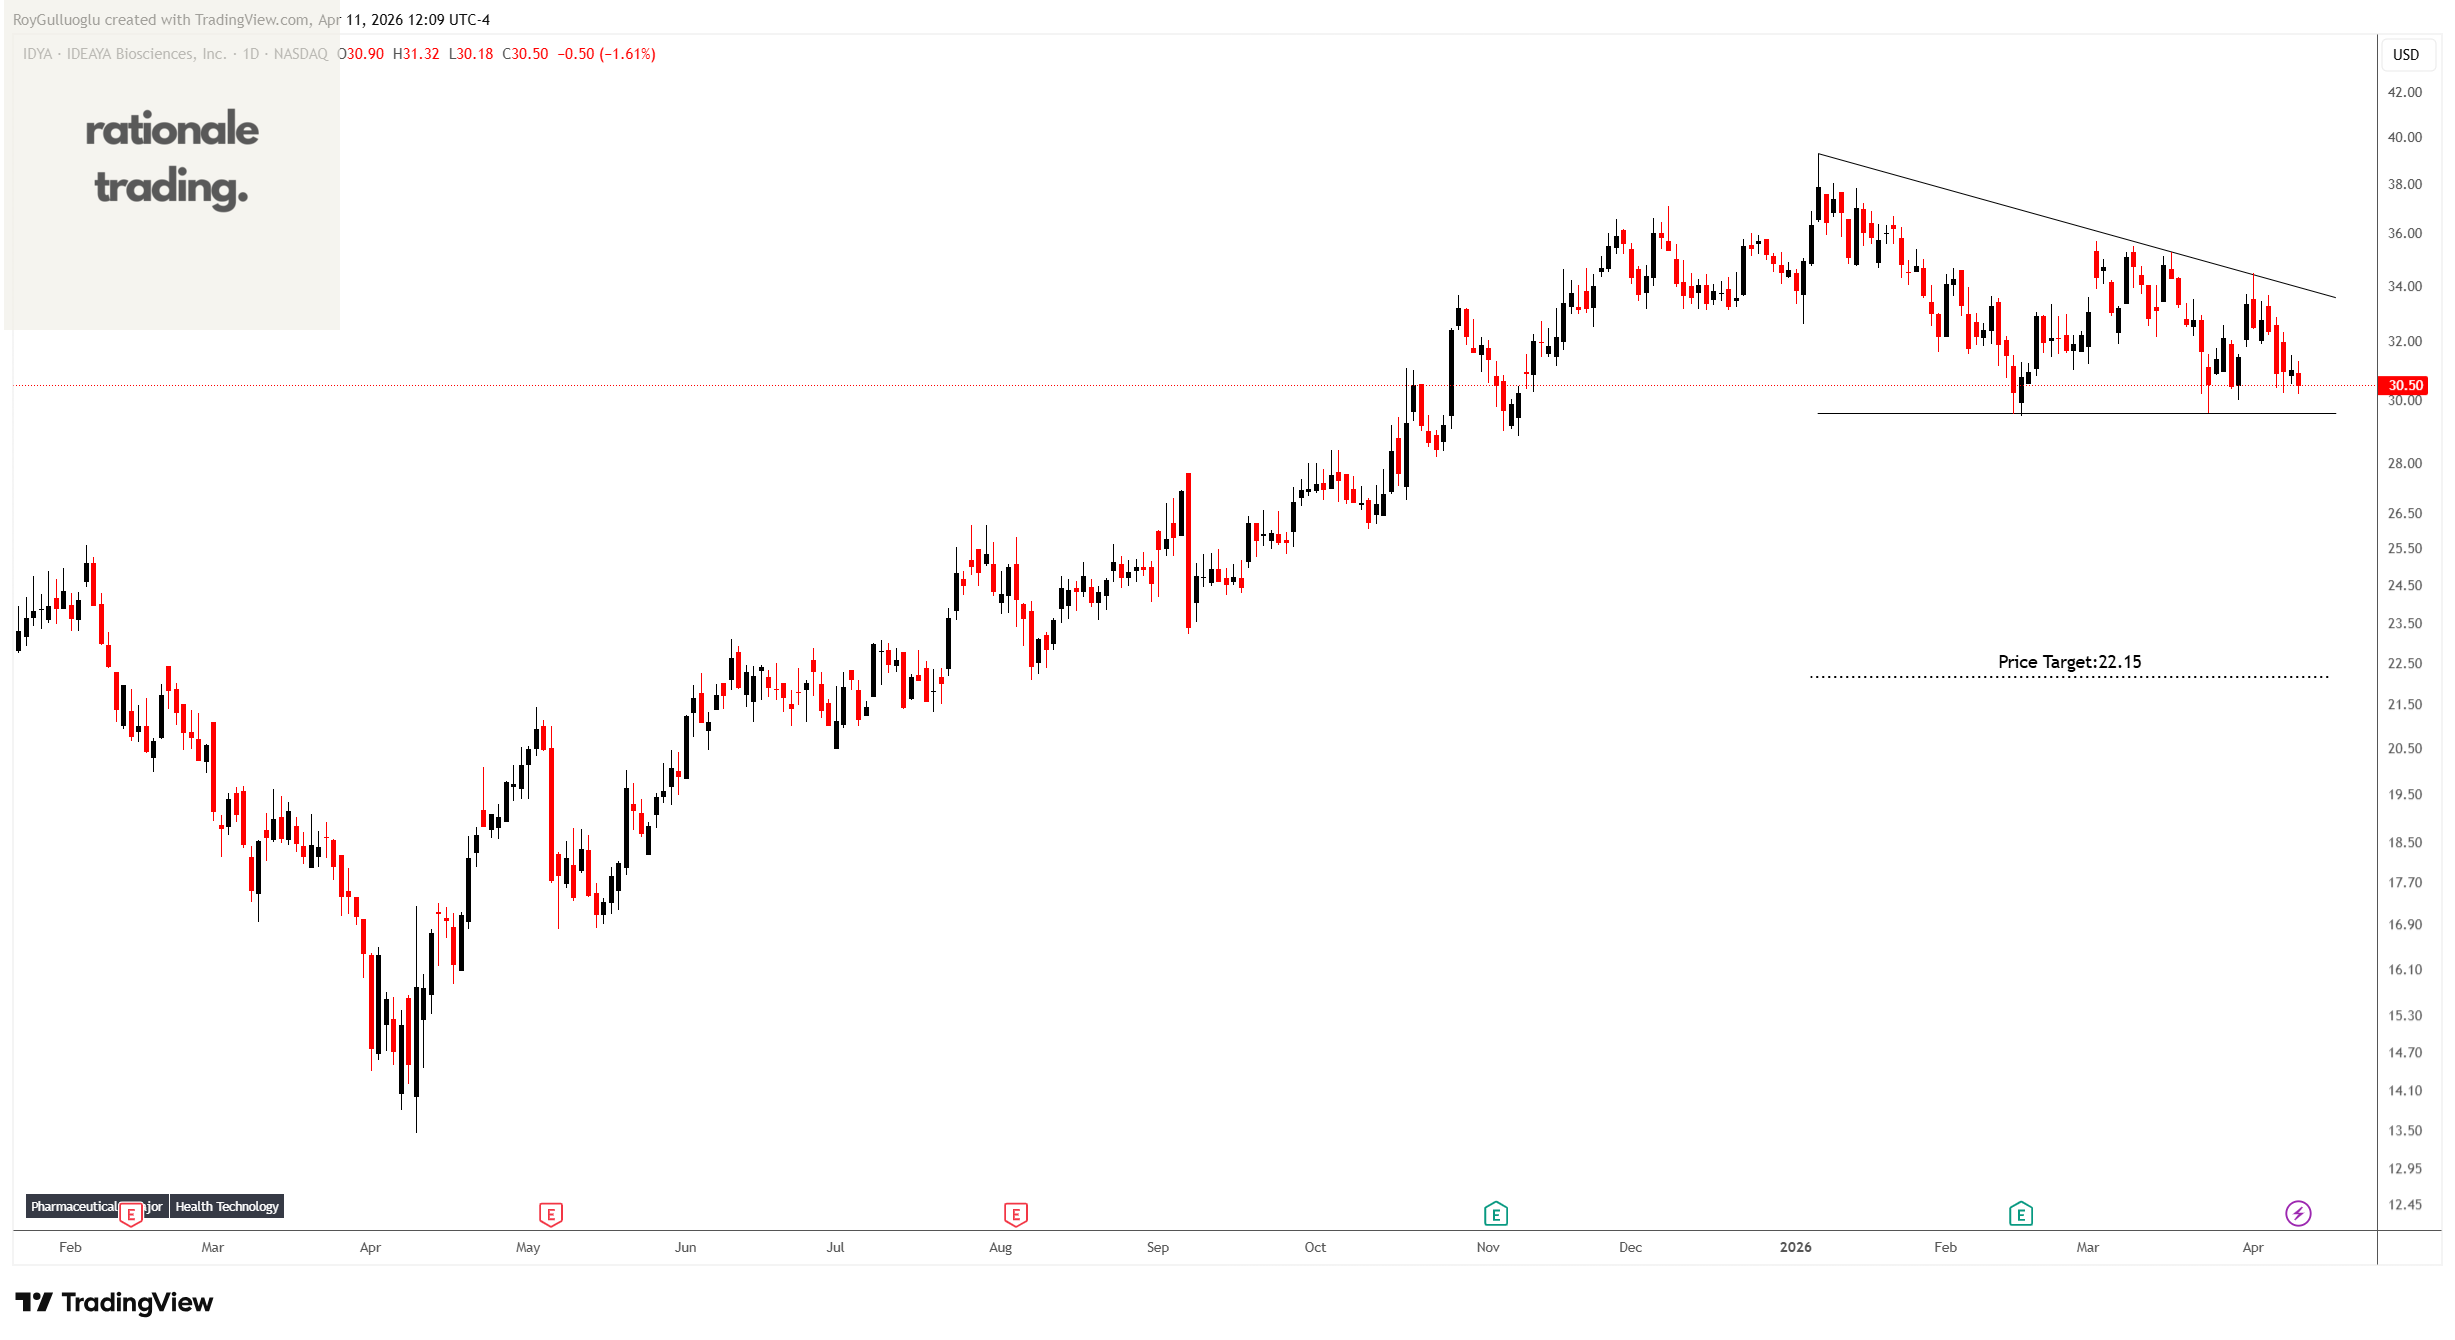
IDEAYA Biosciences, Inc., a precision medicine oncology company, discovers and develops targeted therapeutics for patient populations selected using molecular diagnostics in the United States.
The above daily chart formed an approximately 2-month-long descending triangle chart pattern as a bearish reversal after an uptrend.
The horizontal boundary at 29.57 levels acts as a support within this pattern.
A daily close below 28.7 levels would validate the breakout from the 2-month-long descending triangle chart pattern.
Based on this chart pattern, the potential price target is 22.15 levels.
IDYA, classified under the “helathcare” sector, falls under the “Mid Cap - Value” stock category.
RingCentral, Inc.-(RNG/NYSE)-Long Idea
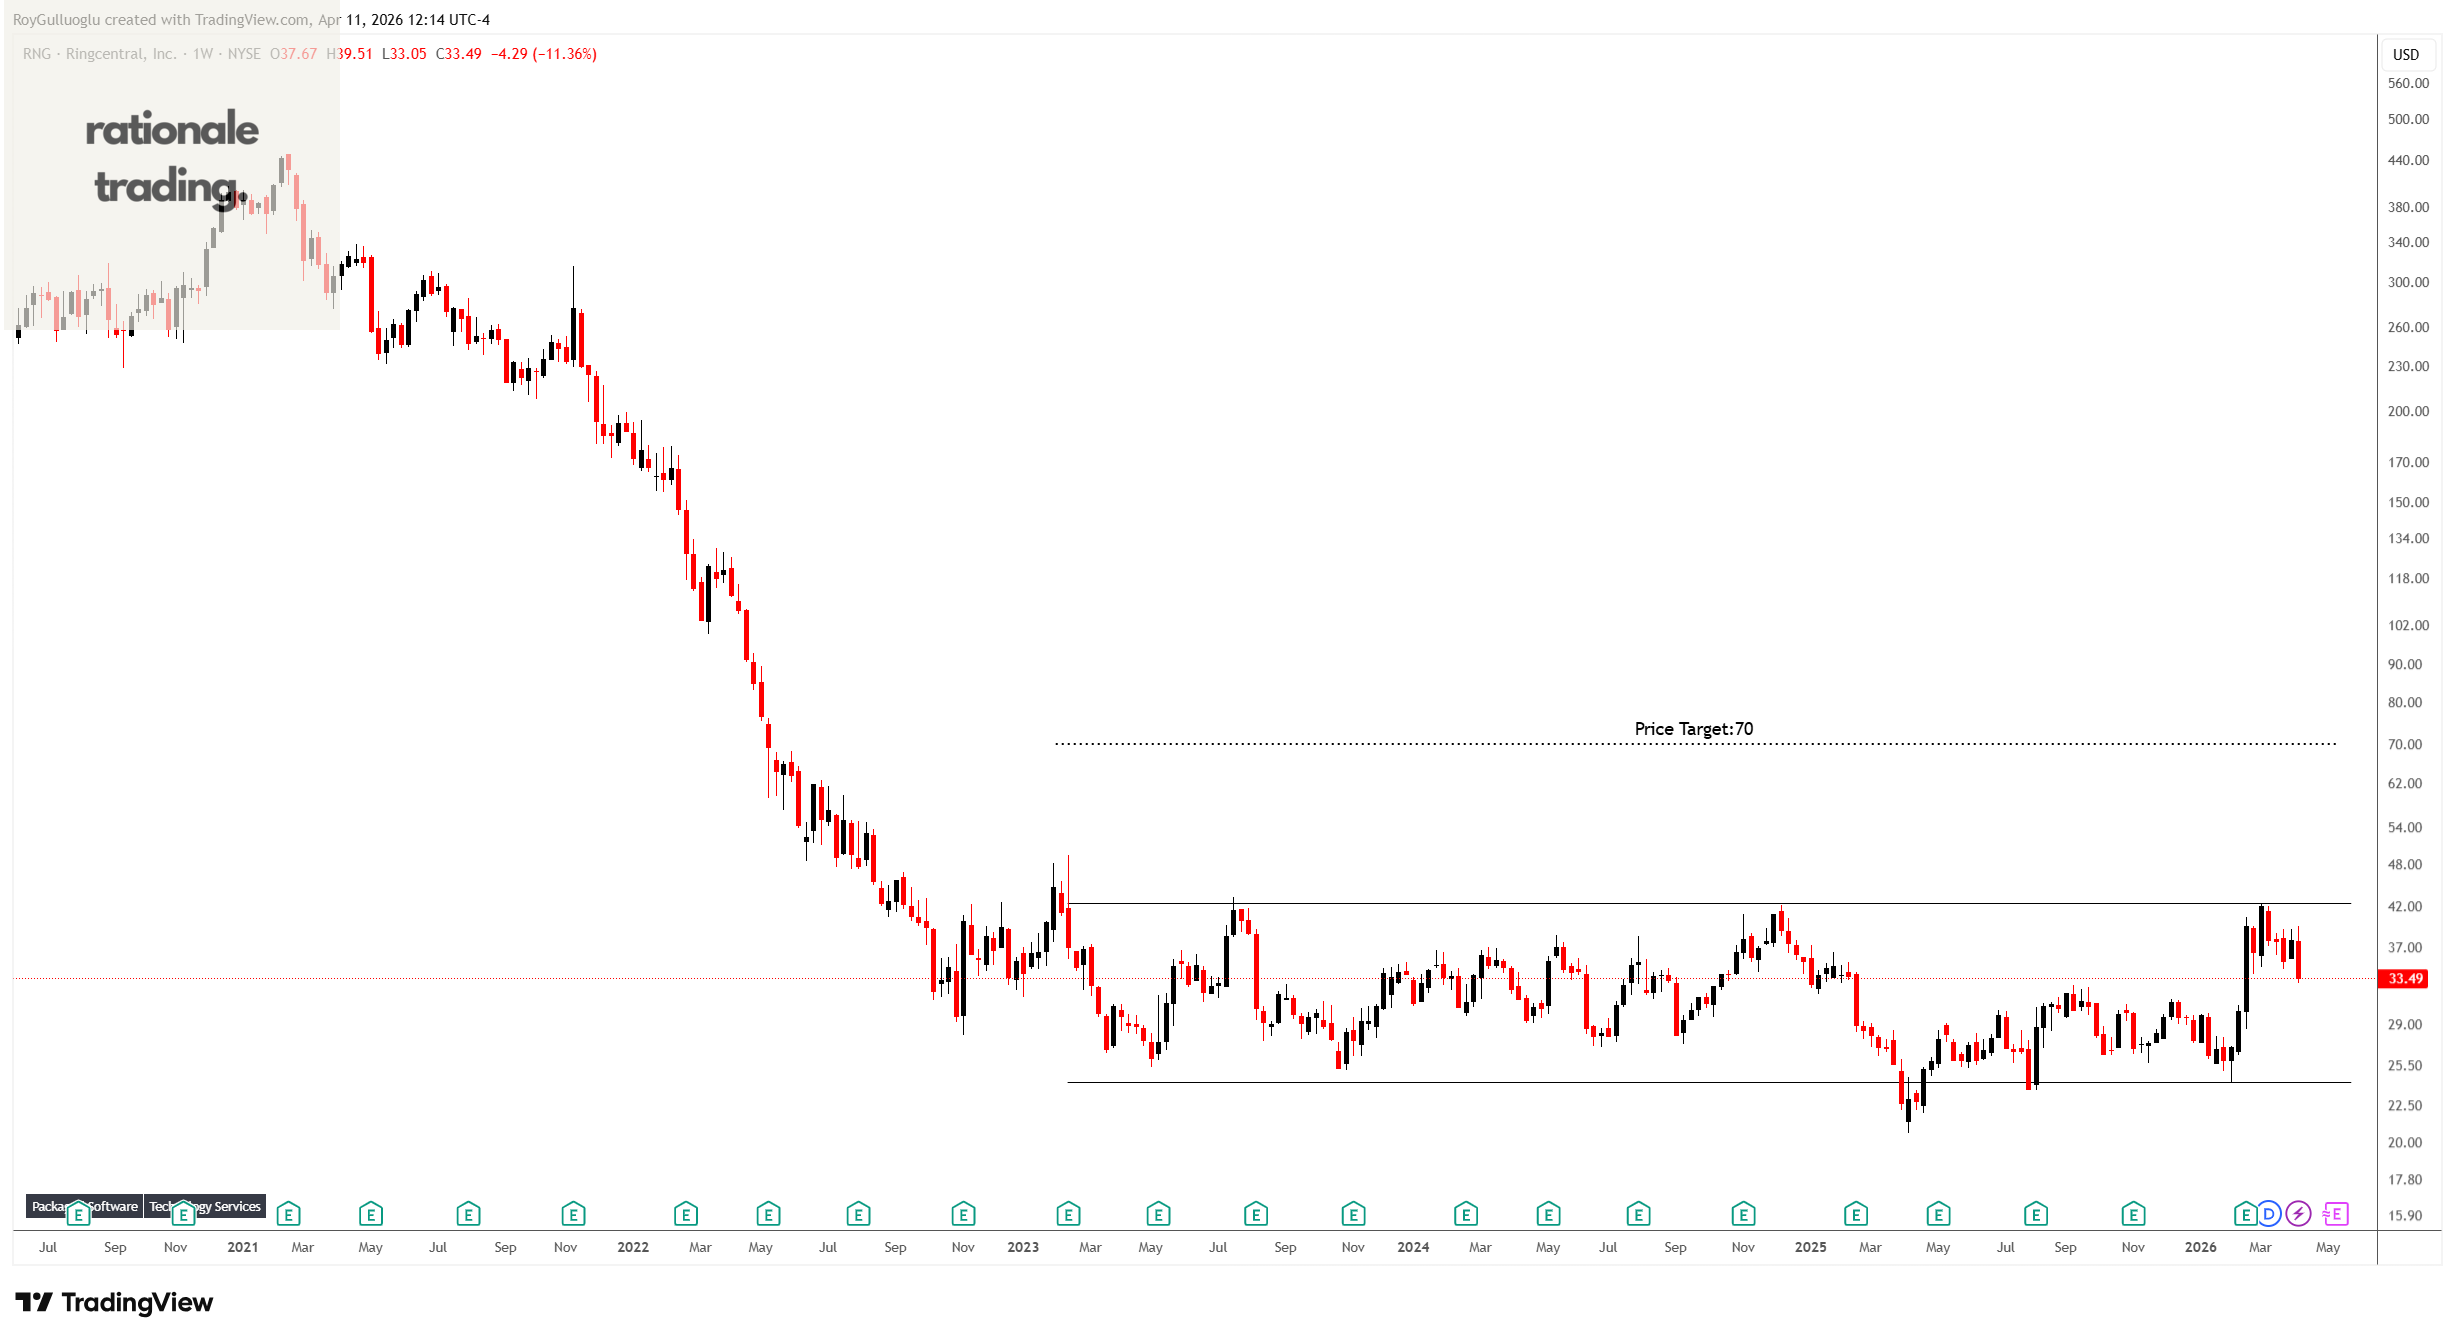
RingCentral, Inc., an agentic voice AIpowered cloud business communication services provider, delivering an integrated platform for business phone, SMS, contact center, workforce engagement management, video collaboration, and messaging.
The above weekly chart formed an approximately 40-month-long rectangle chart pattern as a bullish reversal after a downtrend.
The horizontal boundary at 42.5 levels acts as a resistance within this pattern.
A daily close above 43.75 levels would validate the breakout from the 40-month-long rectangle chart pattern.
Based on this chart pattern, the potential price target is 70 levels.
RNG, classified under the “technology” sector, falls under the “Mid Cap - Growth” stock category.
IAC Inc. -(IAC/NASDAQ)-Long Idea
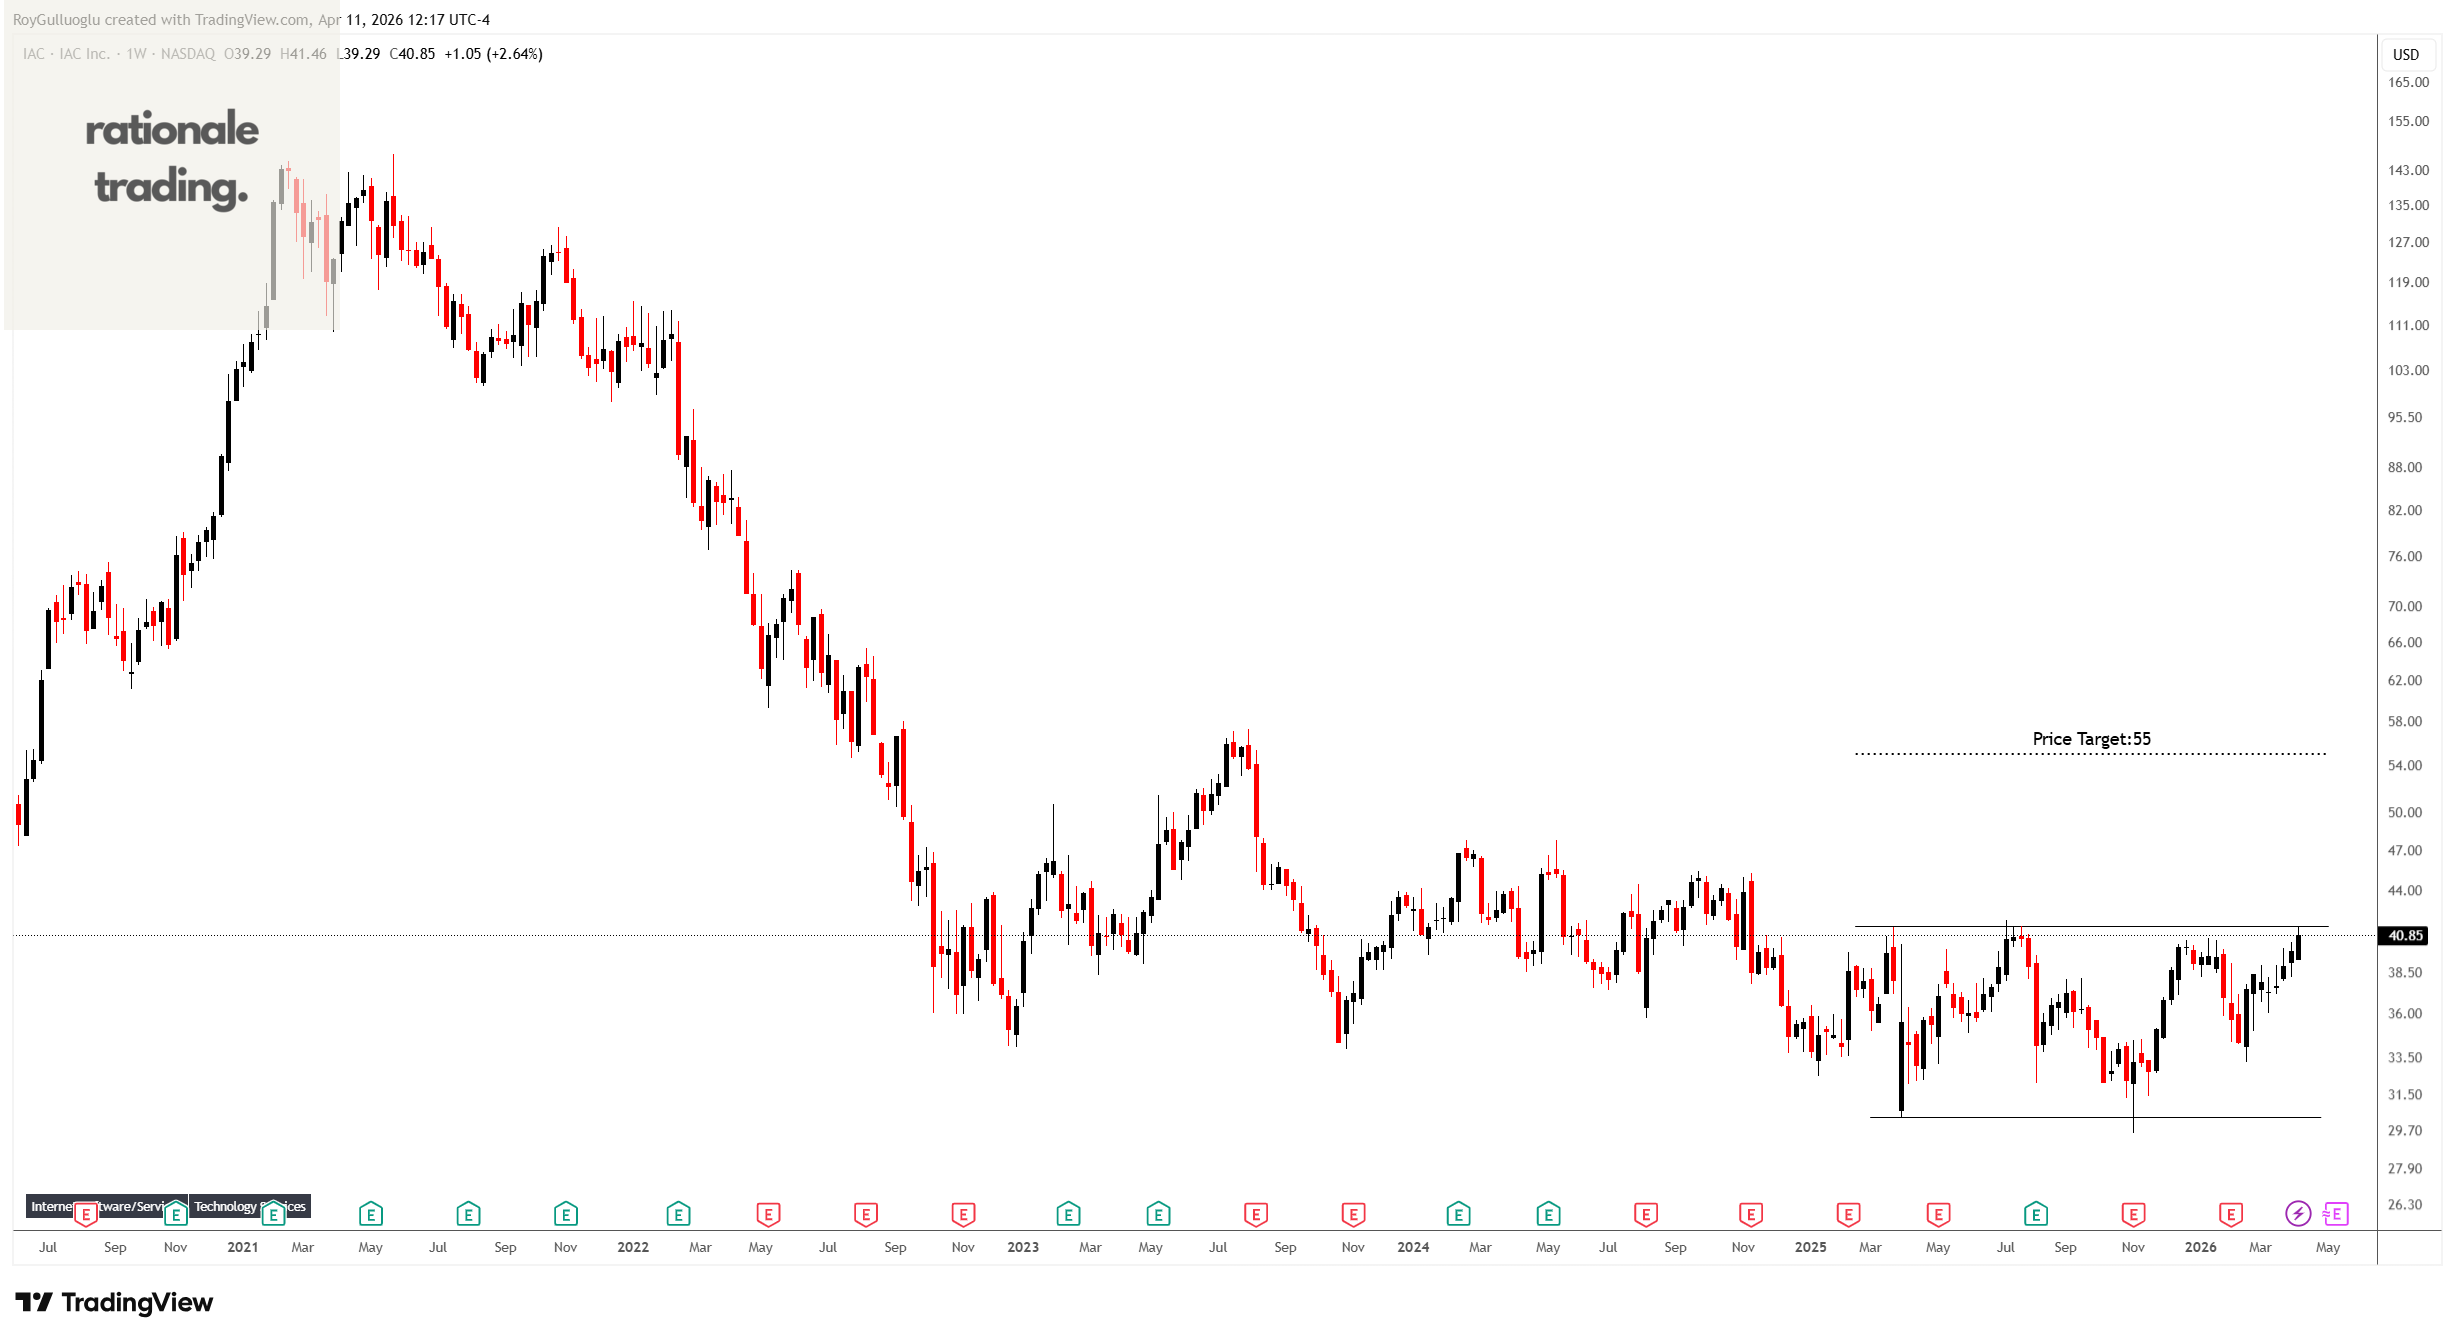
IAC Inc., together with its subsidiaries, operates as a media and internet company worldwide.
The above weekly chart formed an approximately 15-month-long rectangle chart pattern as a bullish reversal after a downtrend.
The horizontal boundary at 41.5 levels acts as a resistance within this pattern.
A daily close above 42.75 levels would validate the breakout from the 15-month-long rectangle chart pattern.
Based on this chart pattern, the potential price target is 55 levels.
IAC, classified under the “communication services” sector, falls under the “Mid Cap - Growth” stock category.
Onto Innovation Inc. -(ONTO/NYSE)-Long Idea
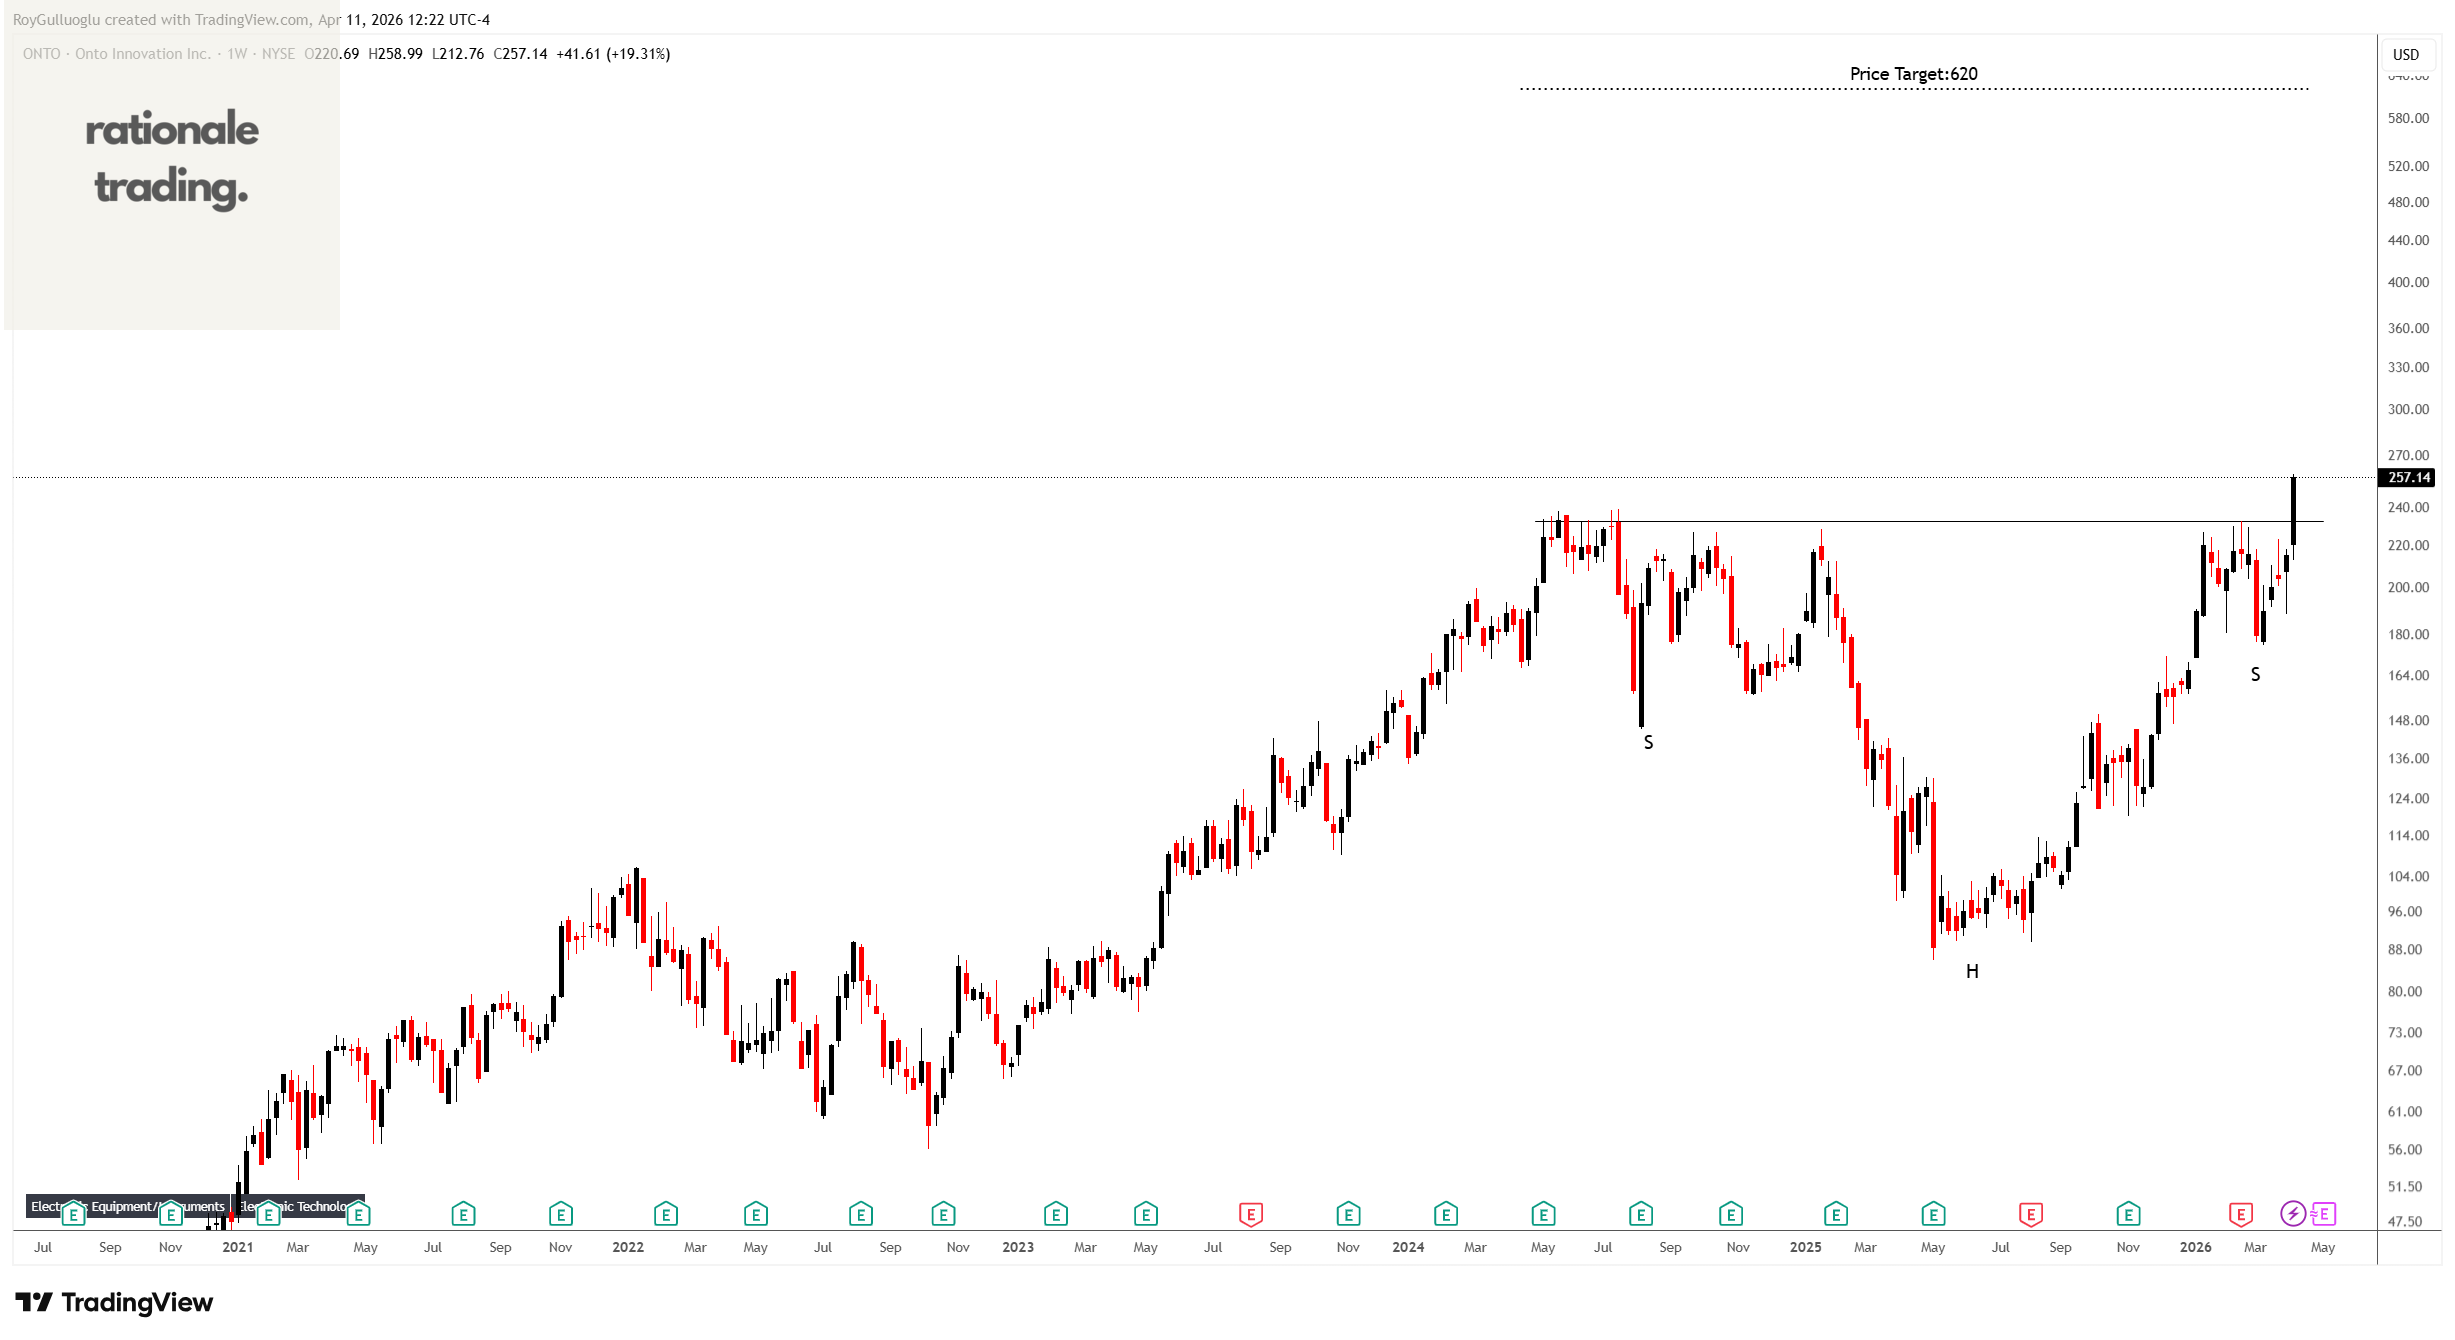
Onto Innovation Inc. engages in the design, development, manufacture, and support of process control tools that perform macro-defect inspection and metrology in the United States, Taiwan, South Korea, Japan, China, Southeast Asia, Asia, and Europe.
The above weekly chart formed an approximately 25-month-long H&S continuation chart pattern as a bullish continuation after an uptrend.
The horizontal boundary at 232.49 levels acted as a resistance within this pattern.
A daily close above 240 levels validated the breakout from the 25-month-long H&S continuation chart pattern.
Based on this chart pattern, the potential price target is 620 levels.
ONTO, classified under the “technology” sector, falls under the “Mid Cap - Growth” stock category.
TTM Technologies, Inc. -(TTMI/NASDAQ)-Long Idea
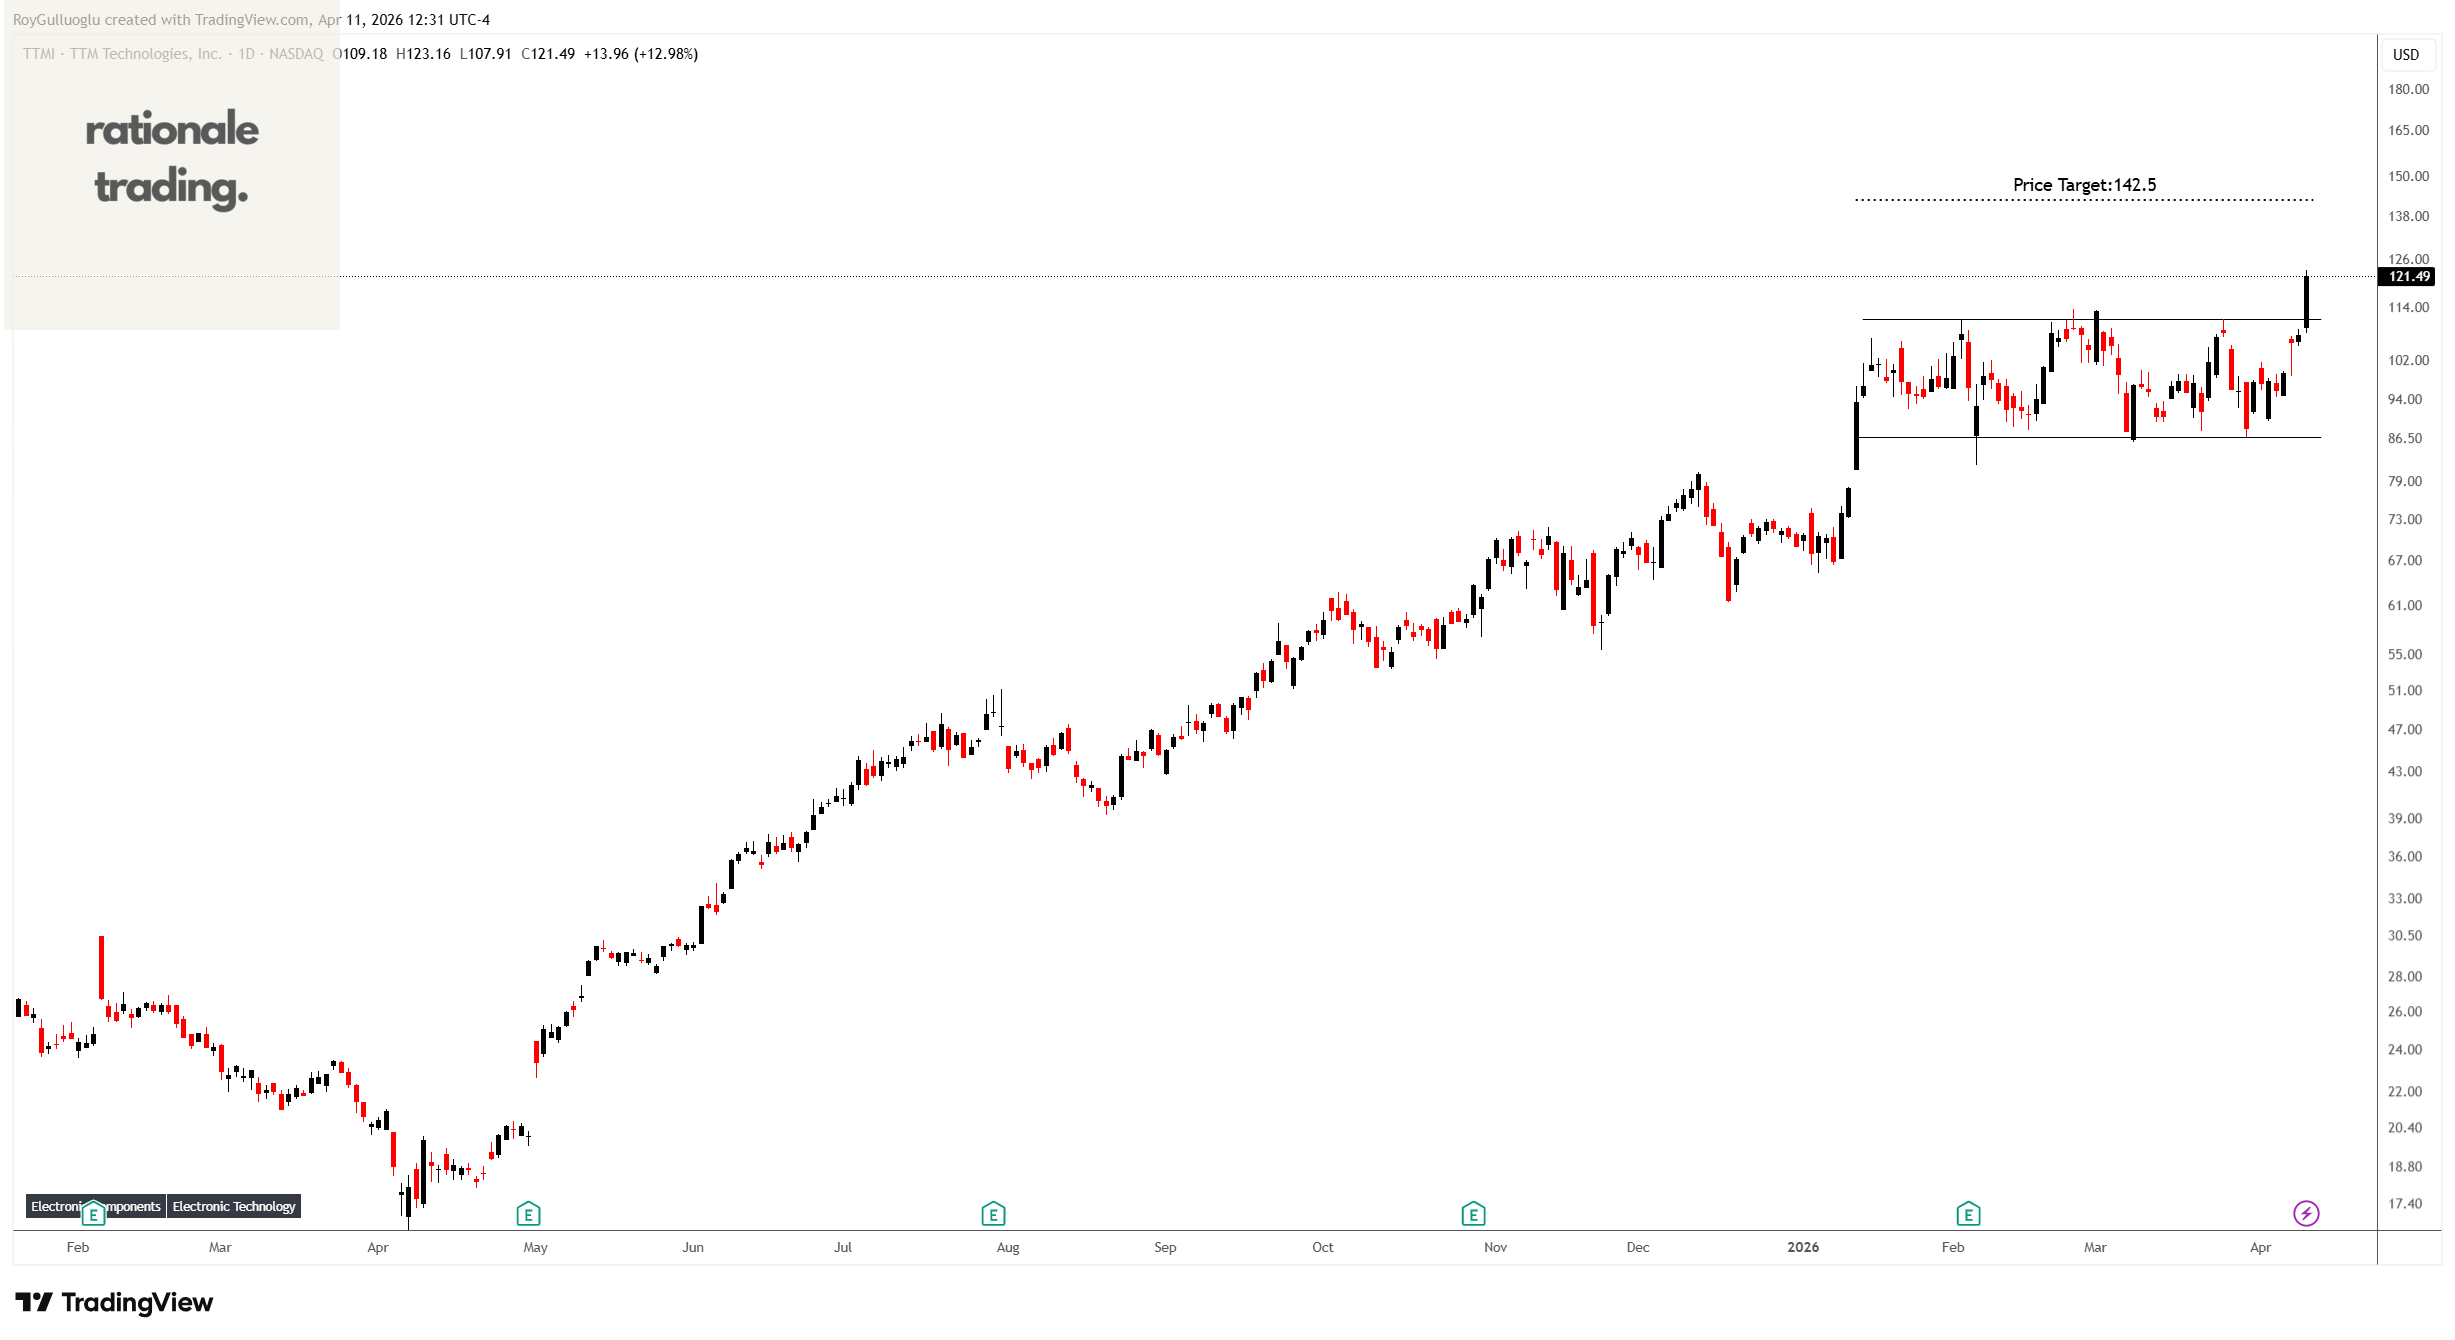
TTM Technologies, Inc. manufactures and sells mission systems, radio frequency (RF) components, RF microwave/microelectronic assemblies, and printed circuit boards (PCBs) and substrates in the United States, Taiwan, and internationally.
The above daily chart formed an approximately 2-month-long rectangle chart pattern as a bullish continuatuon after an uptrend.
The horizontal boundary at 111 levels acted as a resistance within this pattern.
A daily close above 114.33 levels validated the breakout from the 2-month-long rectangle chart pattern.
Based on this chart pattern, the potential price target is 142.5 levels.
TTMI, classified under the “technology” sector, falls under the “Large Cap - Growth” stock category.
Axcelis Technologies, Inc. -(ACLS/NASDAQ)-Long Idea
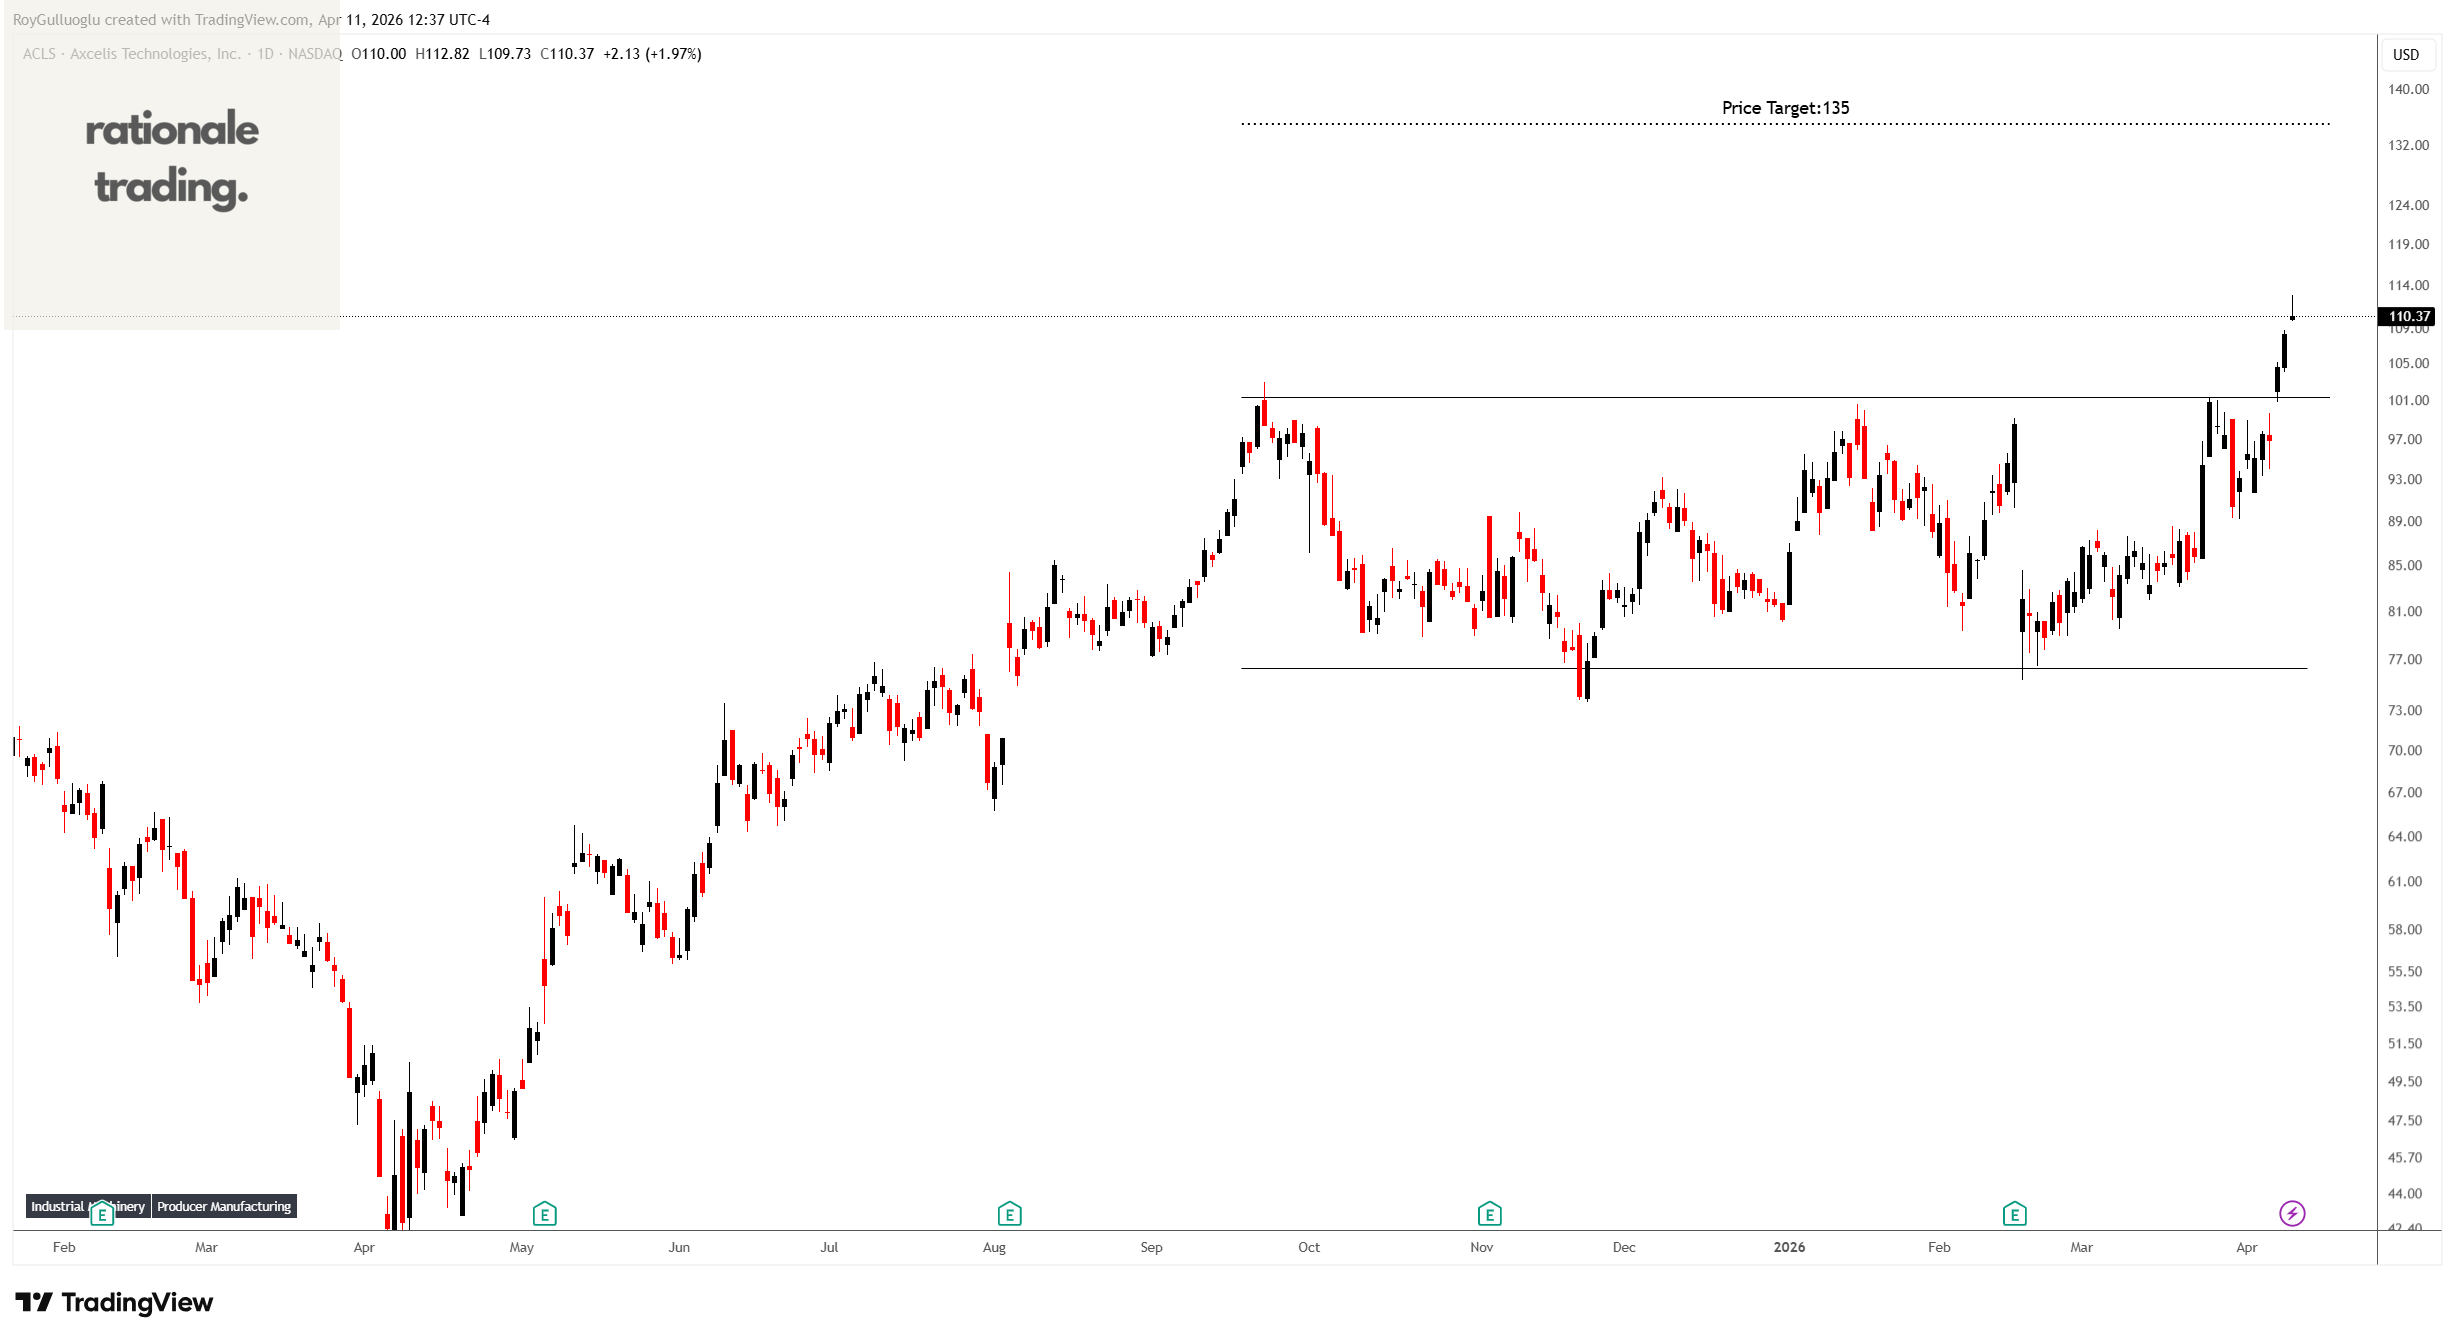
Axcelis Technologies, Inc. designs, manufactures, and services ion implantation and other processing equipment used in the fabrication of semiconductor chips in the United States, Europe, and the Asia Pacific.
The above daily chart formed an approximately 4-month-long rectangle chart pattern as a bullish continuatuon after an uptrend.
The horizontal boundary at 101.35 levels acted as a resistance within this pattern.
A daily close above 104.4 levels validated the breakout from the 4-month-long rectangle chart pattern.
Based on this chart pattern, the potential price target is 135 levels.
ACLS, classified under the “technology” sector, falls under the “Mid Cap - Growth” stock category.