


Teledyne Technologies Incorporated-(TDY/NYSE)-Short Idea
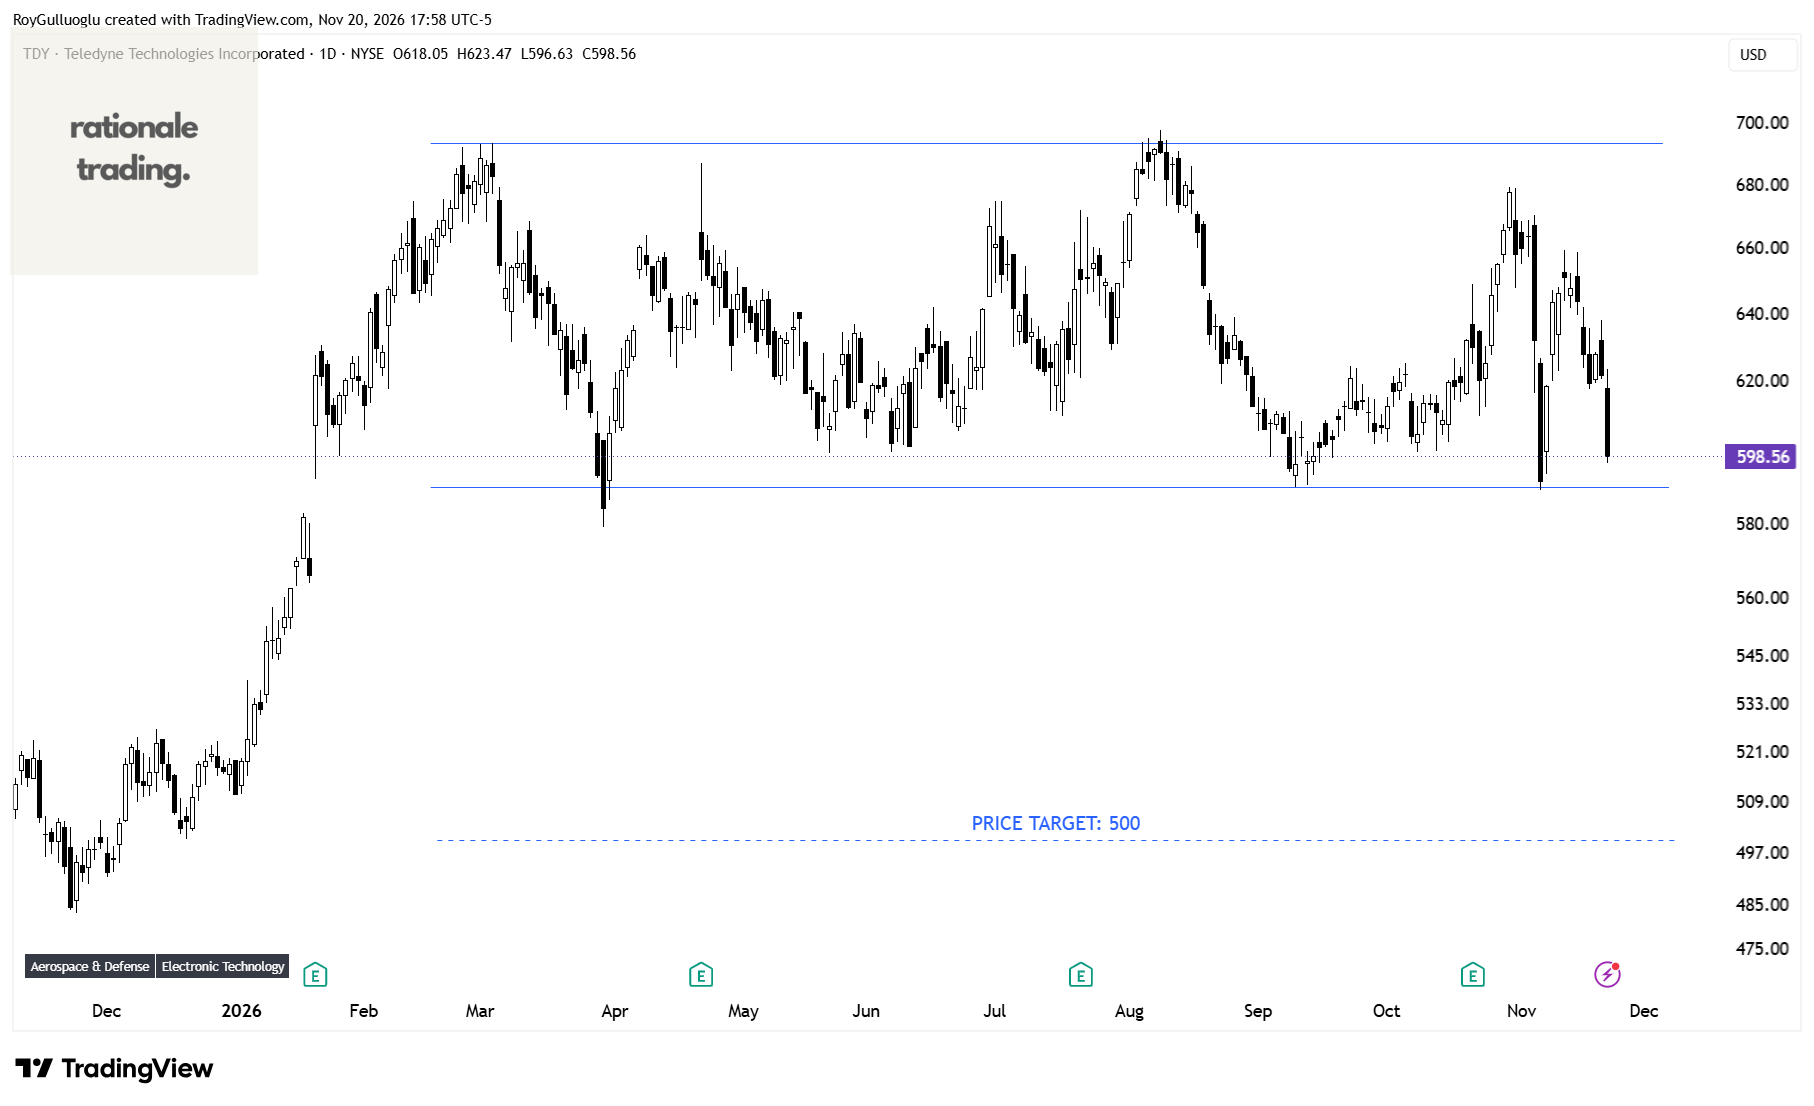
Teledyne Technologies Incorporated provides enabling technologies for industrial growth markets in the United States, Europe, Asia, and internationally.
The above daily chart formed an approximately 6-month-long rectangle chart pattern as a bearish reversal after an uptrend.
Within this pattern, the horizontal boundary at 590.1 levels acts as a resistance.
A daily close below 573 levels would validate the breakout from the 6-month-long rectangle chart pattern.
Based on this chart pattern, the potential price target is 500 levels.
Watts Water Technologies, Inc.-(WTS/NYSE)-Short Idea
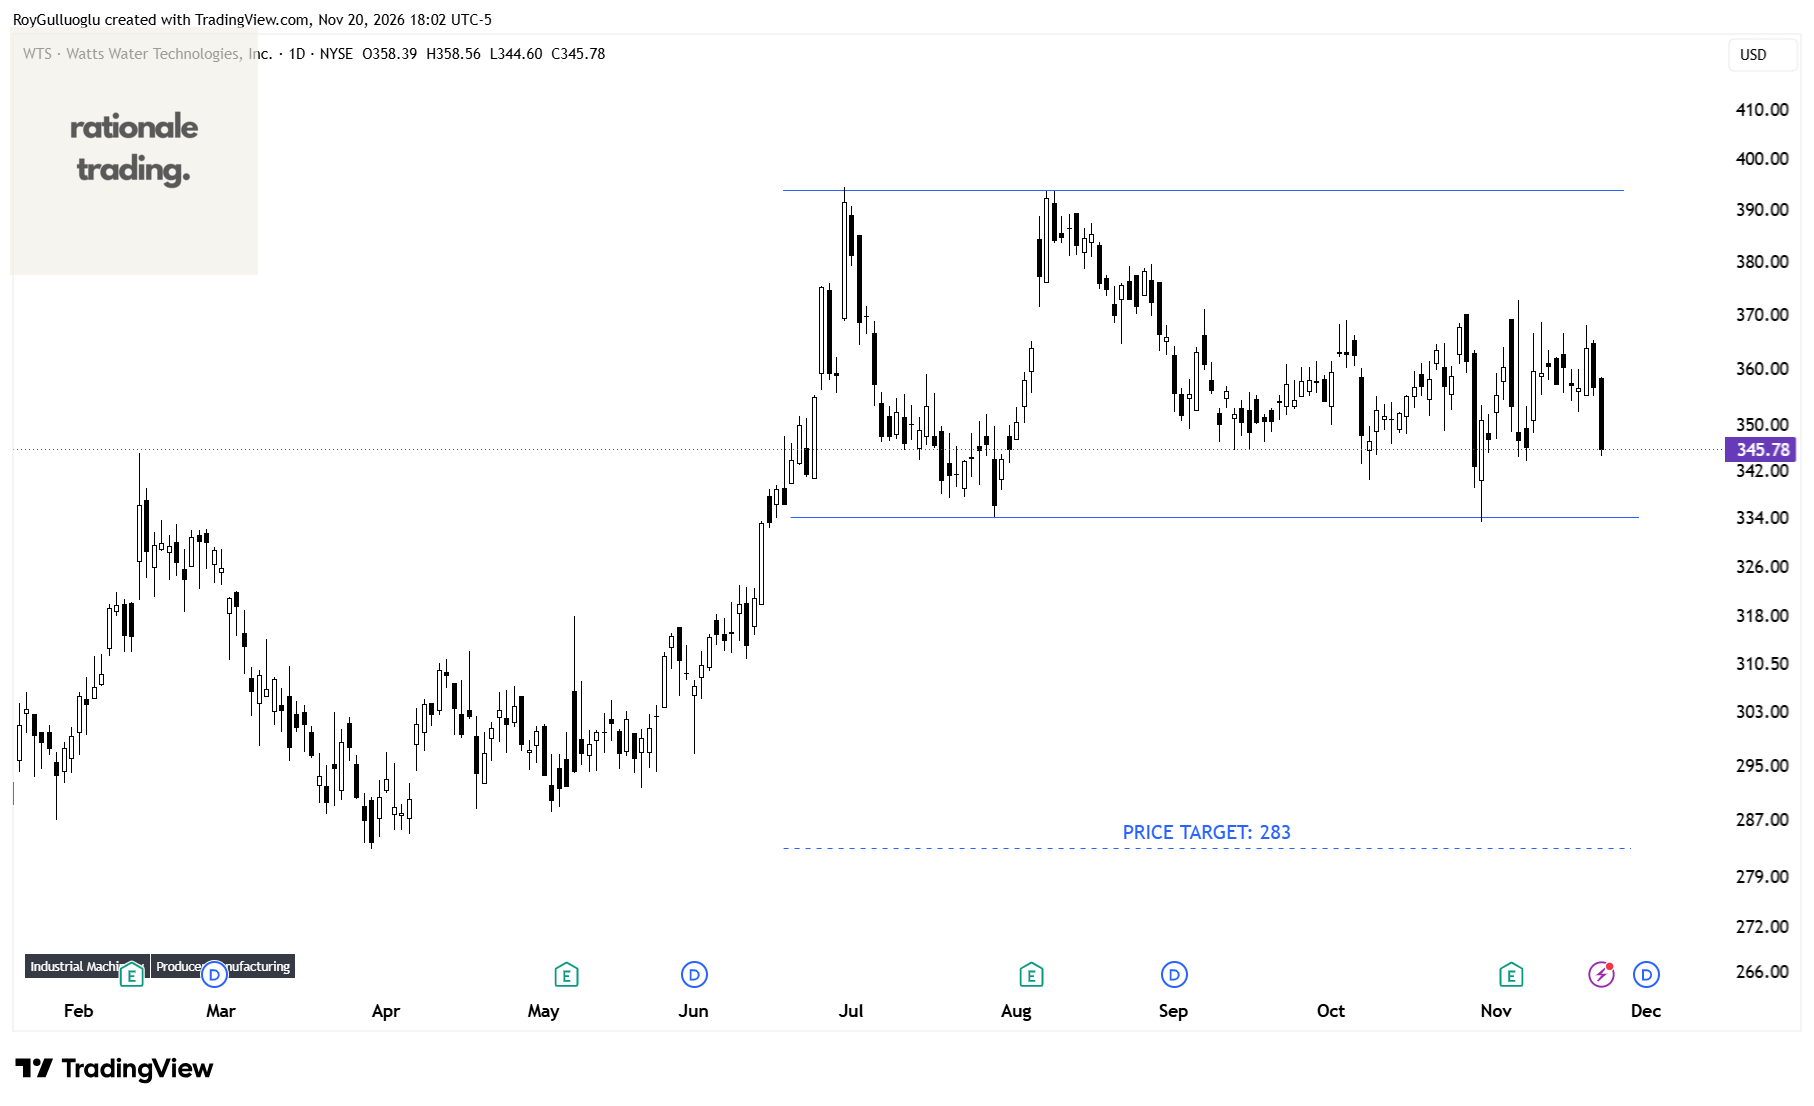
Watts Water Technologies, Inc., together with its subsidiaries, supplies products and solutions that manage and conserve the flow of fluids and energy into, through, and out of buildings in the commercial, industrial, and residential markets.
The above daily chart formed an approximately 3-month-long rectangle chart pattern as a bearish reversal after an uptrend.
Within this pattern, the horizontal boundary at 334.12 levels acts as a resistance.
A daily close below 324 levels would validate the breakout from the 3-month-long rectangle chart pattern.
Based on this chart pattern, the potential price target is 283 levels.
The Cheesecake Factory Incorporated-(CAKE/NASDAQ)-Long Idea
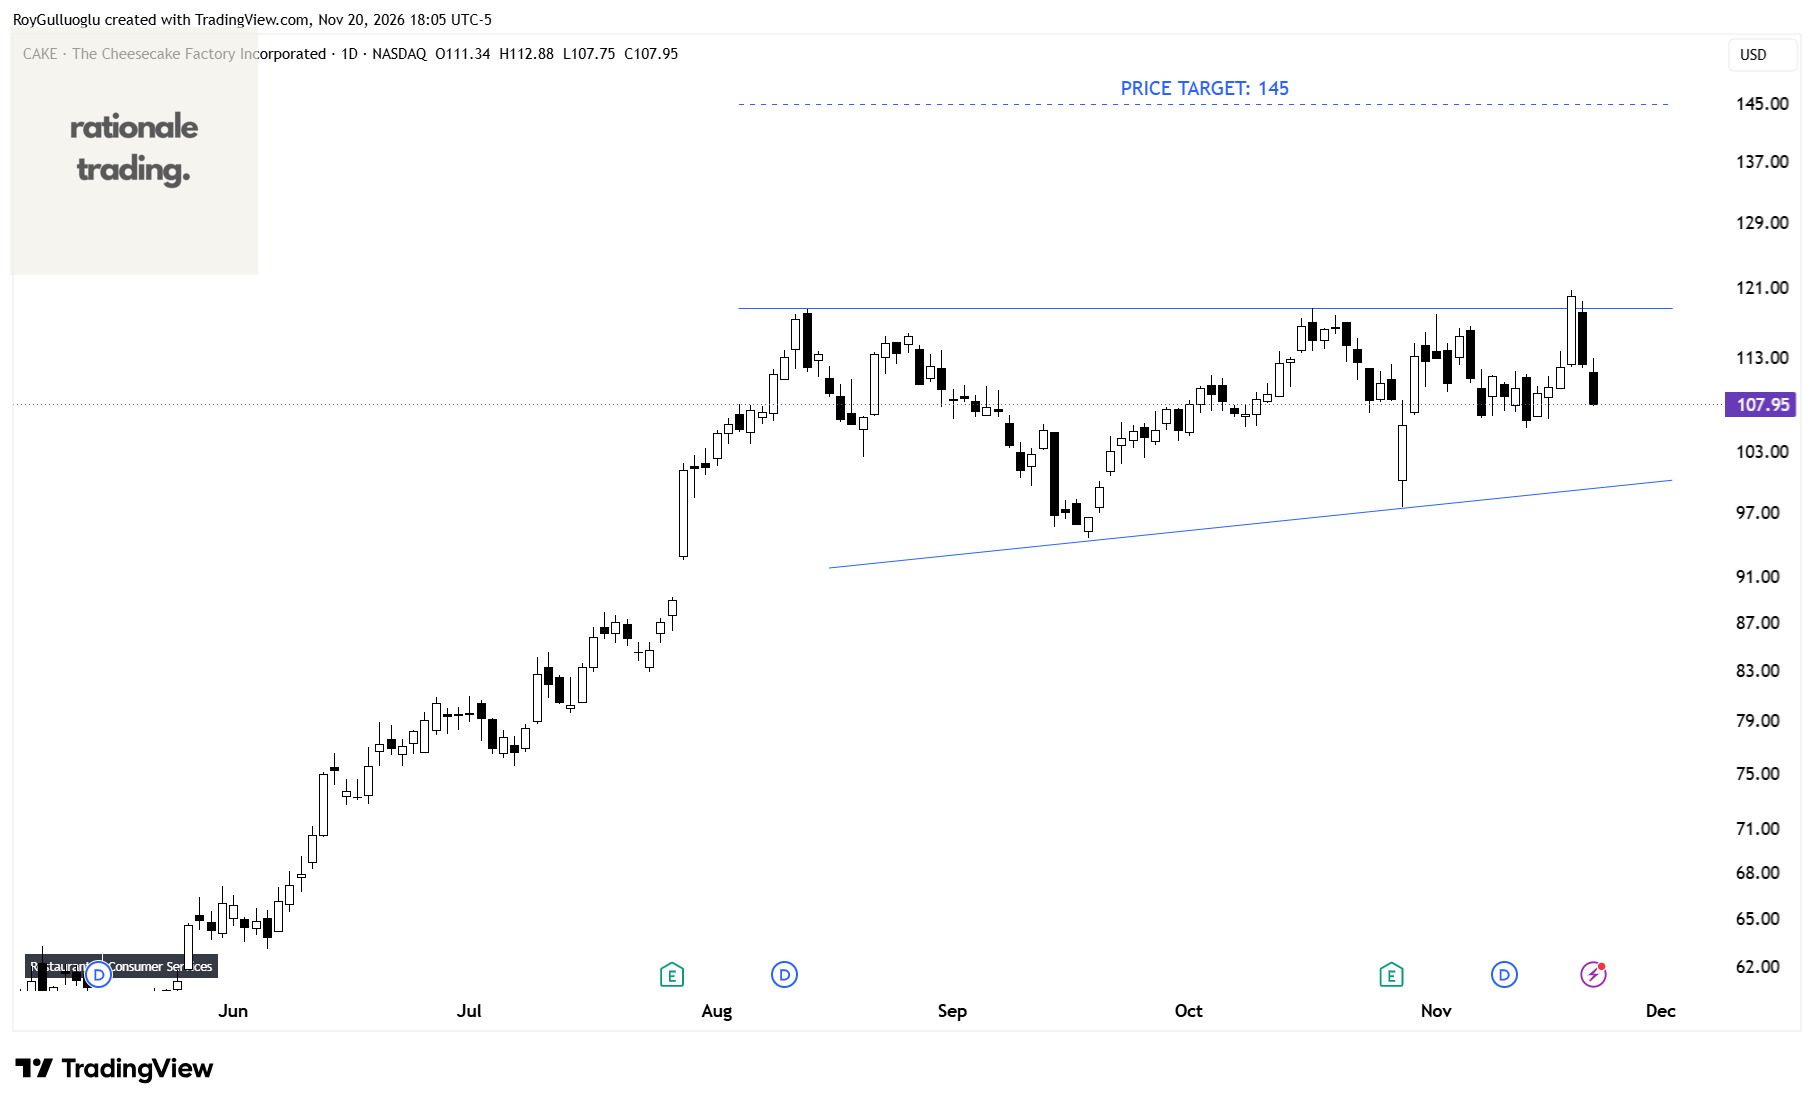
The Cheesecake Factory Incorporated operates and licenses restaurants in the United States and Canada.
The above daily chart formed an approximately 2-month-long ascending triangle chart pattern as a bullish continuation after an uptrend.
Within this pattern, the horizontal boundary at 118.63 levels acts as a resistance.
A daily close above 122.18 levels would validate the breakout from the 2-month-long ascending triangle chart pattern.
Based on this chart pattern, the potential price target is 145 levels.