


Village Farms International, Inc.-(VFF/NASDAQ)-Long Idea
Village Farms International, Inc., together with its subsidiaries, produces, markets, and distributes greenhouse grown tomatoes, bell peppers, and cucumbers in North America and Netherlands.
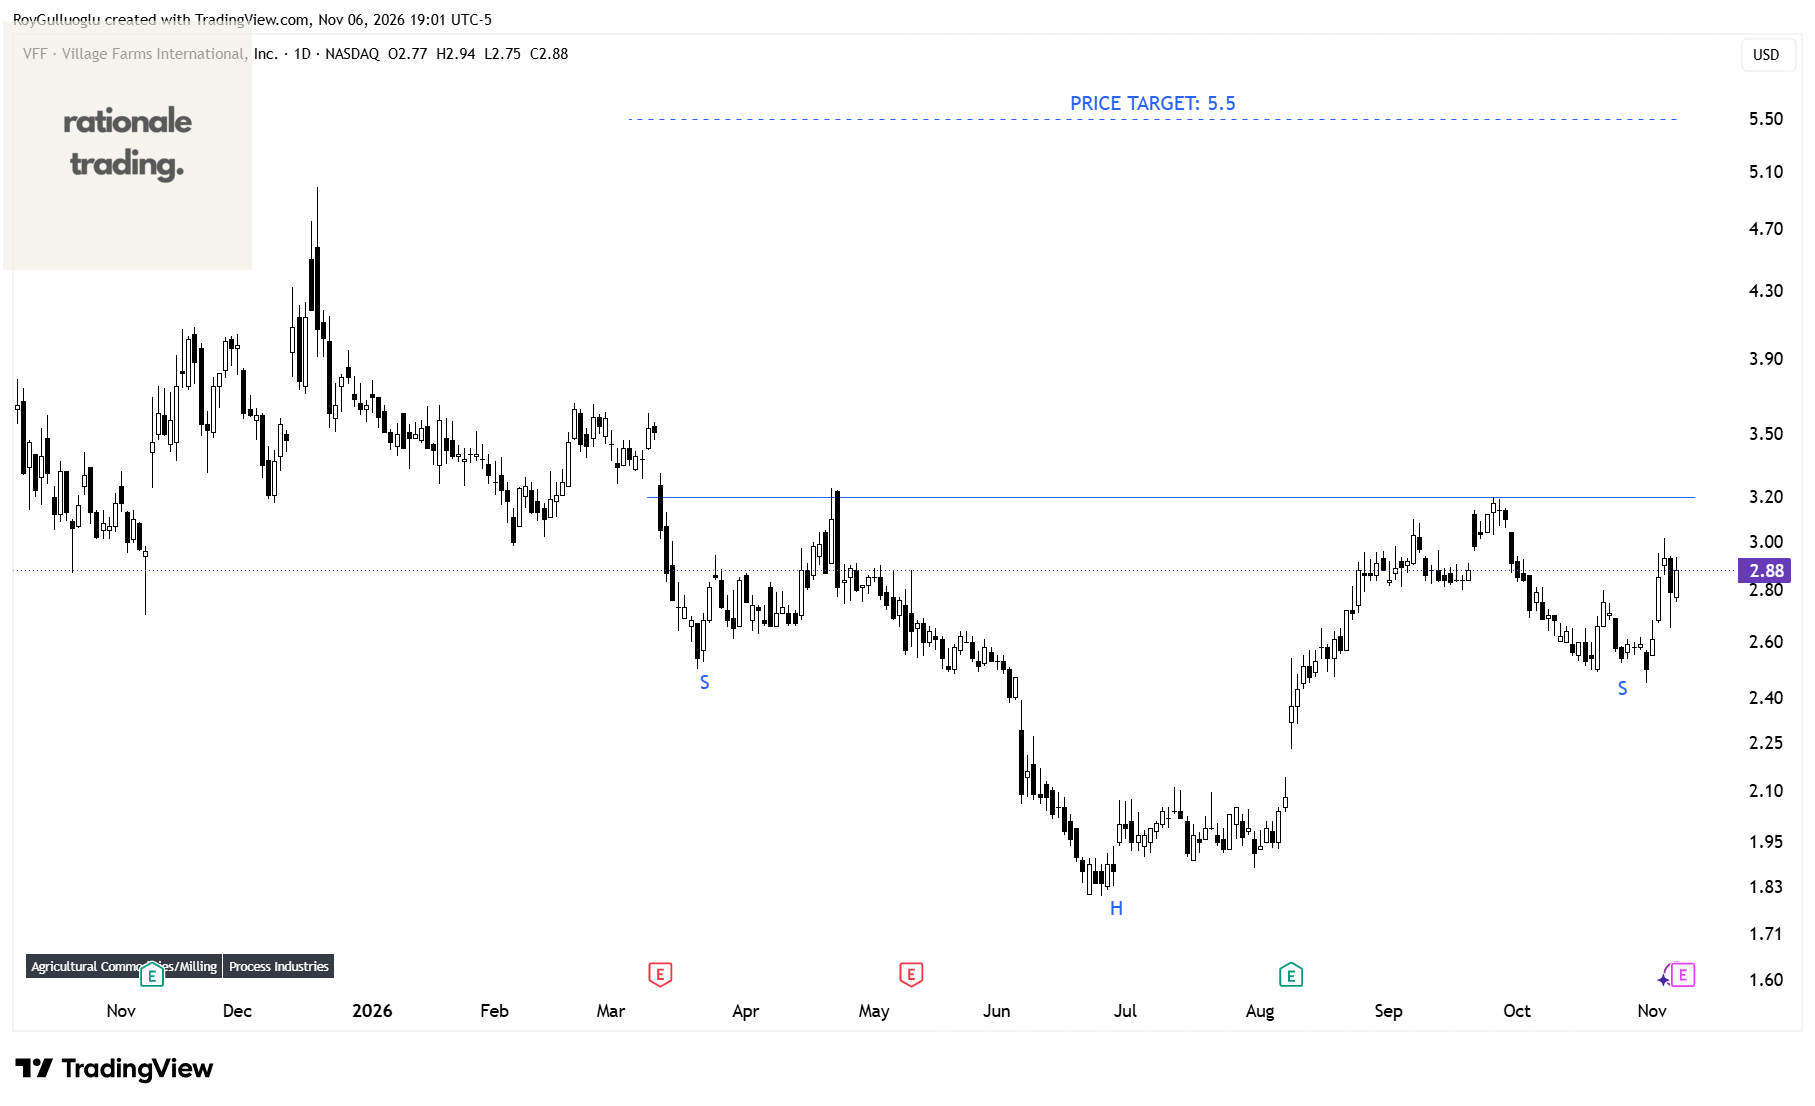
The above daily chart formed an approximately 5-month-long H&S bottom chart pattern as a bullish reversal after a downtrend.
Within this pattern, the horizontal boundary at 3.2 levels acts as a resistance.
A daily close above 3.29 levels would validate the breakout from the 5-month-long H&S bottom chart pattern.
Based on this chart pattern, the potential price target is 5.5 levels.
Costco Wholesale Corporation-(COST/NASDAQ)-Long Idea
Costco Wholesale Corporation, together with its subsidiaries, engages in the operation of membership warehouses in the United States, Puerto Rico, Canada, Mexico, Japan, the United Kingdom, Korea, Australia, Taiwan, China, Spain, France, Sweden, Iceland, and New Zealand.
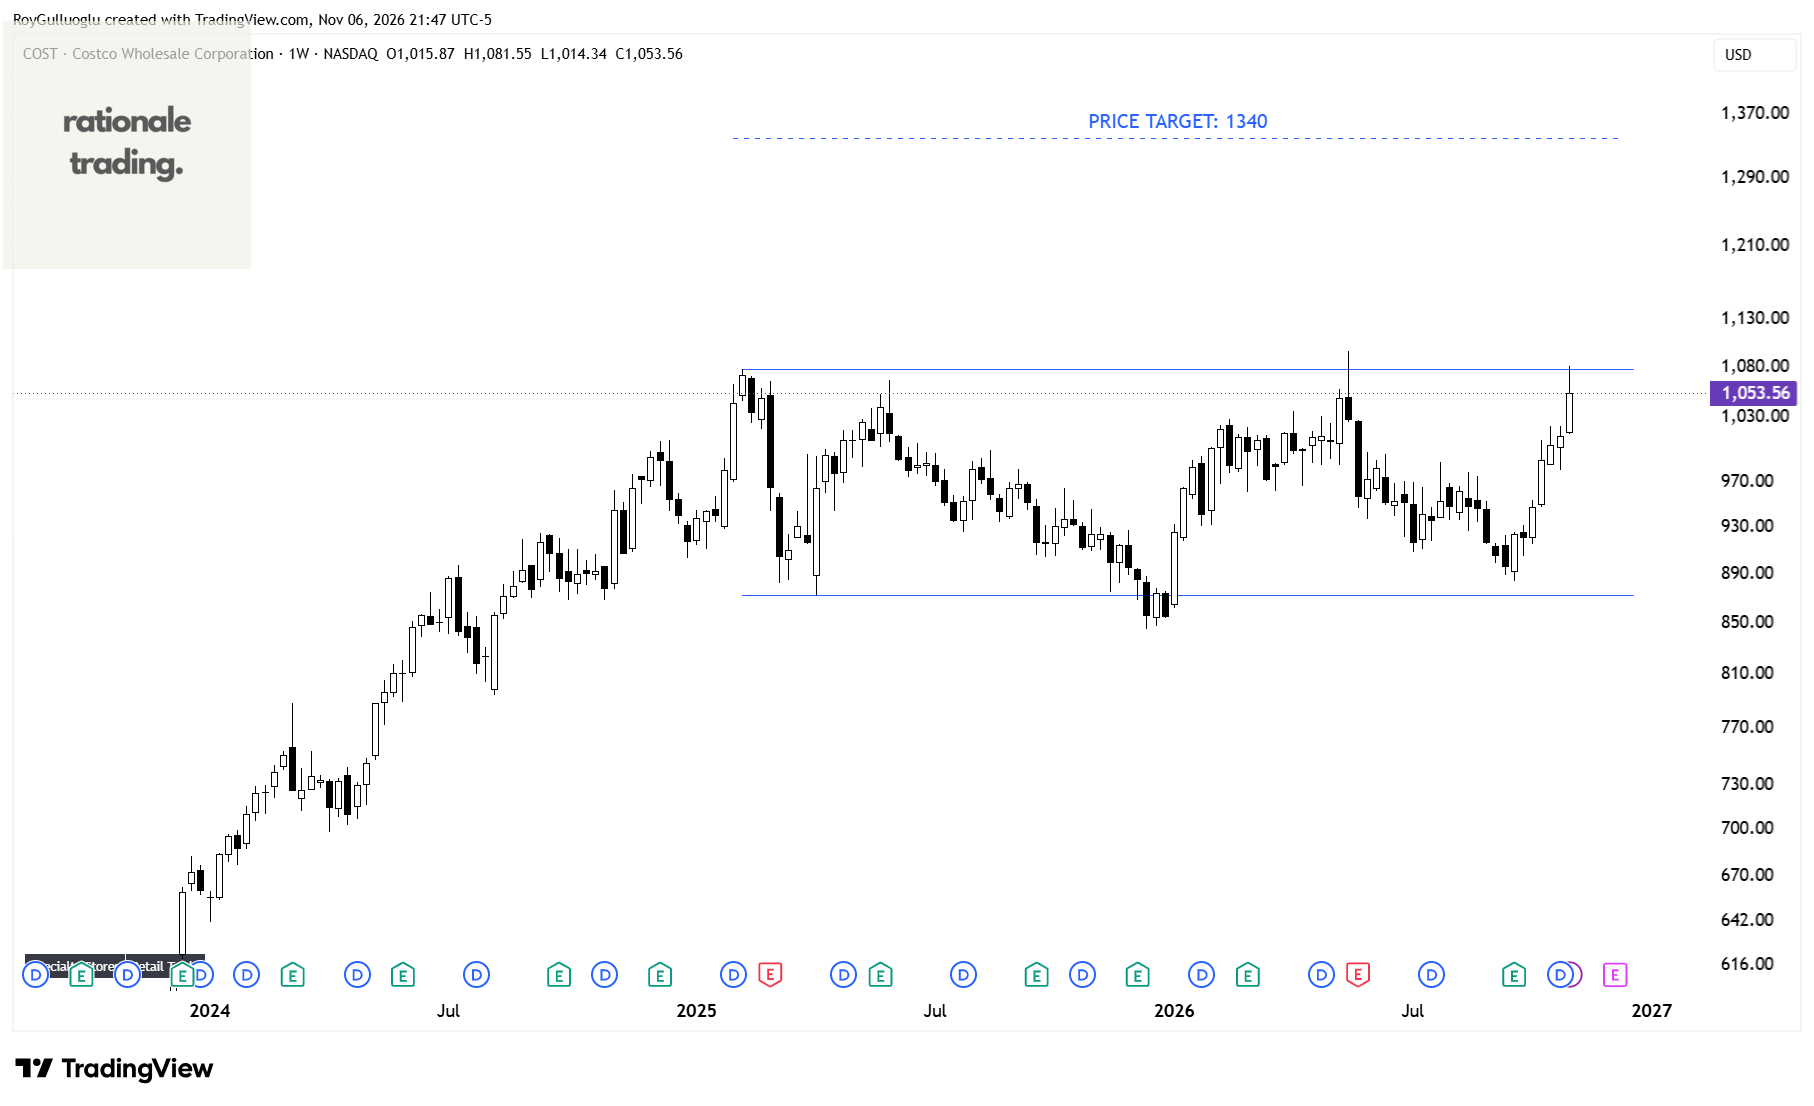
The above weekly chart formed an approximately 22-month-long rectangle chart pattern as a bullish continuation after an uptrend.
Within this pattern, the horizontal boundary at 1078 levels acts as a resistance.
A daily close above 1110 levels would validate the breakout from the 22-month-long rectangle chart pattern.
Based on this chart pattern, the potential price target is 1340 levels.
Sezzle Inc.-(SEZL/NASDAQ)-Long Idea
Sezzle Inc. operates as a technology-enabled payments company in the United States and Canada.
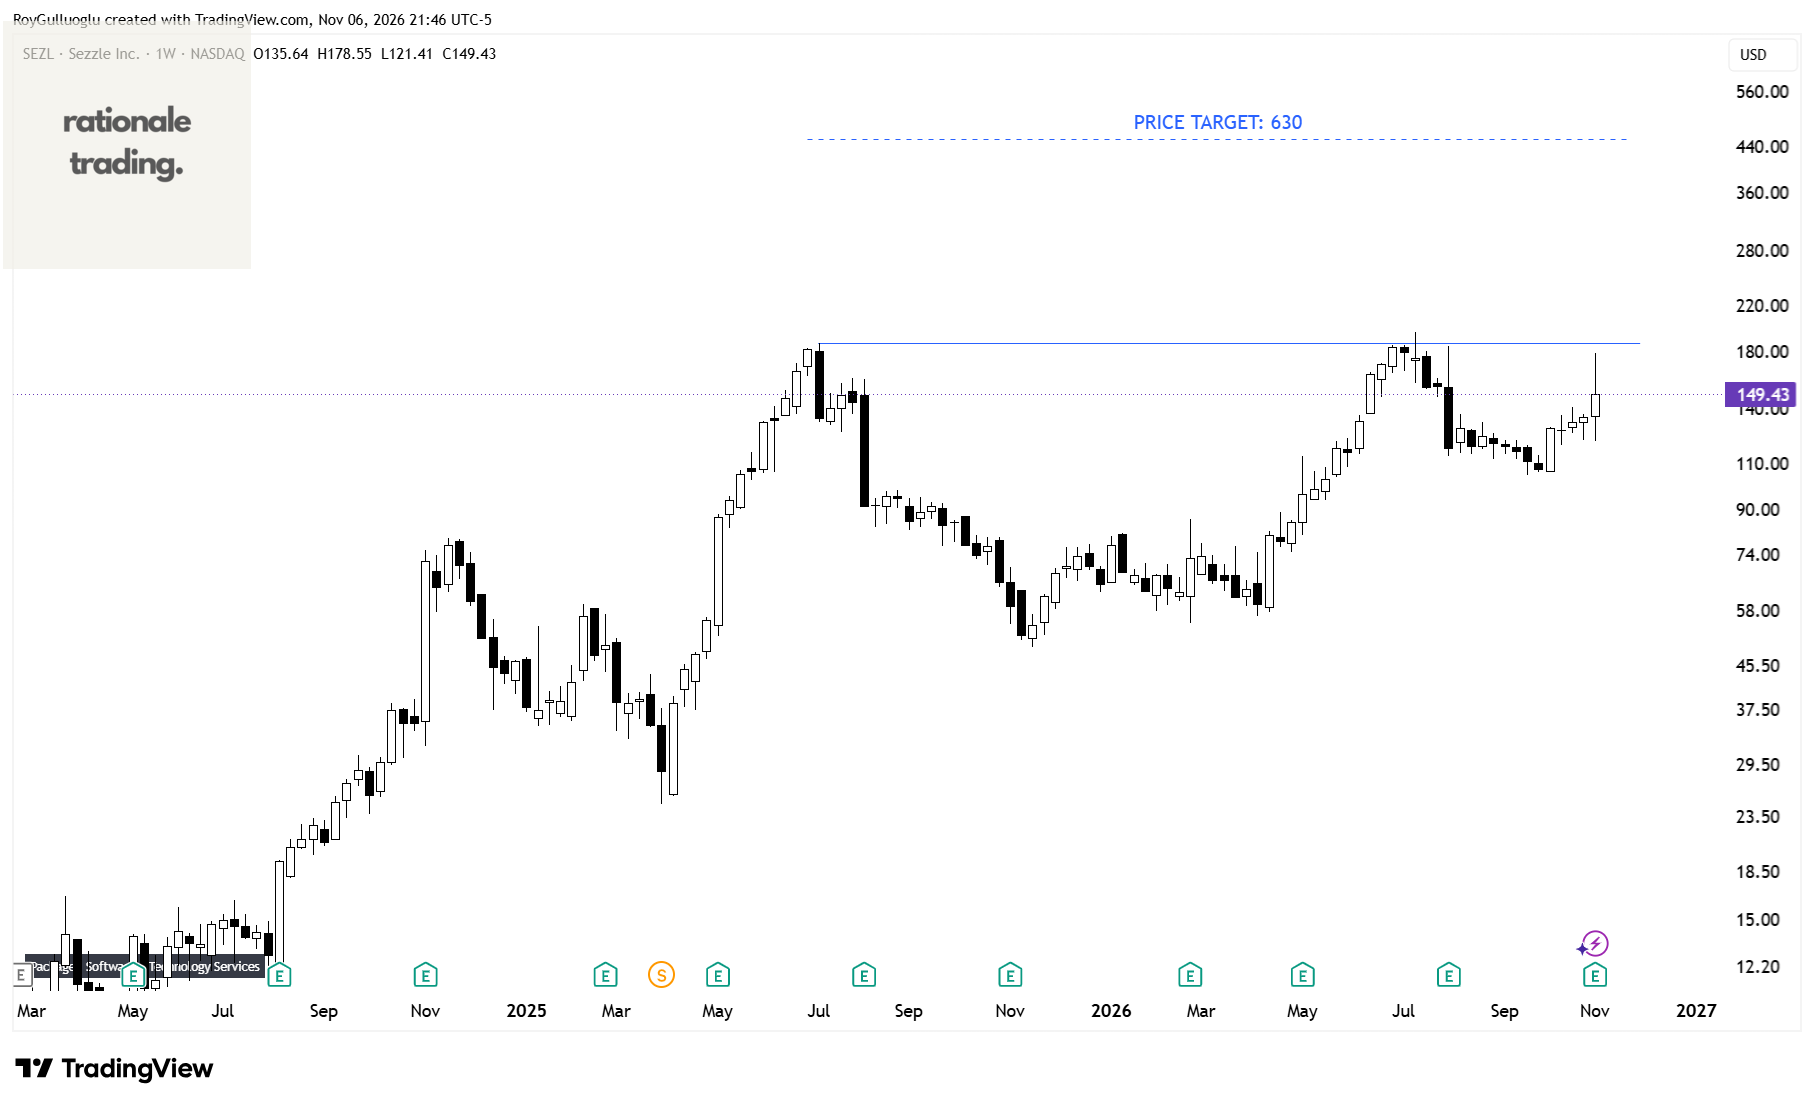
The above weekly chart formed an approximately 18-month-long cup & handle chart pattern as a bullish continuation after an uptrend.
Within this pattern, the horizontal boundary at 186.74 levels acts as a resistance.
A daily close above 192.35 levels would validate the breakout from the 18-month-long cup & handle chart pattern.
Based on this chart pattern, the potential price target is 630 levels.
First Watch Restaurant Group, Inc.-(FWRG/NASDAQ)-Long Idea
First Watch Restaurant Group, Inc., through its subsidiaries, operates and franchises restaurants under the First Watch trade name in the United States.
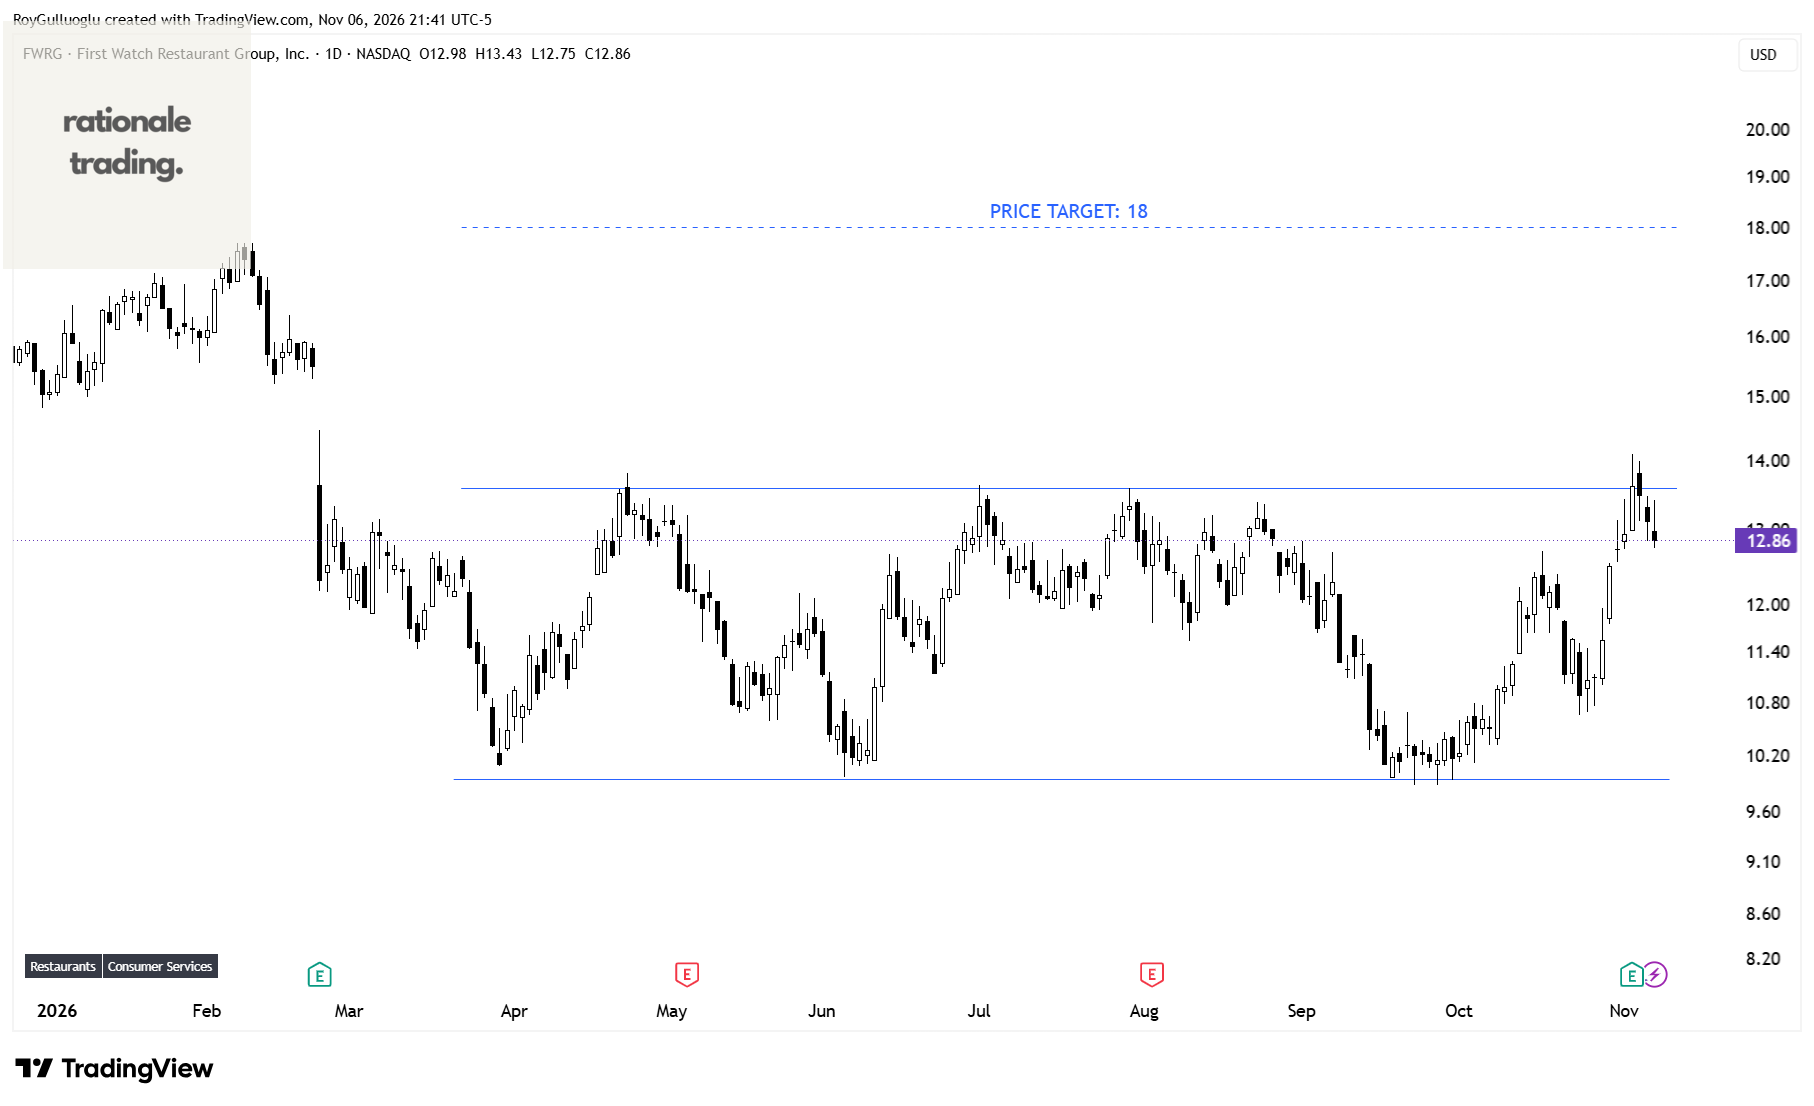
The above daily chart formed an approximately 5-month-long rectangle chart pattern as a bullish reversal after a downtrend.
Within this pattern, the horizontal boundary at 13.6 levels acts as a resistance.
A daily close above 14 levels would validate the breakout from the 5-month-long rectangle chart pattern.
Based on this chart pattern, the potential price target is 18 levels.