


Wayfair Inc.-(W/NYSE)-Long Idea
Wayfair Inc. engages in the e-commerce business in the United States and internationally.
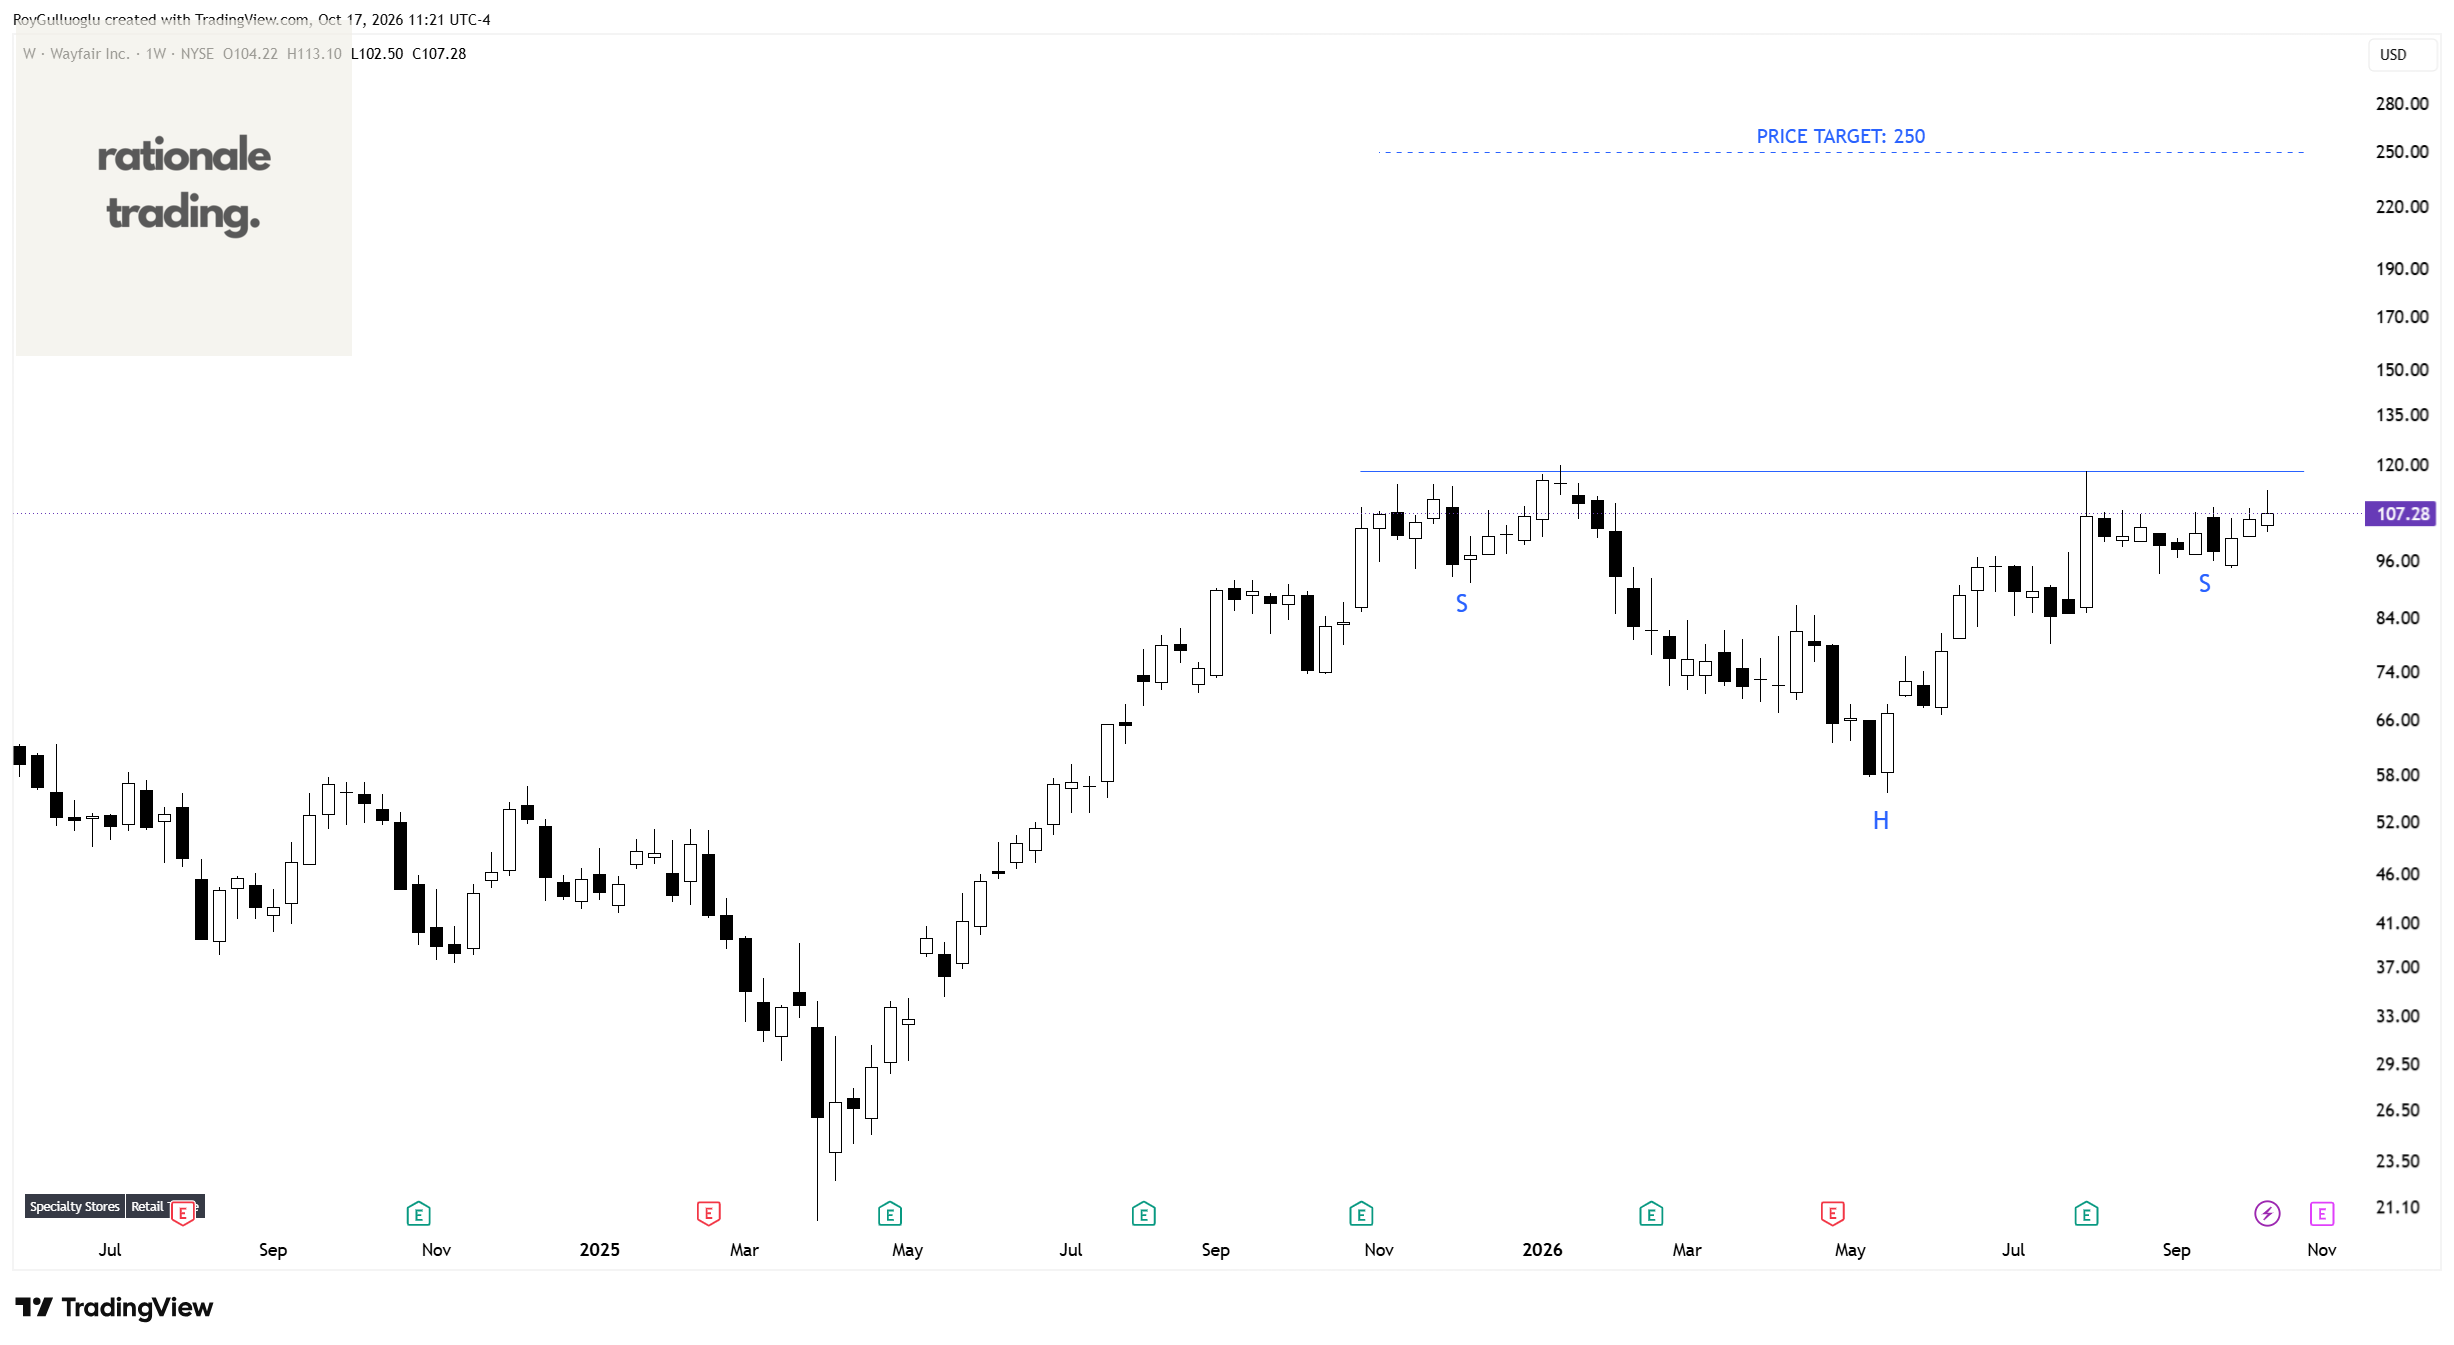
The above weekly chart formed an approximately 12-month-long H&S continuation chart pattern as a bullish continuation after a n uptrend.
Within this pattern, the horizontal boundary at 118.3 levels acts as a resistance.
A daily close above 121.8 levels would validate the breakout from the 12-month-long H&S continuation chart pattern.
Based on this chart pattern, the potential price target is 250 levels.
FactSet Research Systems Inc.-(FDS/NYSE)-Long Idea
FactSet Research Systems Inc., together with its subsidiaries, operates as a financial digital platform and enterprise solutions provider for the investment community.
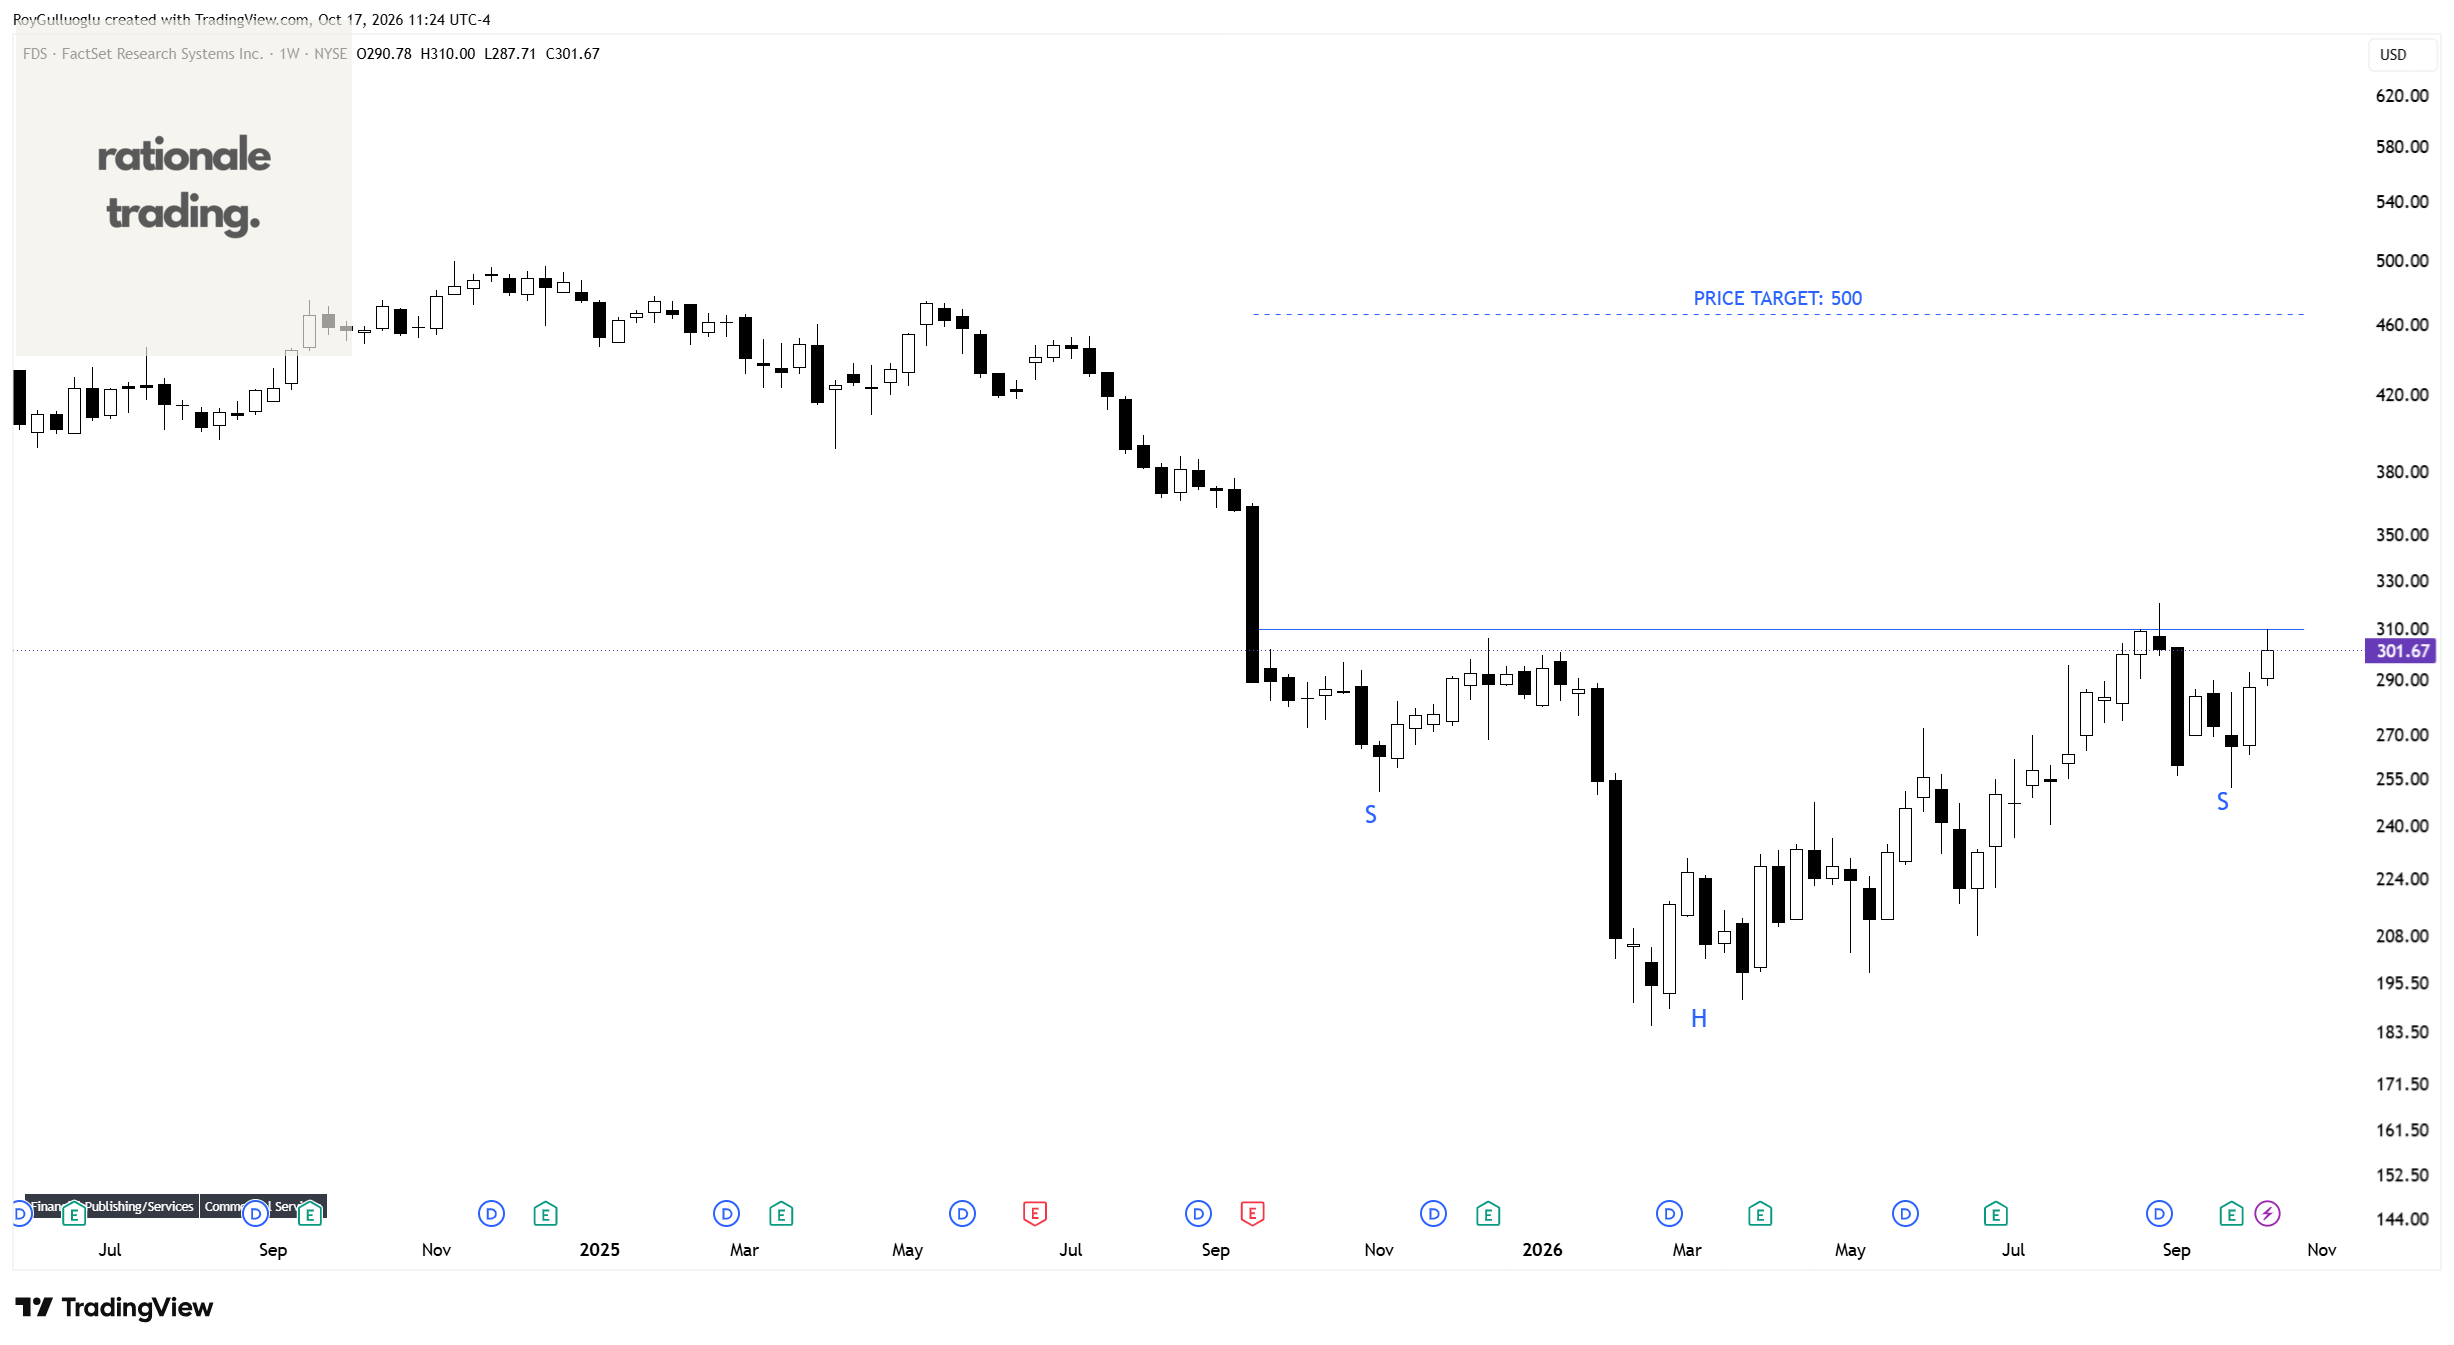
The above weekly chart formed an approximately 14-month-long H&S bottom chart pattern as a bullish reversal after a downtrend.
Within this pattern, the horizontal boundary at 310 levels acts as a resistance.
A daily close above 319.3 levels would validate the breakout from the 14-month-long H&S bottom chart pattern.
Based on this chart pattern, the potential price target is 500 levels.
Urban Outfitters, Inc.-(URBN/NASDAQ)-Long Idea
Urban Outfitters, Inc. offers lifestyle products and services in the United States and internationally.
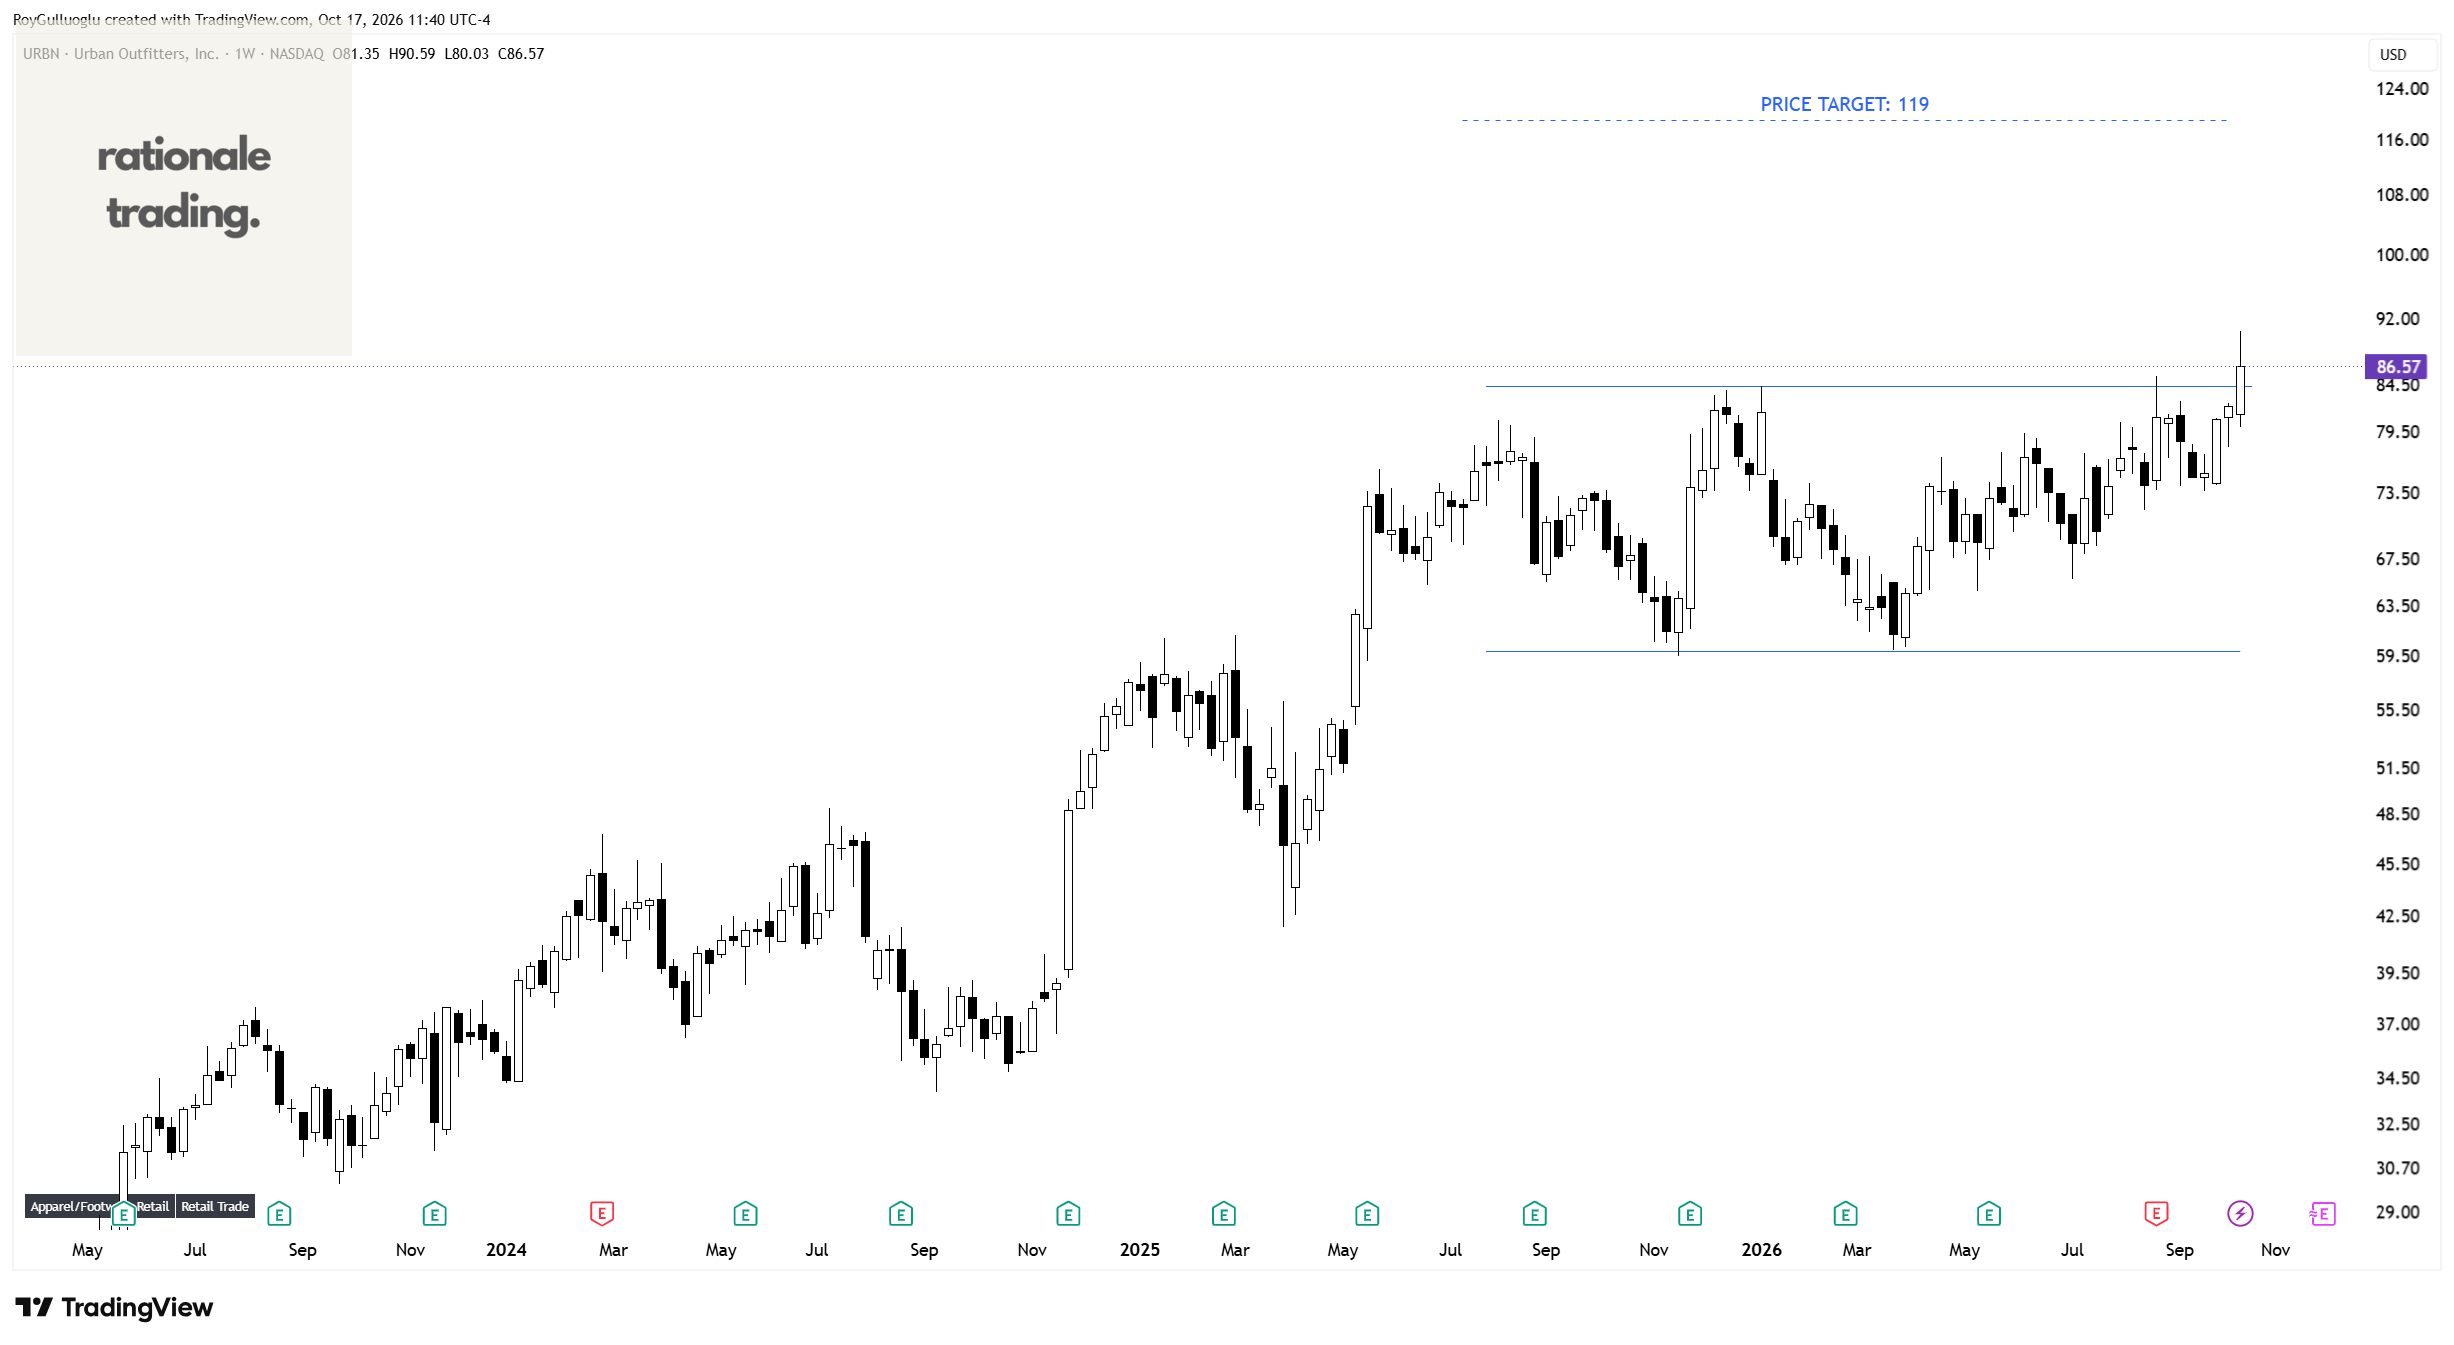
The above weekly chart formed an approximately 15-month-long rectangle chart pattern as a bullish continuation after an uptrend.
Within this pattern, the horizontal boundary at 84.35 levels acts as a resistance.
A daily close above 86.8 levels would validate the breakout from the 15-month-long rectangle chart pattern.
Based on this chart pattern, the potential price target is 119 levels.
Pacific Biosciences of California, Inc.-(PACB/NASDAQ)-Long Idea
Pacific Biosciences of California, Inc. designs, develops, and manufactures sequencing solutions to resolve genetically complex problems
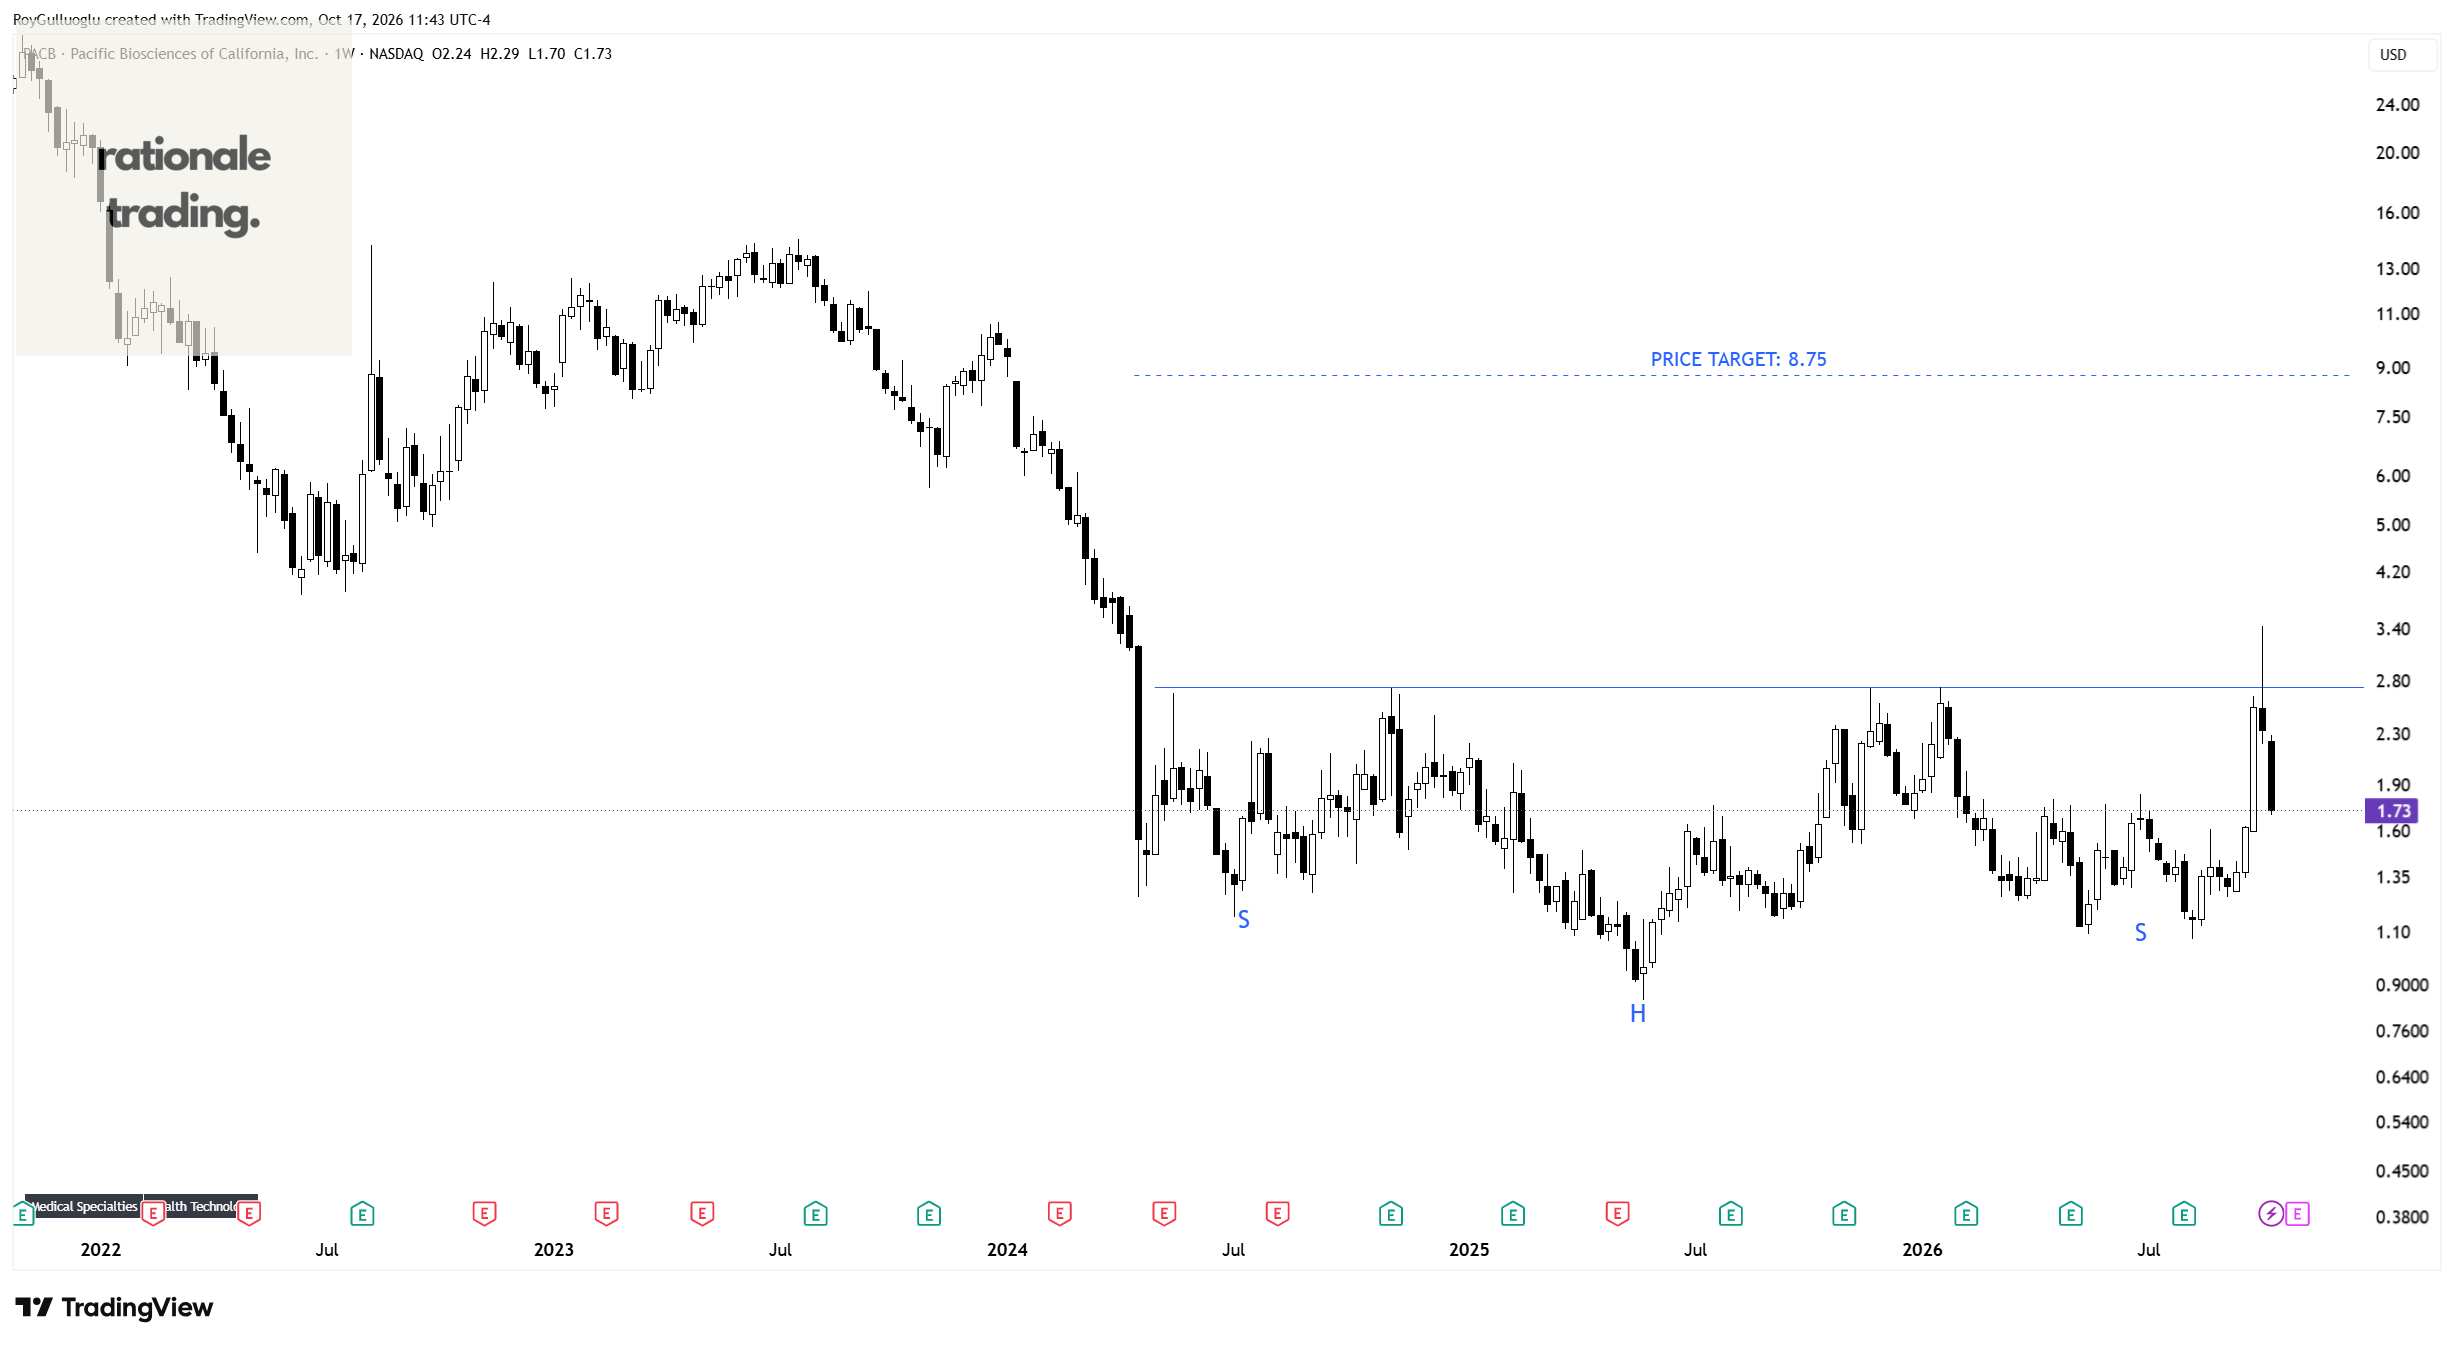
The above weekly chart formed an approximately 32-month-long H&S bottom chart pattern as a bullish reversal after a downtrend.
Within this pattern, the horizontal boundary at 2.73 levels acts as a resistance.
A daily close above 2.82 levels would validate the breakout from the 32-month-long H&S bottom chart pattern.
Based on this chart pattern, the potential price target is 8.75 levels.