


🎉 Happy New Year, RATIONALE Community! 🎉
As we step into the New Year, I want to express my deepest gratitude for being part of our growing community. Your presence and engagement have made RATIONALE truly special. Thank you for sharing, connecting, and being part of our community. Wishing you a year ahead filled with joy, growth, and prosperous trades.
Cheers to an exciting 2024!
With gratitude,
Roy
New setups
Textron Inc.-(TXT/NYSE) - Long Idea
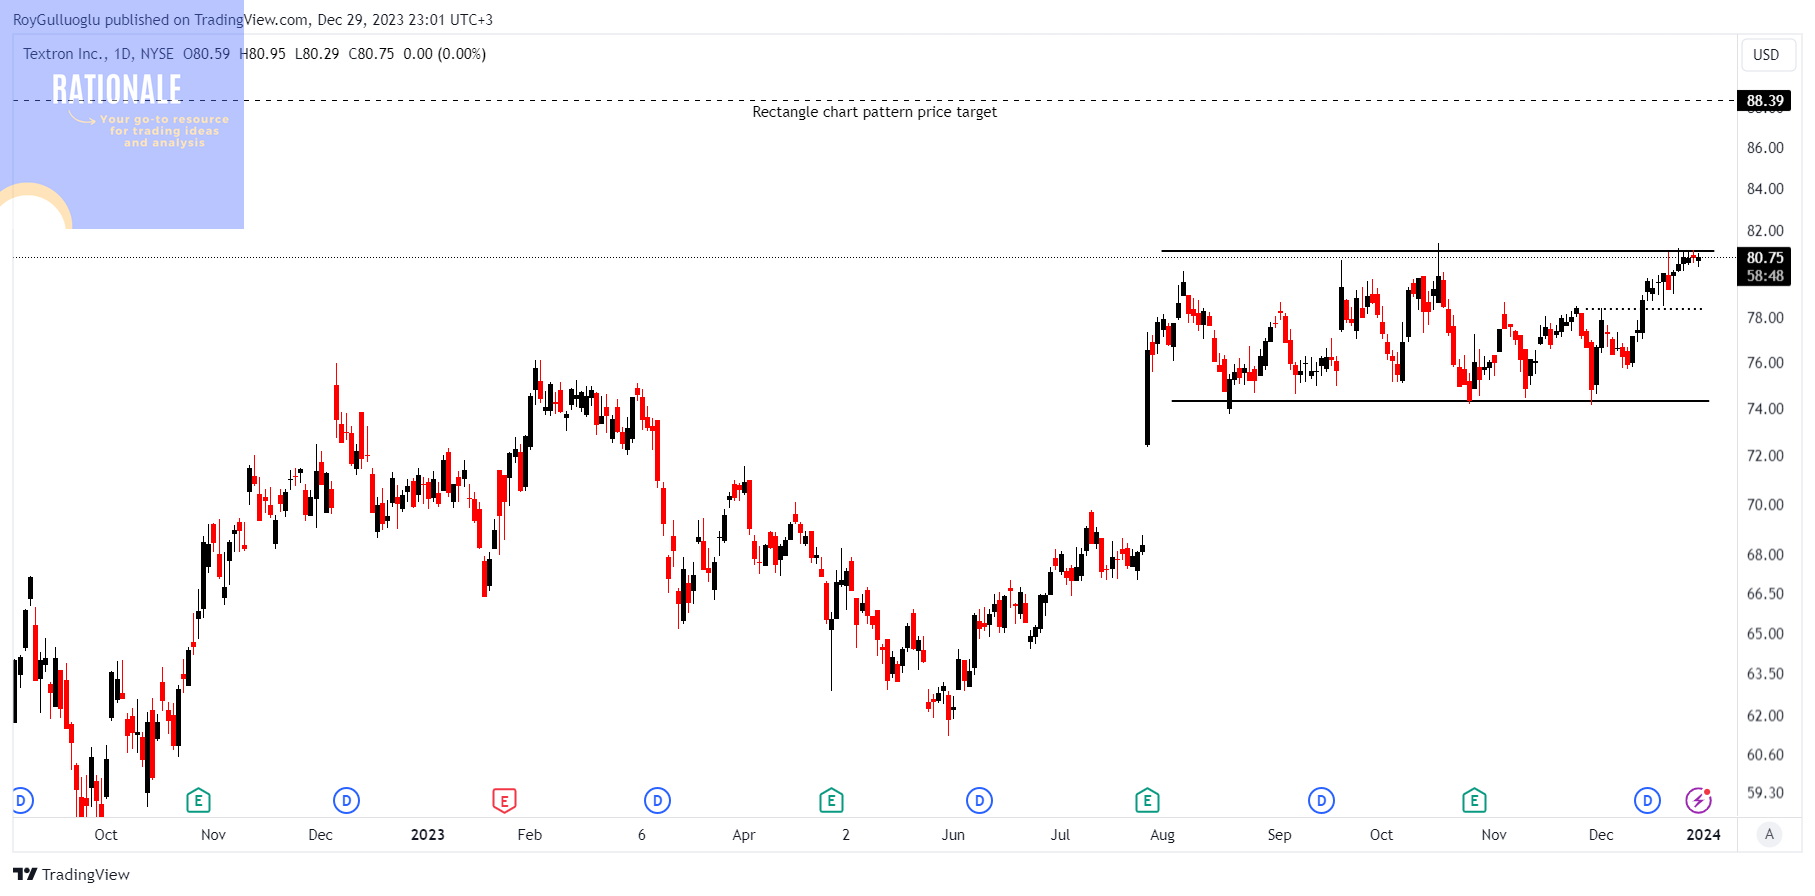
Textron Inc. is a multi-industry company involved in aerospace and defense, manufacturing military and commercial aircraft, including helicopters under the Bell brand. The company also produces industrial products such as specialized vehicles and equipment, including golf carts and off-road vehicles.
The above daily chart formed an approximately 3-month-long rectangle chart pattern as a bullish continuation after an uptrend.
Within this pattern, the horizontal boundary at 81 levels acts as a resistance.
A daily close above 83.43 levels would validate the breakout from the 3-month-long rectangle chart pattern.
Based on this chart pattern, the potential price target is 88.39 levels.
TXT, classified under the "industrials" sector, falls under the “Large Cap - Value” stock category.
Multiple quarters of EPS, and revenue acceleration YoY in Quarterly Earnings is another strength of the stock.
MSCI Inc.-(MSCI/NYSE) - Long Idea
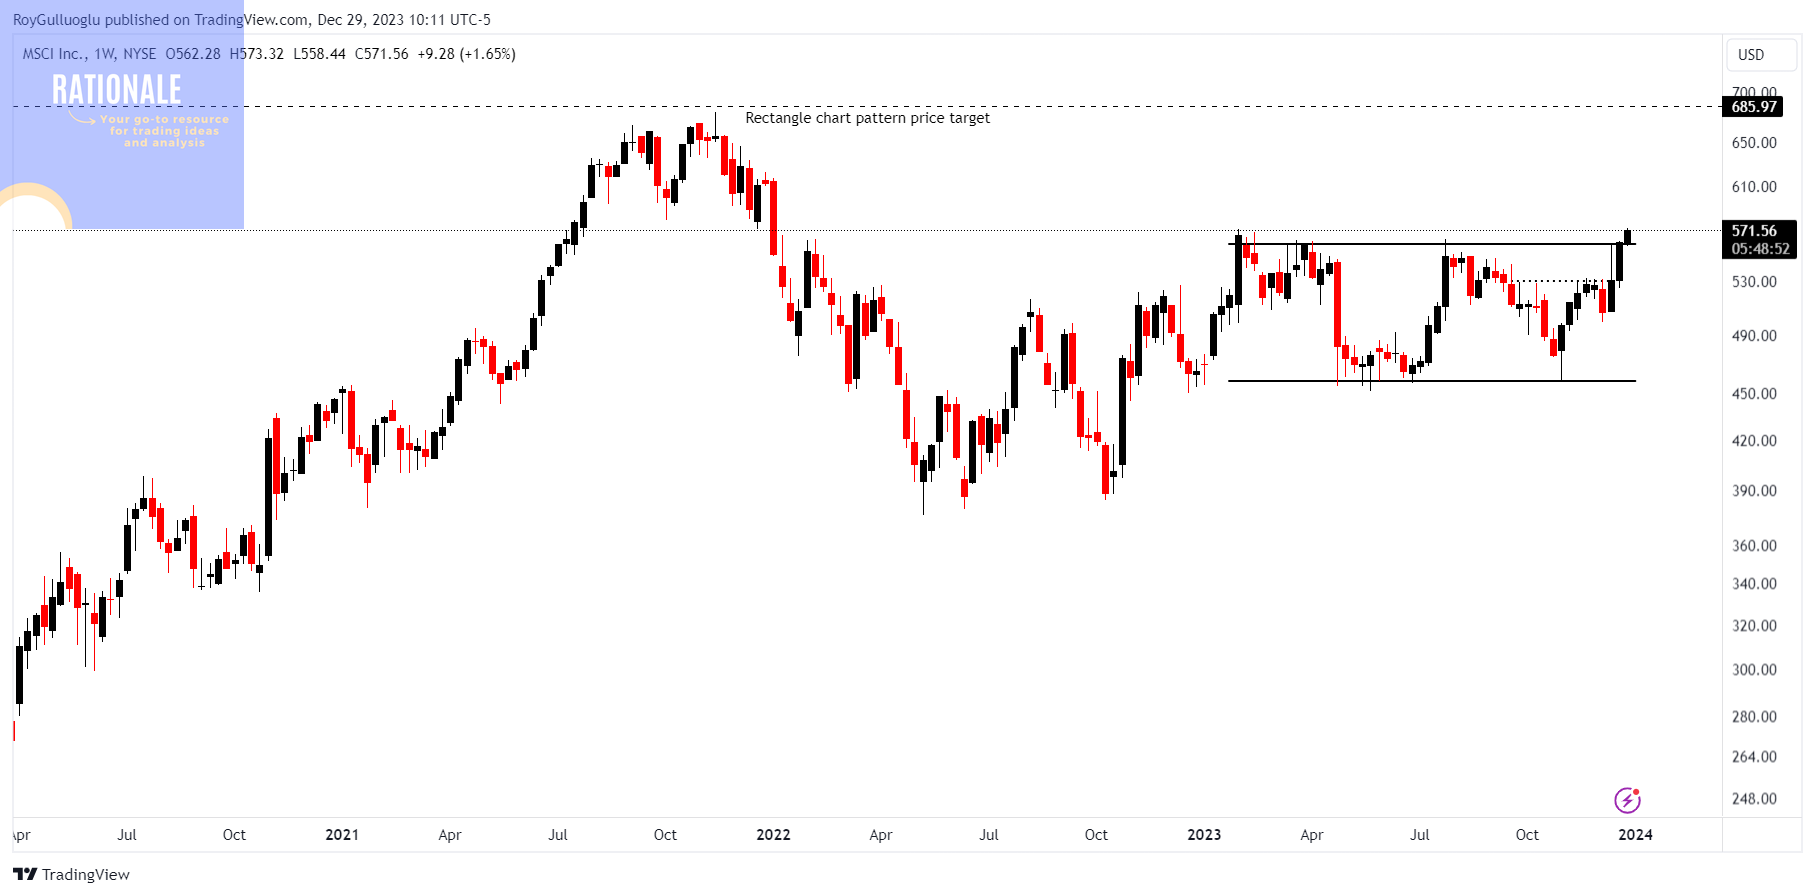
MSCI Inc. is an independent provider of research-driven insights and tools for institutional investors. It offers content, applications, and services to support the needs of institutional investors throughout their investment processes.
The above weekly chart formed an approximately 11-month-long rectangle chart pattern as a bullish continuation after an uptrend.
Within this pattern, the horizontal boundary at 560 levels acts as a resistance.
A daily close above 576.8 levels would validate the breakout from the 11-month-long rectangle chart pattern.
Based on this chart pattern, the potential price target is 685 levels.
MSCI, classified under the "financial services" sector, falls under the “Large Cap - Income” stock category.
Multiple quarters of EPS, and revenue acceleration YoY in Quarterly Earnings is another strength of the stock.
Alphabet Inc.-(GOOGL/NASDAQ)-Long Idea
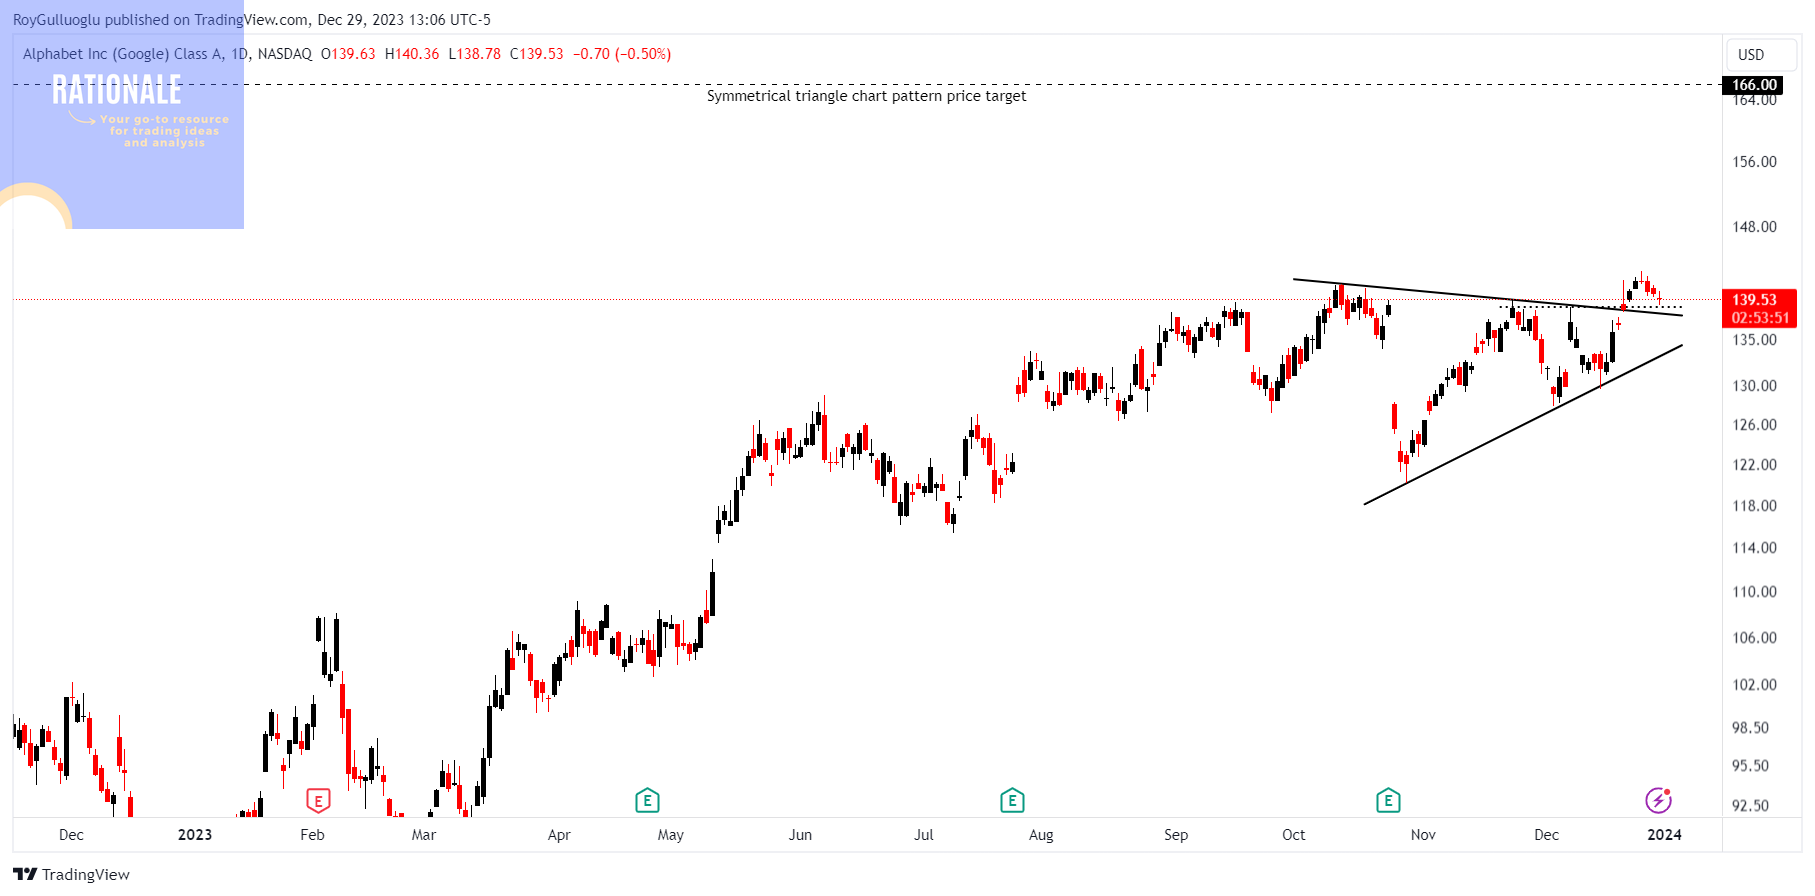
Google is a multinational technology company that specializes in internet-related products and services.
The above daily chart formed an approximately 2-month-long symmetrical triangle chart pattern as a bullish continuation after an uptrend.
Within this pattern, the boundary at 138.5 levels acts as a resistance.
A daily close above 142.6 levels would validate the breakout from the 2-month-long symmetrical triangle chart pattern.
Based on this chart pattern, the potential price target is 166 levels.
GOOGL, classified under the "communications" sector, falls under the “Large Cap - Growth” stock category.
Multiple quarters of EPS, and revenue acceleration YoY in Quarterly Earnings is another strength of the stock.
Camtek Ltd.-(CAMT/NASDAQ)-Long Idea
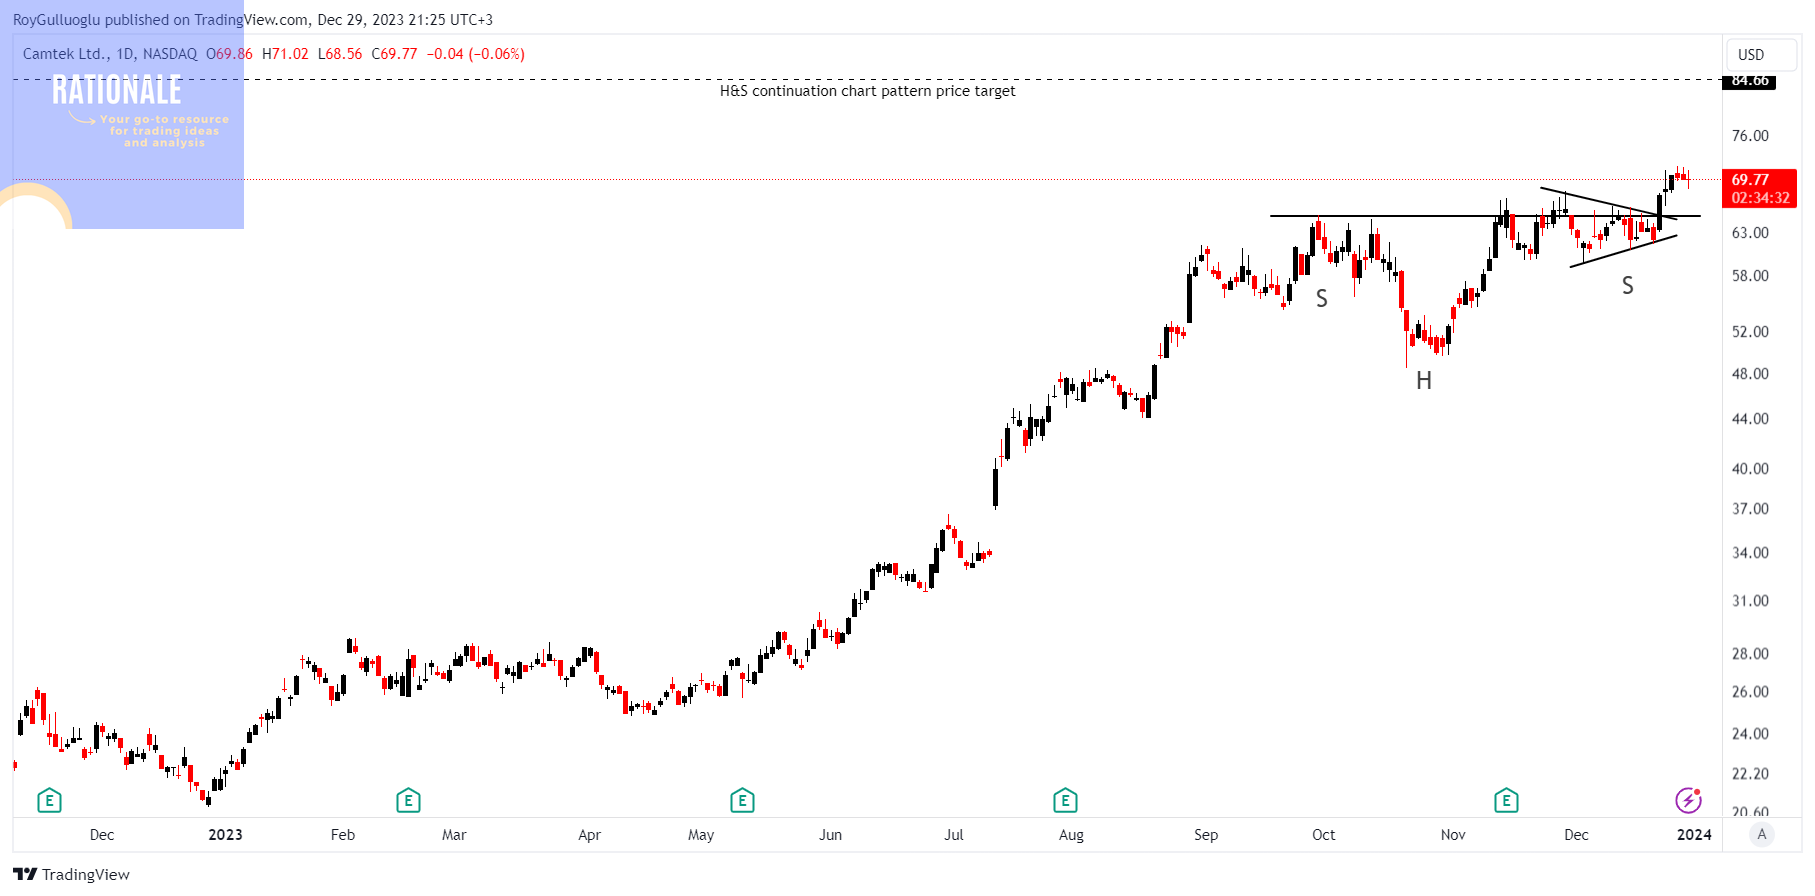
The company provides advanced solutions for the inspection of wafers during the semiconductor manufacturing process.
The above daily chart formed an approximately 2-month-long H&S continuation chart pattern as a bullish continuation after an uptrend.
Within this pattern, the horizontal boundary at 65 levels acted as a resistance.
A daily close above 67 levels validated the breakout from the 2-month-long H&S continuation chart pattern.
Based on this chart pattern, the potential price target is 84.66 levels.
CAMT, classified under the "technology" sector, falls under the “Mid Cap - Growth” stock category.
Emerson Electric Company-(EMR/NYSE)-Long Idea
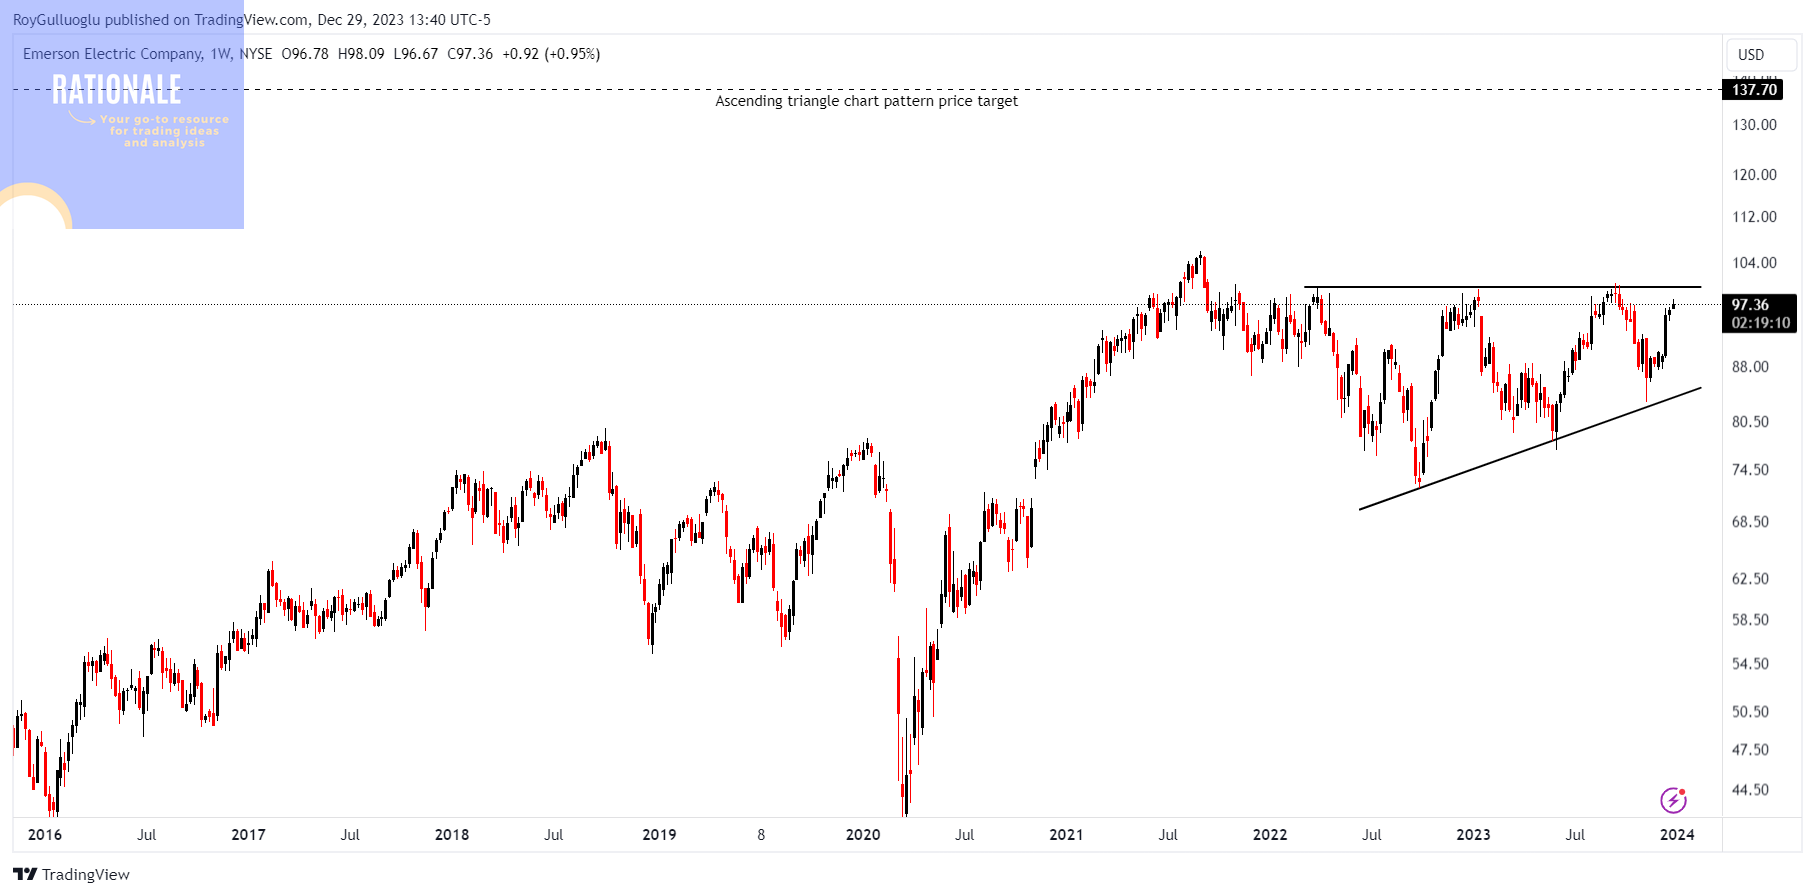
Emerson Electric Co. is a multinational conglomerate that operates in various industries, primarily focusing on technology and engineering solutions.
The above weekly chart formed an approximately 20-month-long ascending triangle chart pattern.
Within this pattern, the horizontal boundary at 100 levels acts as a resistance.
A daily close above 103 levels would validate the breakout from the 20-month-long ascending triangle chart pattern.
Based on this chart pattern, the potential price target is 137.7 levels.
EMR, classified under the "industrials" sector, falls under the “Large Cap - Value” stock category.
Nucor Corporation-(NUE/NYSE)-Long Idea
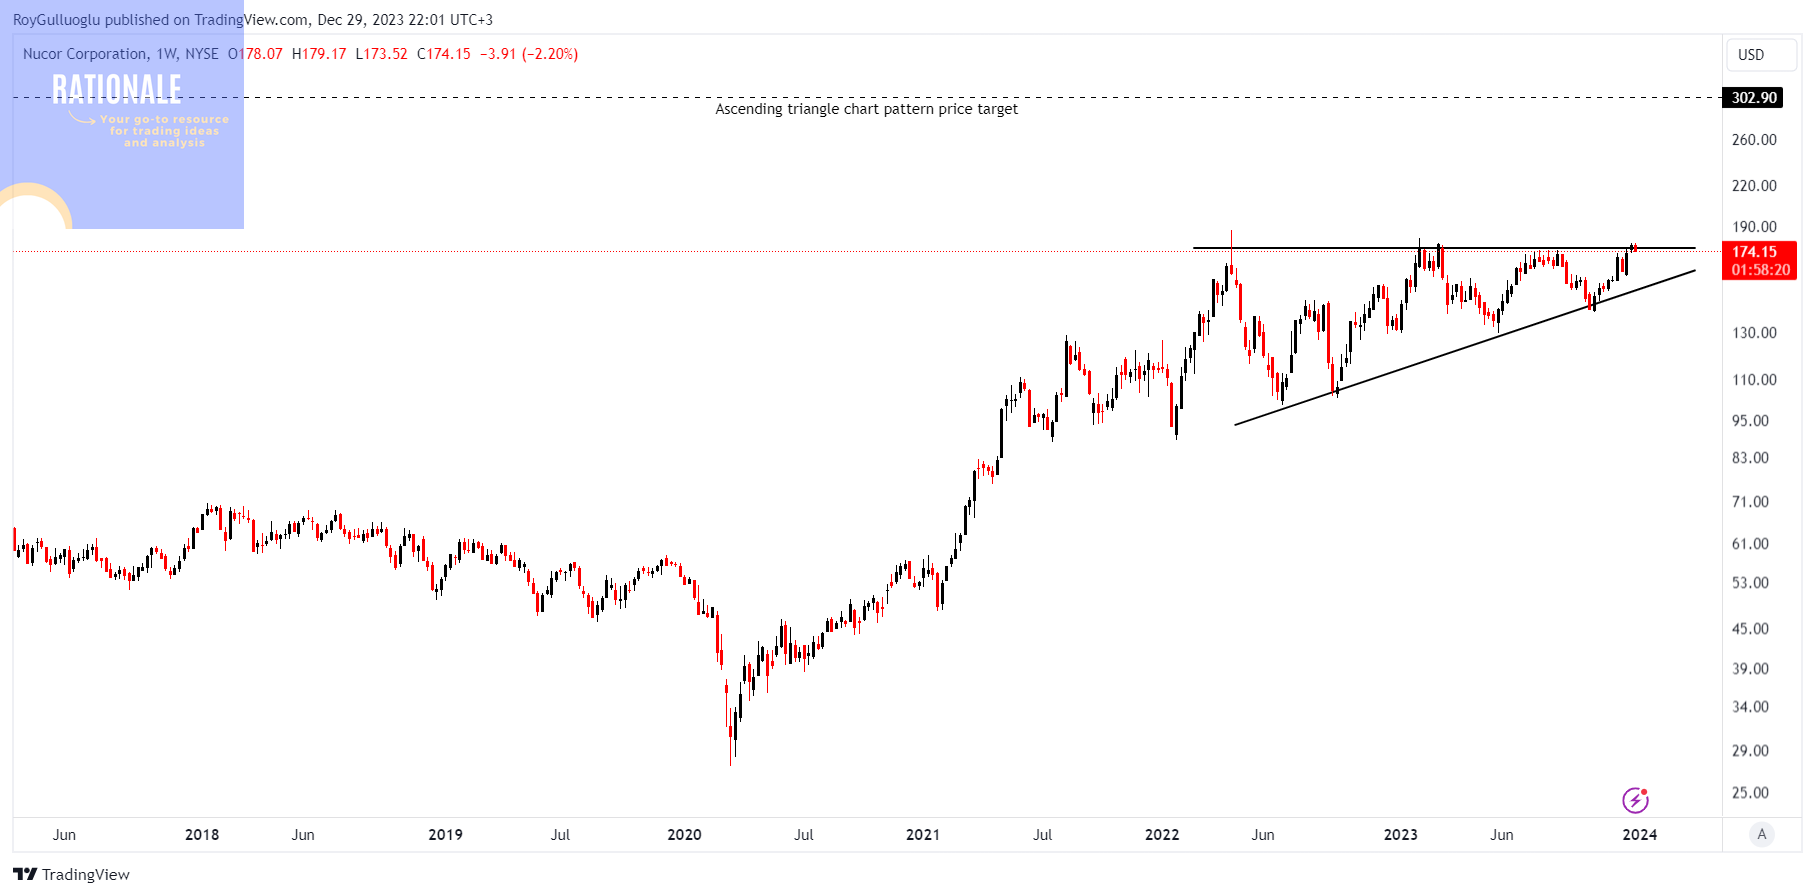
Nucor Corporation is one of the largest steel producers in the United States and a leading manufacturer of steel and steel products.
The above weekly chart formed an approximately 21-month-long ascending triangle chart pattern.
Within this pattern, the horizontal boundary at 174.06 levels acts as a resistance.
A daily close above 179.28 levels would validate the breakout from the 21-month-long ascending triangle chart pattern.
Based on this chart pattern, the potential price target is 302.9 levels.
NUE, classified under the "basic materials" sector, falls under the “Large Cap - Value” stock category.
Hartford Financials Services Group, Inc.-(HIG/NYSE)-Long Idea
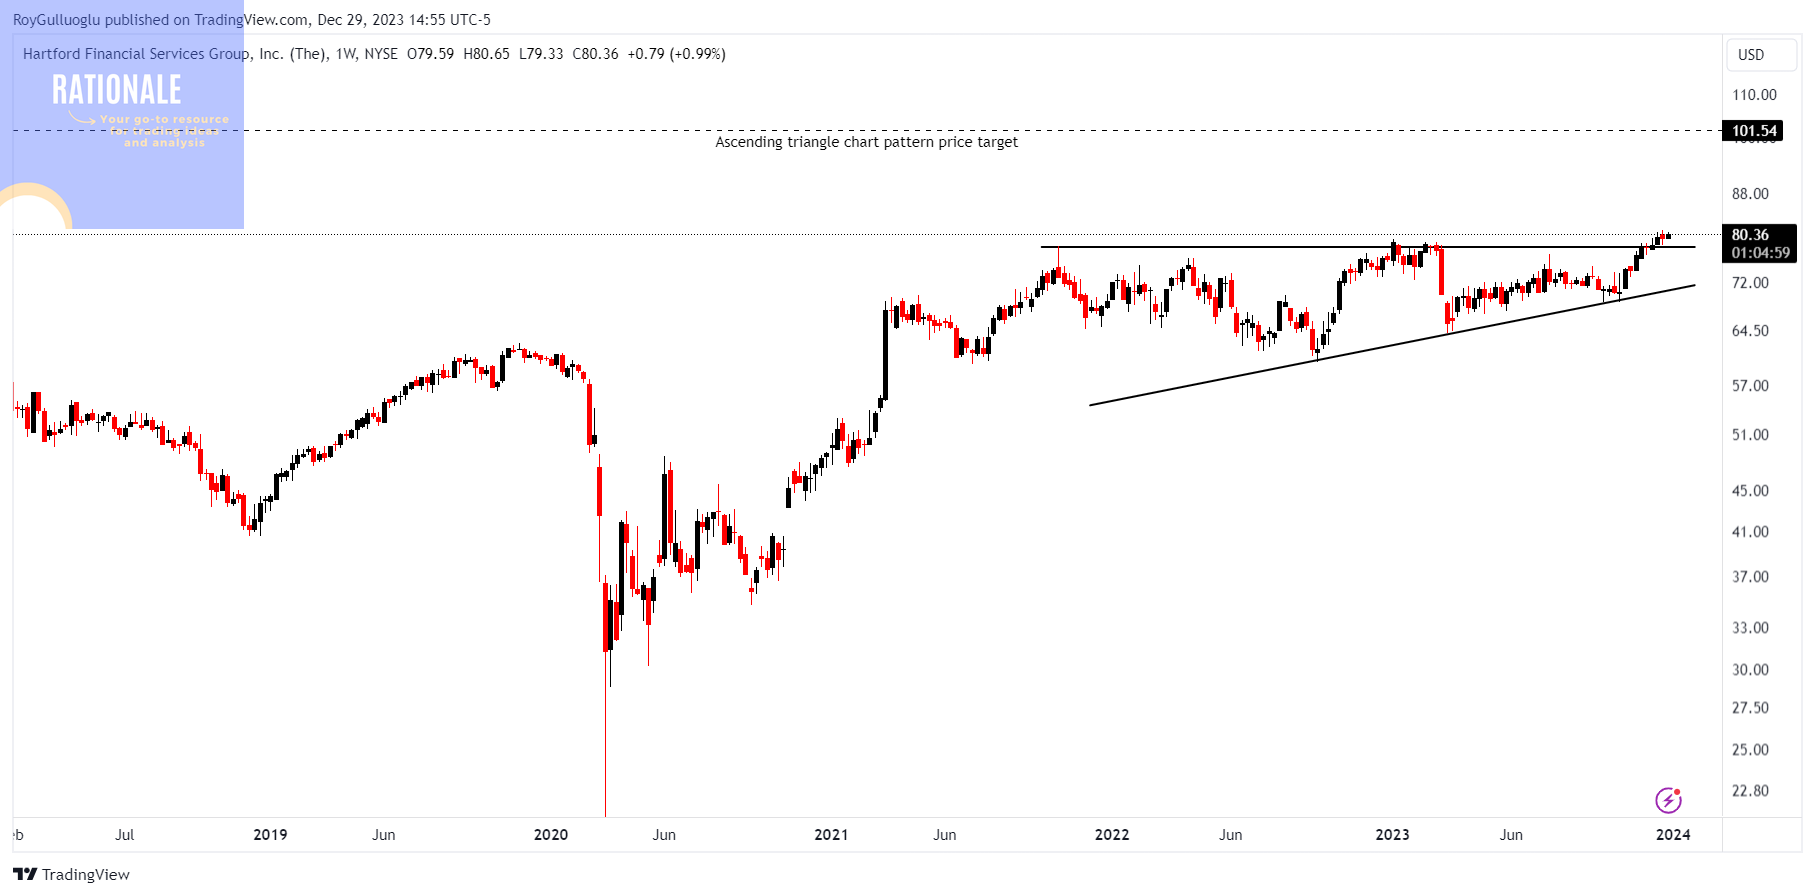
Hartford Financial Services Group Inc. is an insurance and financial services company. It operates through Commercial Lines, Personal Lines, Group Benefits, Mutual Funds, and Talcott Resolution segments.
The above weekly chart formed an approximately 25-month-long ascending triangle chart pattern.
Within this pattern, the horizontal boundary at 78 levels acts as a resistance.
A daily close above 80.3 levels would validate the breakout from the 21-month-long ascending triangle chart pattern.
Based on this chart pattern, the potential price target is 101.5 levels.
HIG, classified under the "financial services" sector, falls under the “Large Cap - Income” stock category.
Follow-ups
Aeon Hokkaido Corp-(7512/TSE)-Long/Short Idea
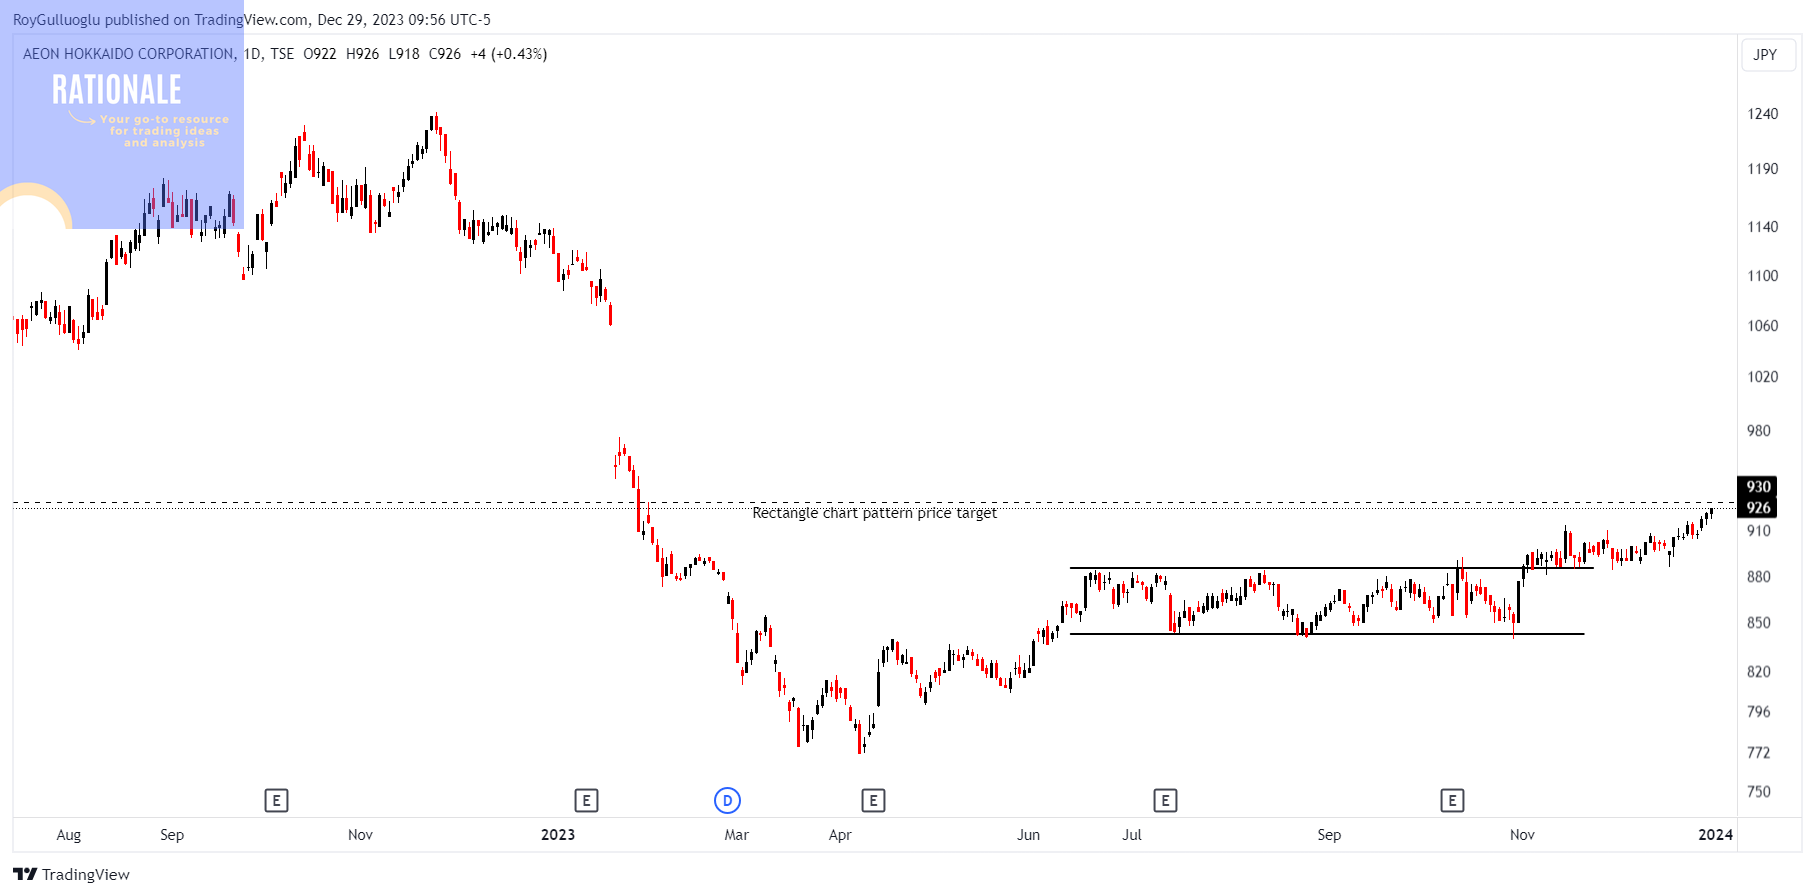
You can click the 7512 ticker above to access the first report explaining the RATIONALE behind the trade idea.
The rectangle chart pattern price target is almost reached.
Waste Management, Inc-(WM/NYSE)-Long Idea
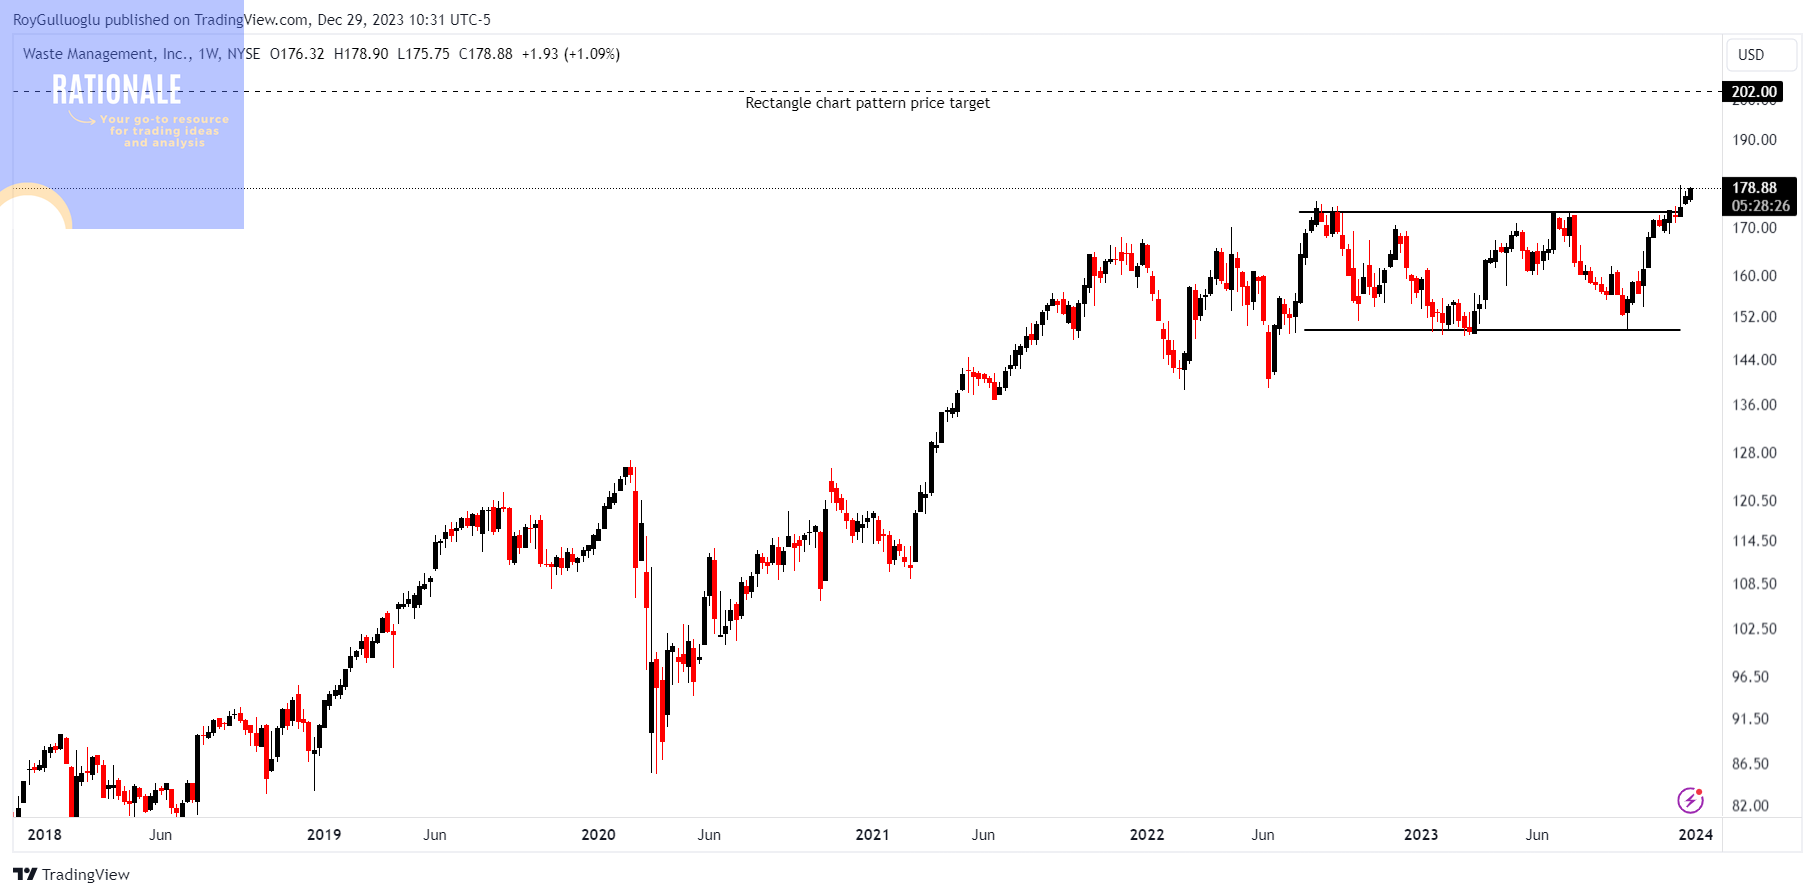
You can click the WM ticker above to access the first report explaining the RATIONALE behind the trade idea.
Wyndham Hotels & Resorts-(WH/NYSE)-Long Idea
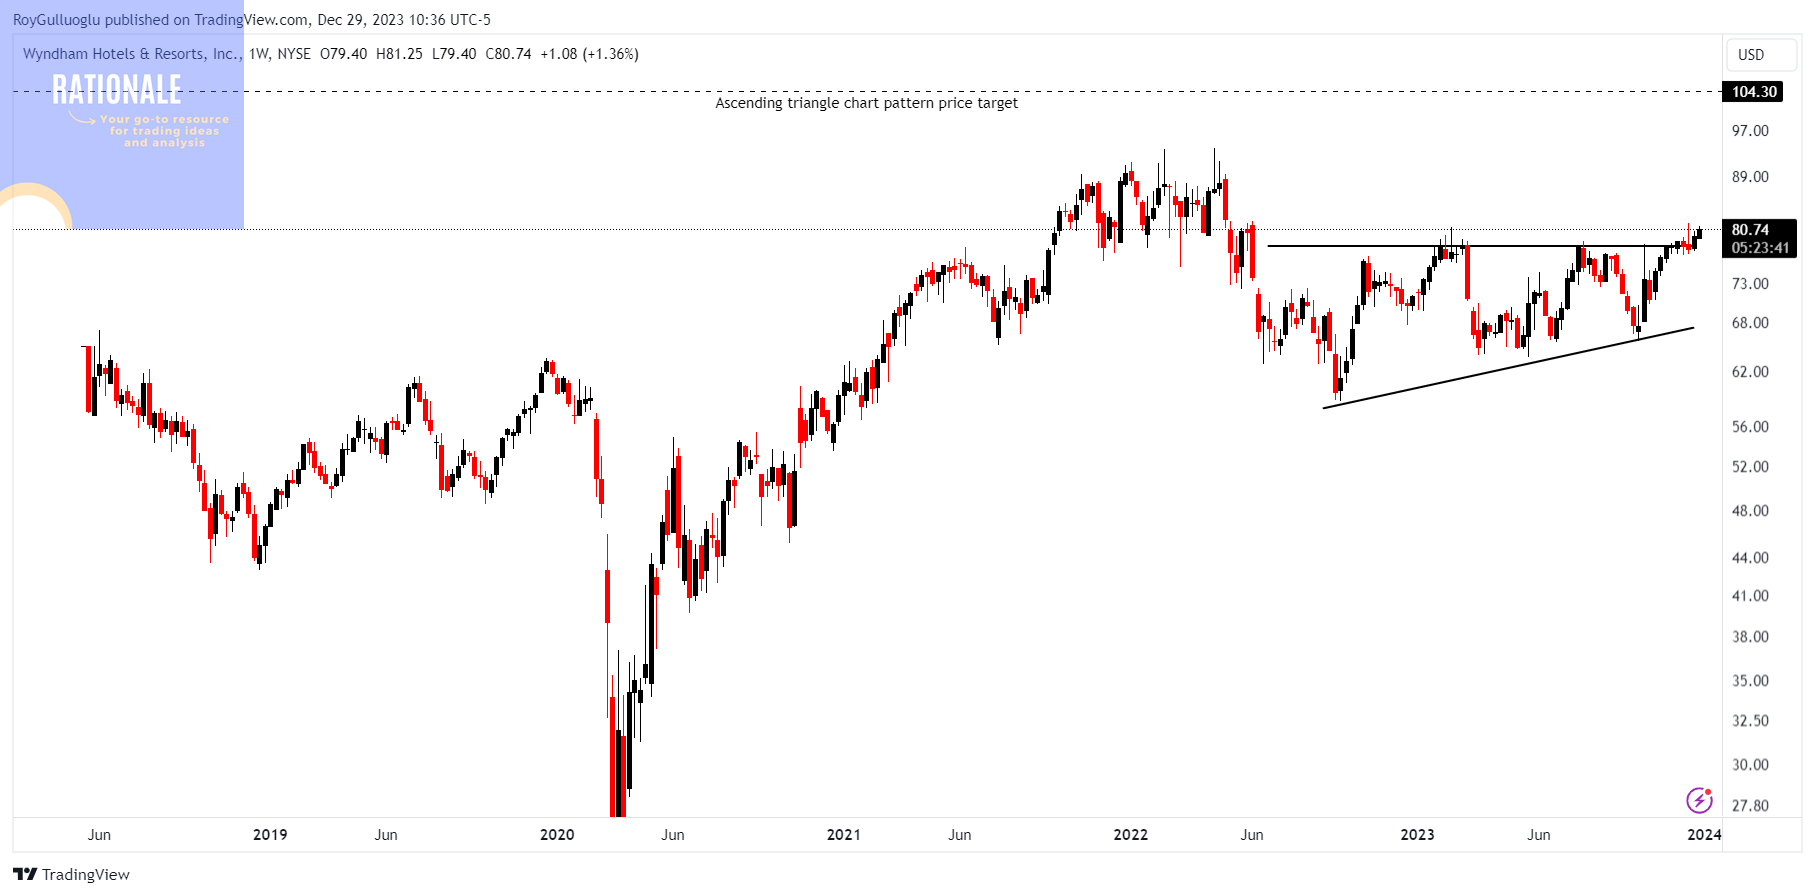
You can click the WH ticker above to access the first report explaining the RATIONALE behind the trade idea.
General Dynamics Corporation-(GD/NYSE)-Long Idea
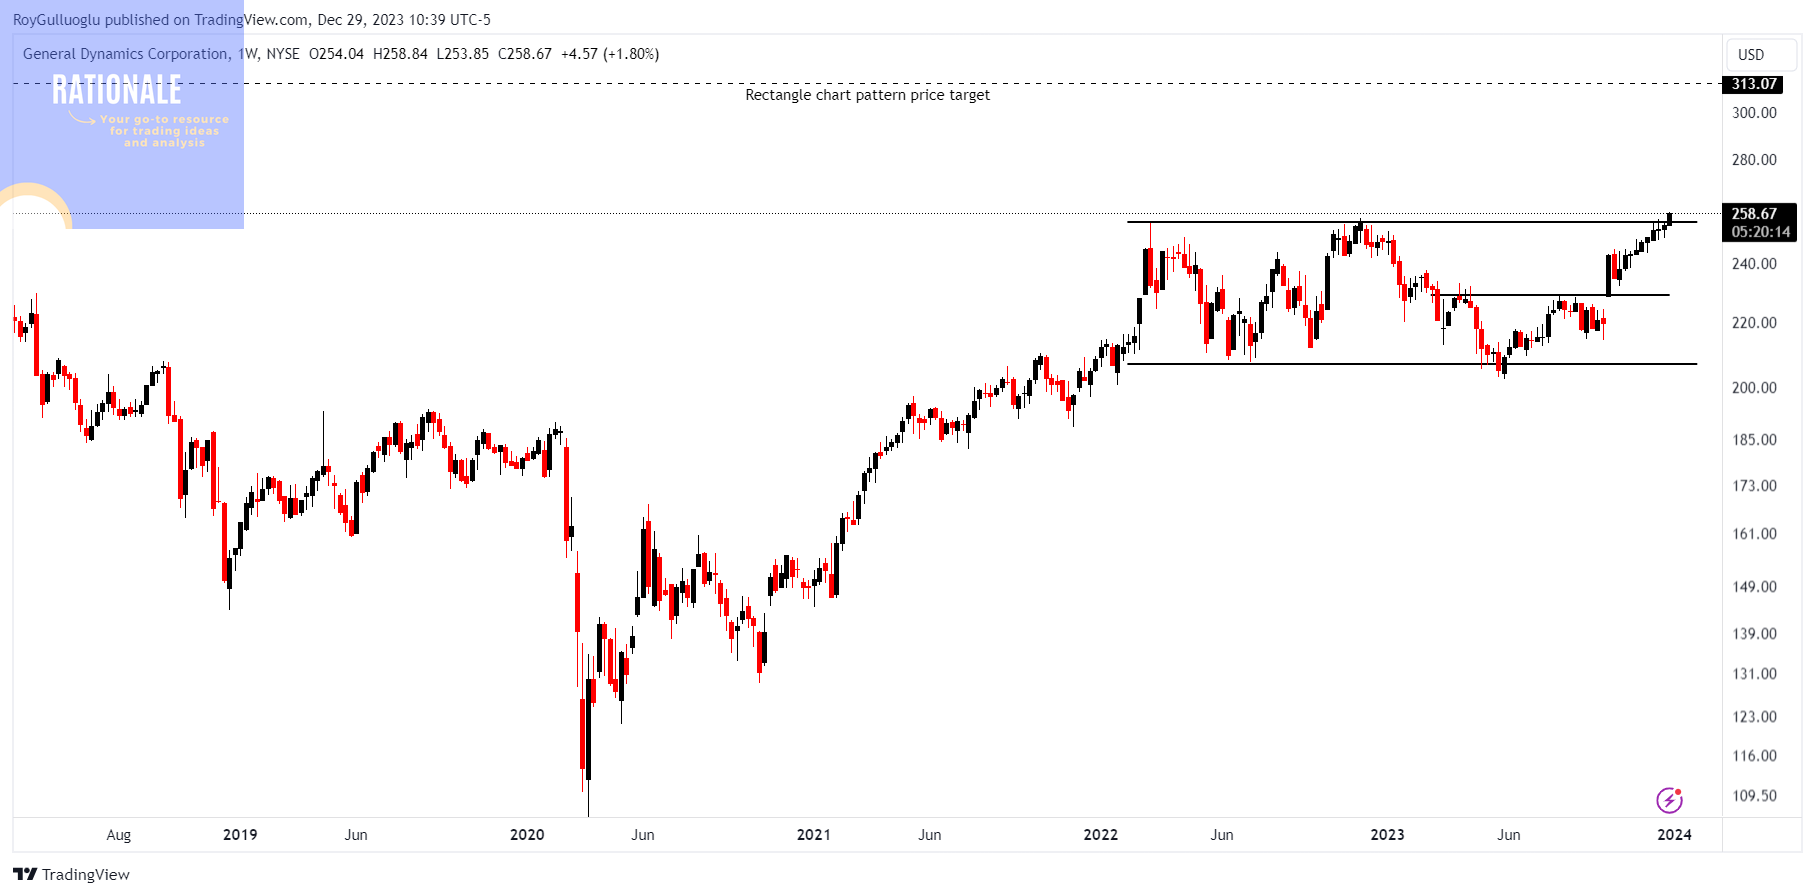
You can click the GD ticker above to access the first report explaining the RATIONALE behind the trade idea.
Warner Music Group Corp.-(WMG/NYSE)-Long Idea
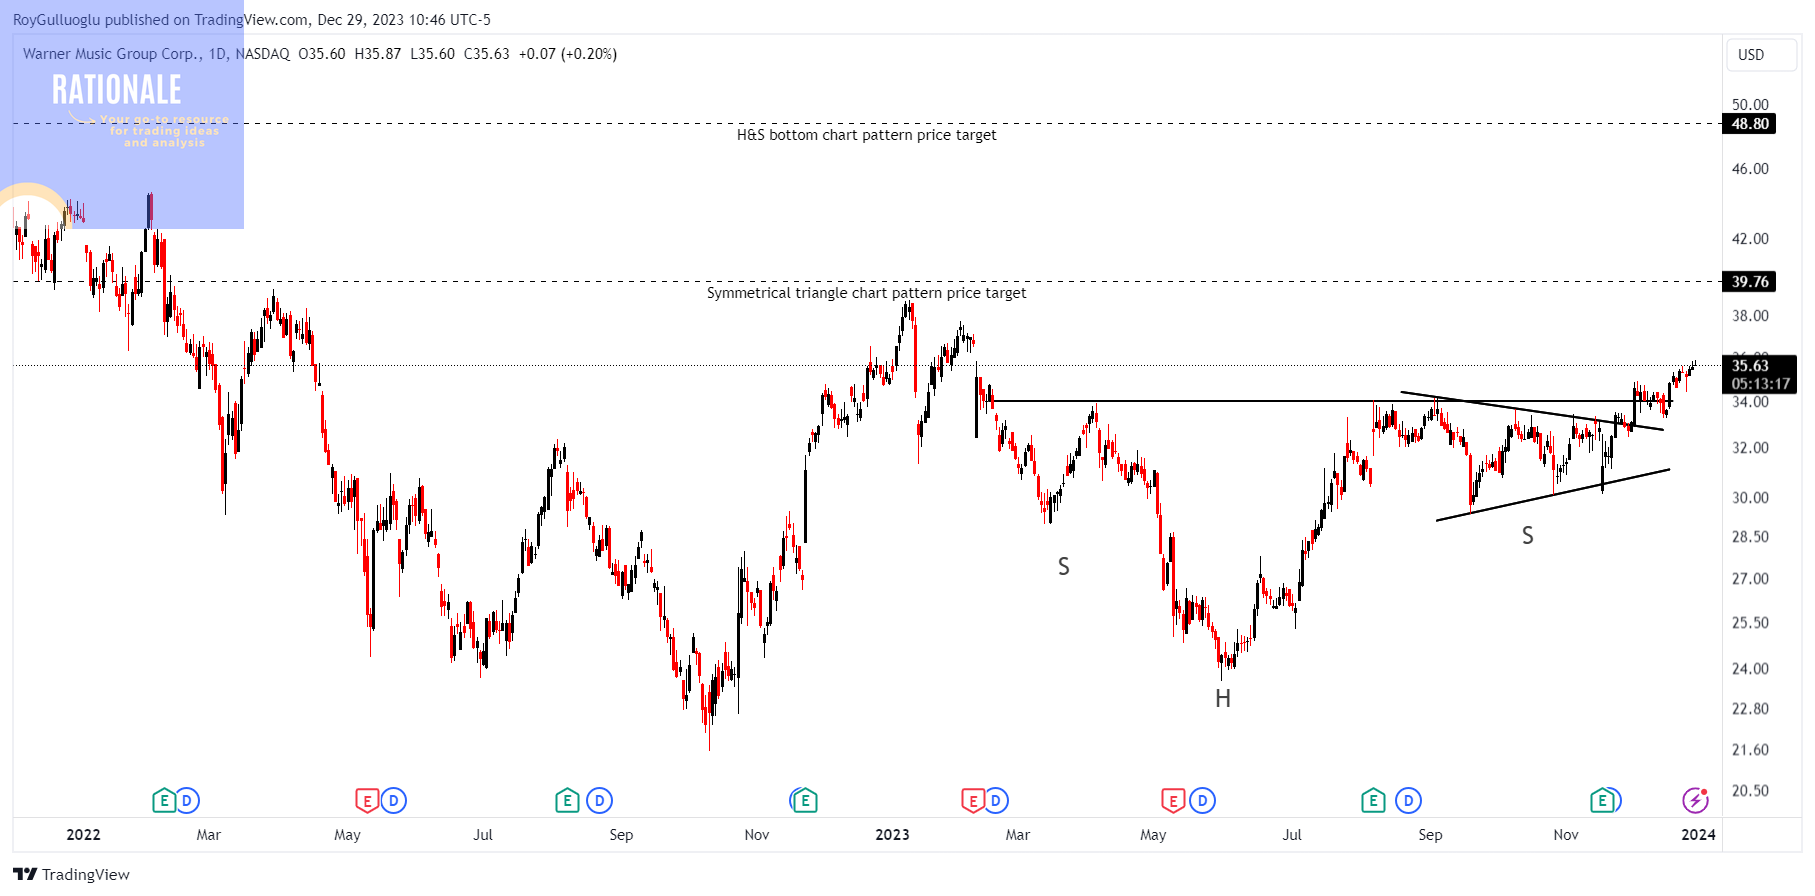
You can click the WMG ticker above to access the first report explaining the RATIONALE behind the trade idea.