


New setups
TICKERS: EDR(NYSE), UGI(NYSE), OI(NYSE), HALO(NASDAQ) 002353(SZSE), AMUN(EURONEXT)
Endeavor Group Holdings, Inc.-(EDR/NYSE)-Long Idea
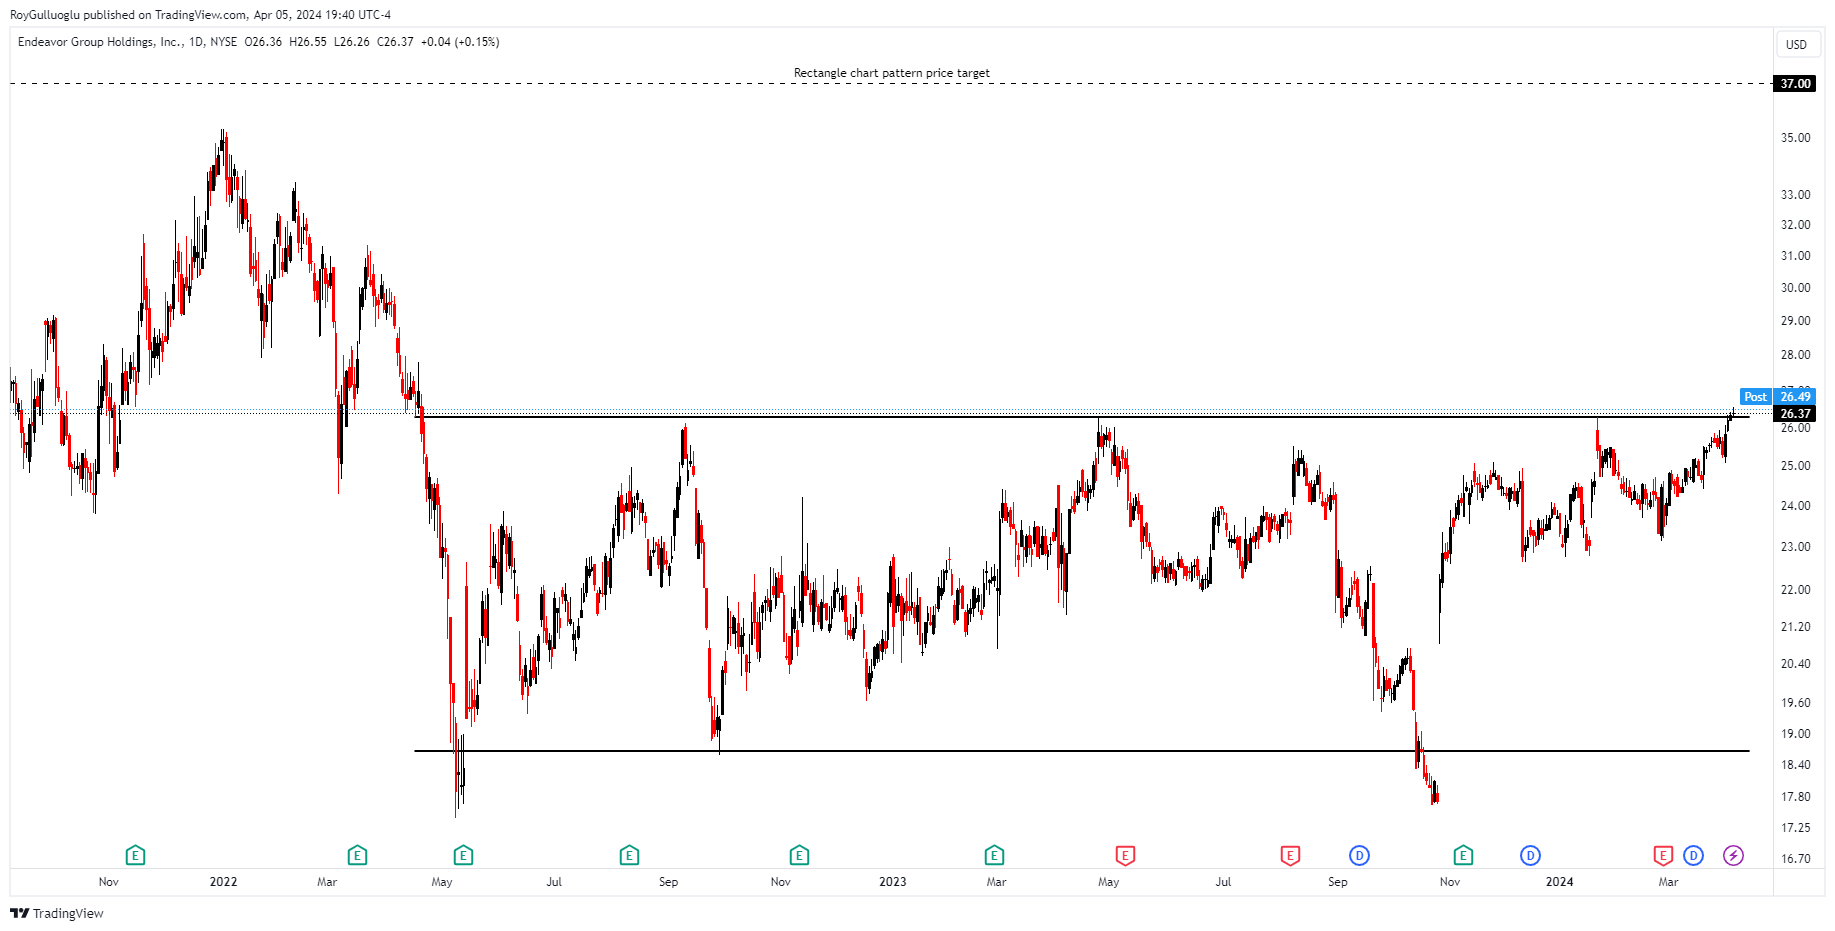
Endeavor Group Holdings, Inc. functions as a sports and entertainment enterprise spanning the United States, the United Kingdom, and global markets. The company is structured into four main segments: Owned Sports Properties, Events, Experiences & Rights, Representation, and Sports Data & Technology.
The above daily chart formed an approximately 39-month-long rectangle chart pattern as a bullish reversal after a downtrend.
The horizontal boundary at 26.28 levels acts as a resistance within this pattern.
A daily close above 27 levels would validate the breakout from the 39-month-long rectangle chart pattern.
Based on this chart pattern, the potential price target is 37 levels.
EDR, classified under the "communication services" sector, falls under the “Mid Cap - Growth” stock category.
UGI Corporation-(UGI/NYSE)-Long Idea
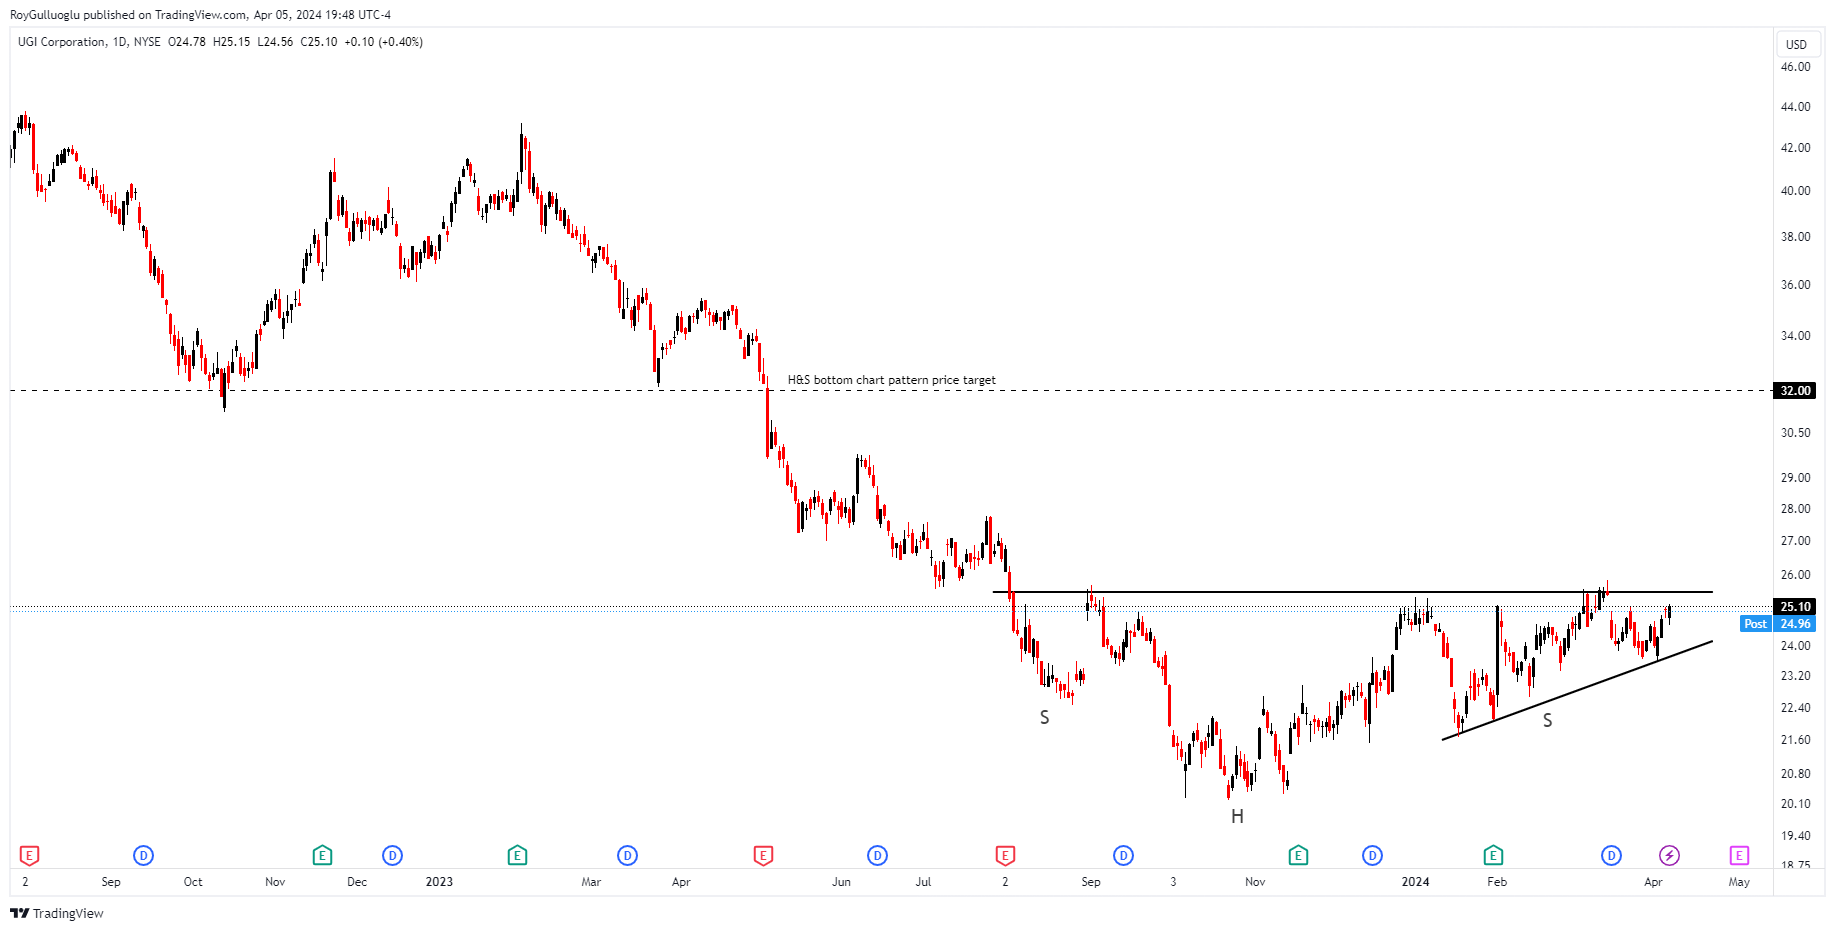
UGI Corporation, along with its subsidiary companies, engages in the distribution, storage, transportation, and marketing of energy products and associated services both domestically in the United States and internationally.
The above daily chart formed an approximately 5-month-long H&S bottom chart pattern as a bullish reversal after a downtrend.
The horizontal boundary at 25.5 levels acts as a resistance within this pattern.
A daily close above 26.26 levels would validate the breakout from the 5-month-long H&S bottom chart pattern.
Based on this chart pattern, the potential price target is 32 levels.
UGI, classified under the "utilities" sector, falls under the “Mid Cap - Income” stock category.
O-I Glass, Inc.-(OI/NYSE)-Long Idea
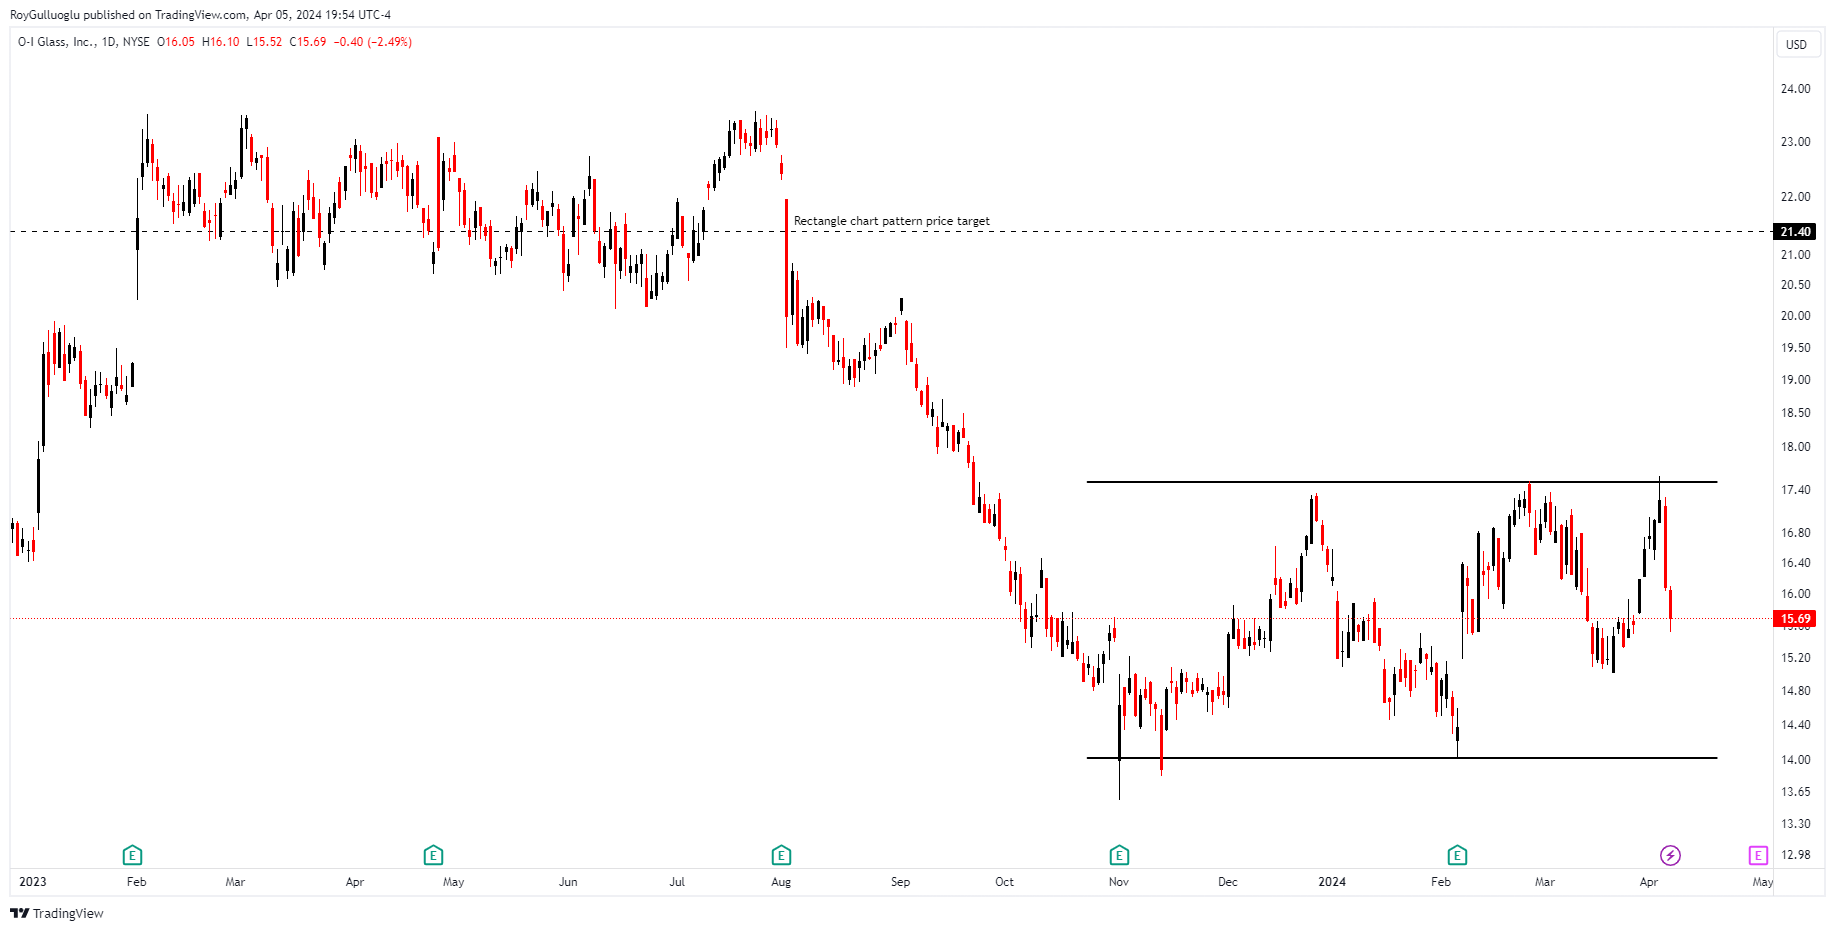
O-I Glass, Inc., operating via its subsidiary entities, specializes in manufacturing and selling glass containers to food and beverage manufacturers, with a primary focus on markets in the Americas, Europe, and around the globe.
The above daily chart formed an approximately 3-month-long rectangle chart pattern as a bullish reversal after a downtrend.
The horizontal boundary at 17.5 levels acts as a resistance within this pattern.
A daily close above 18 levels would validate the breakout from the 3-month-long rectangle chart pattern.
Based on this chart pattern, the potential price target is 21.4 levels.
OI, classified under the "consumer cyclical" sector, falls under the “Mid Cap - Growth” stock category.
Halozyme Therapeutics, Inc-(HALO/NASDAQ)-Long Idea
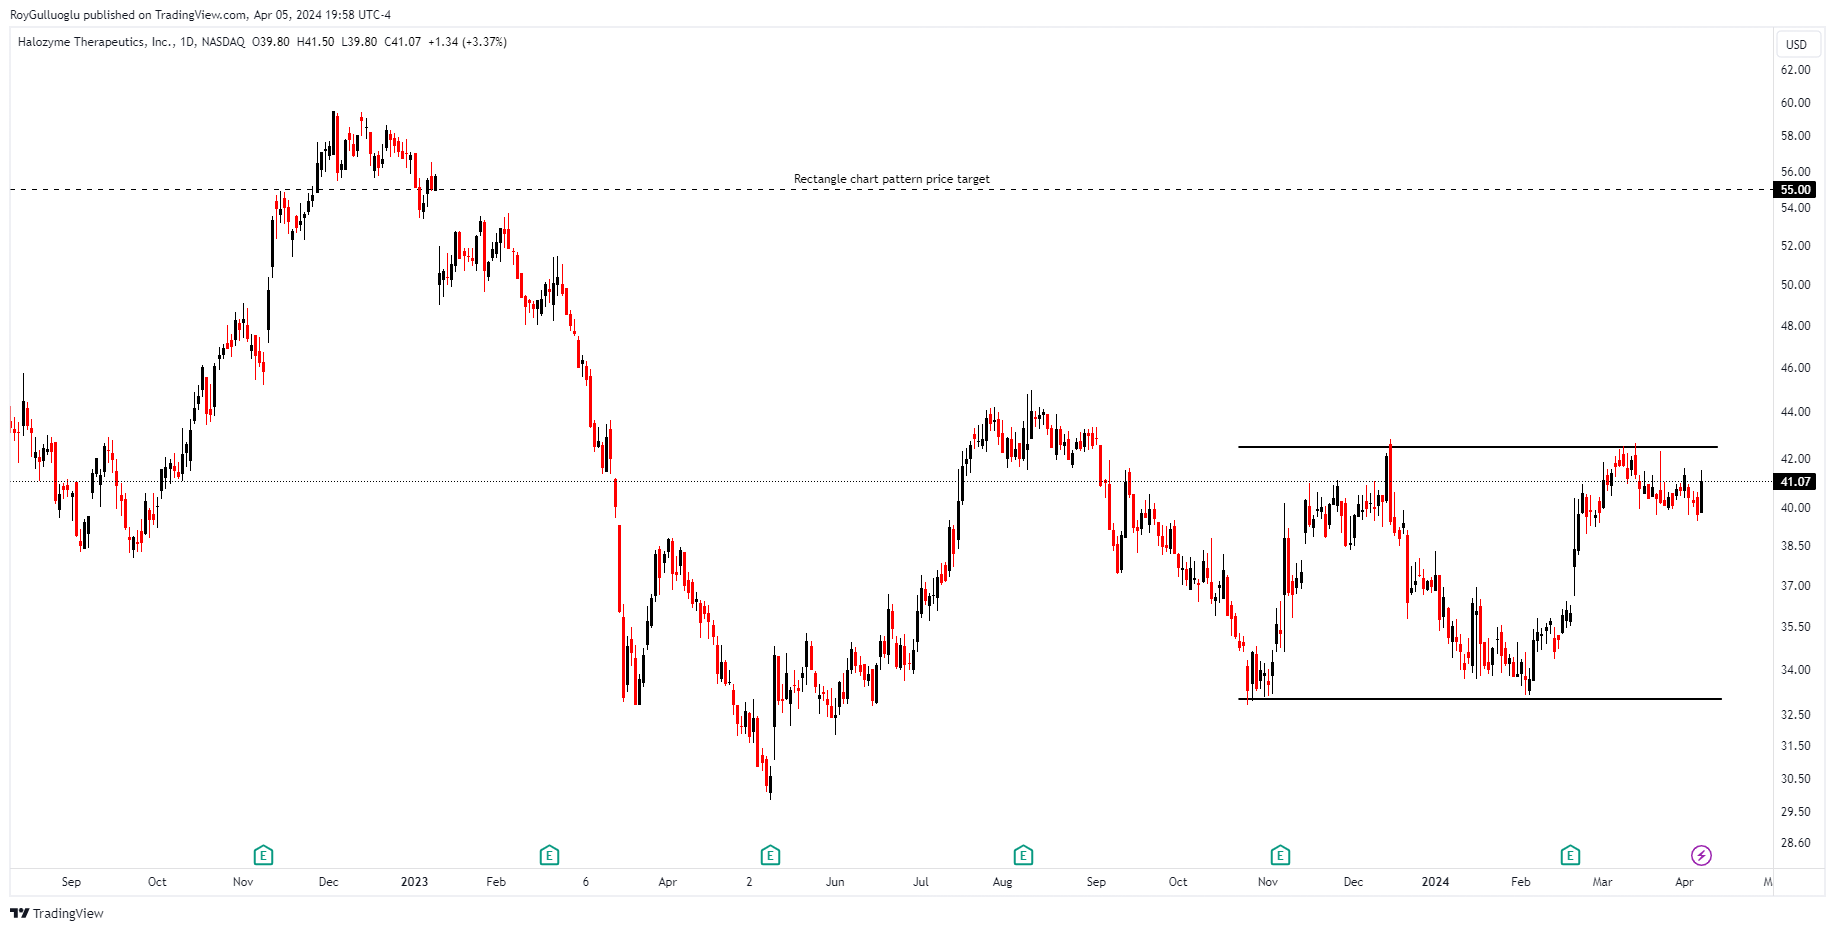
Halozyme Therapeutics, Inc., a biopharmaceutical technology platform company, conducts research, development, and commercialization of proprietary enzymes and devices across various locations including the United States, Switzerland, Belgium, Japan, and worldwide.
The above daily chart formed an approximately 4-month-long rectangle chart pattern.
The horizontal boundary at 42.5 levels acts as a resistance within this pattern.
A daily close above 43.77 levels would validate the breakout from the 4-month-long rectangle chart pattern.
Based on this chart pattern, the potential price target is 55 levels.
HALO, classified under the "healthcare" sector, falls under the “Mid Cap - Value” stock category.
Yantai Jereh Oilfield Services Group Co., Ltd.-(002353/SZSE)-Long Idea

Yantai Jereh Oilfield Services Group Co., Ltd. is involved in equipment manufacturing, oil and gas engineering, technical services, environmental management, and the new energy sector, operating within China and on an international scale.
The above daily chart formed an approximately 10-month-long rectangle chart pattern as a bullish reversal after a downtrend.
The horizontal boundary at 33.22 levels acts as a resistance within this pattern.
A daily close above 34.21 levels would be the breakout from the 10-month-long rectangle chart pattern.
Based on this chart pattern, the potential price target is 46.2 levels.
002353, classified under the "energy" sector, falls under the “Mid Cap - Income” stock category.
Amundi S.A.-(AMUN/EURONEXT)-Long Idea
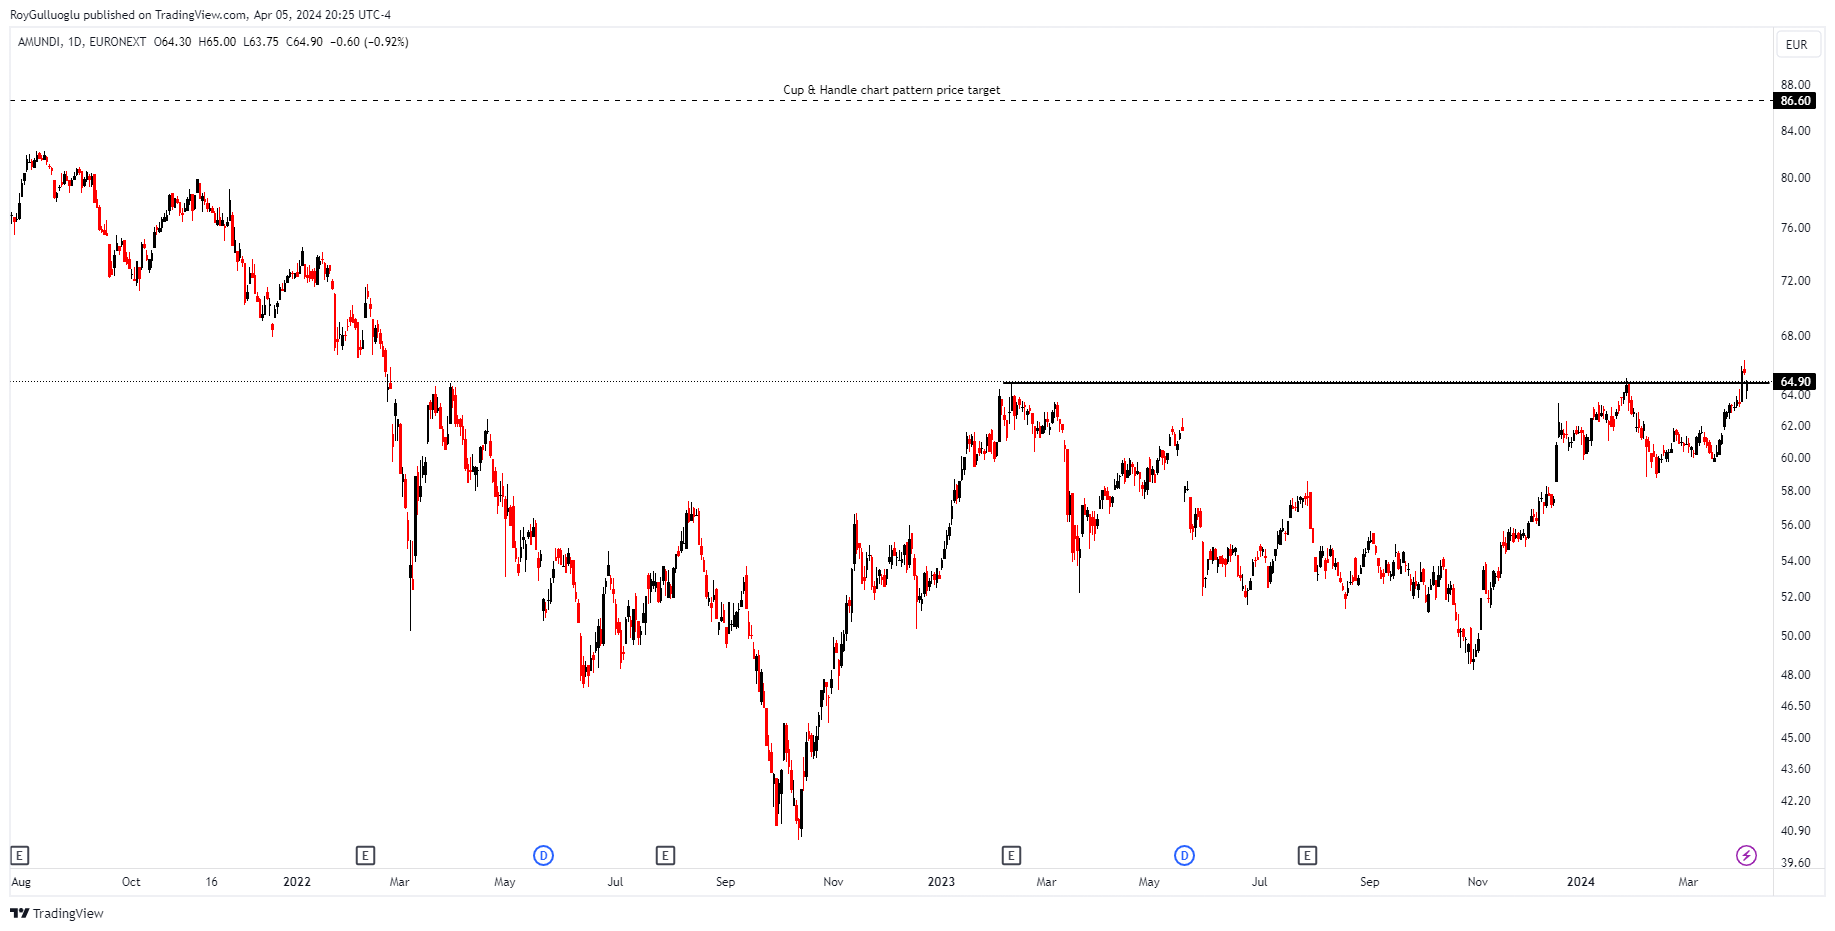
Amundi is a publicly owned investment management firm that operates within the asset management sector. The company offers various retail products and solutions through quasi-exclusive distribution agreements with the retail banking networks of the Crédit Agricole and Société Générale groups in France.
The above daily chart formed an approximately 10-month-long Cup & Handle chart pattern as a bullish continuation after an uptrend.
The boundary at 64.75 levels acts as a resistance within this pattern.
A daily close above 66.7 levels would validate the breakout from the 10-month-long Cup & Handle chart pattern.
Based on this chart pattern, the potential price target is 86.6 levels.
AMUN, classified under the "financial services" sector, falls under the “Large Cap - Income” stock category.