


New setups
MongoDB, Inc.-(MDB/NASDAQ)-Long Idea
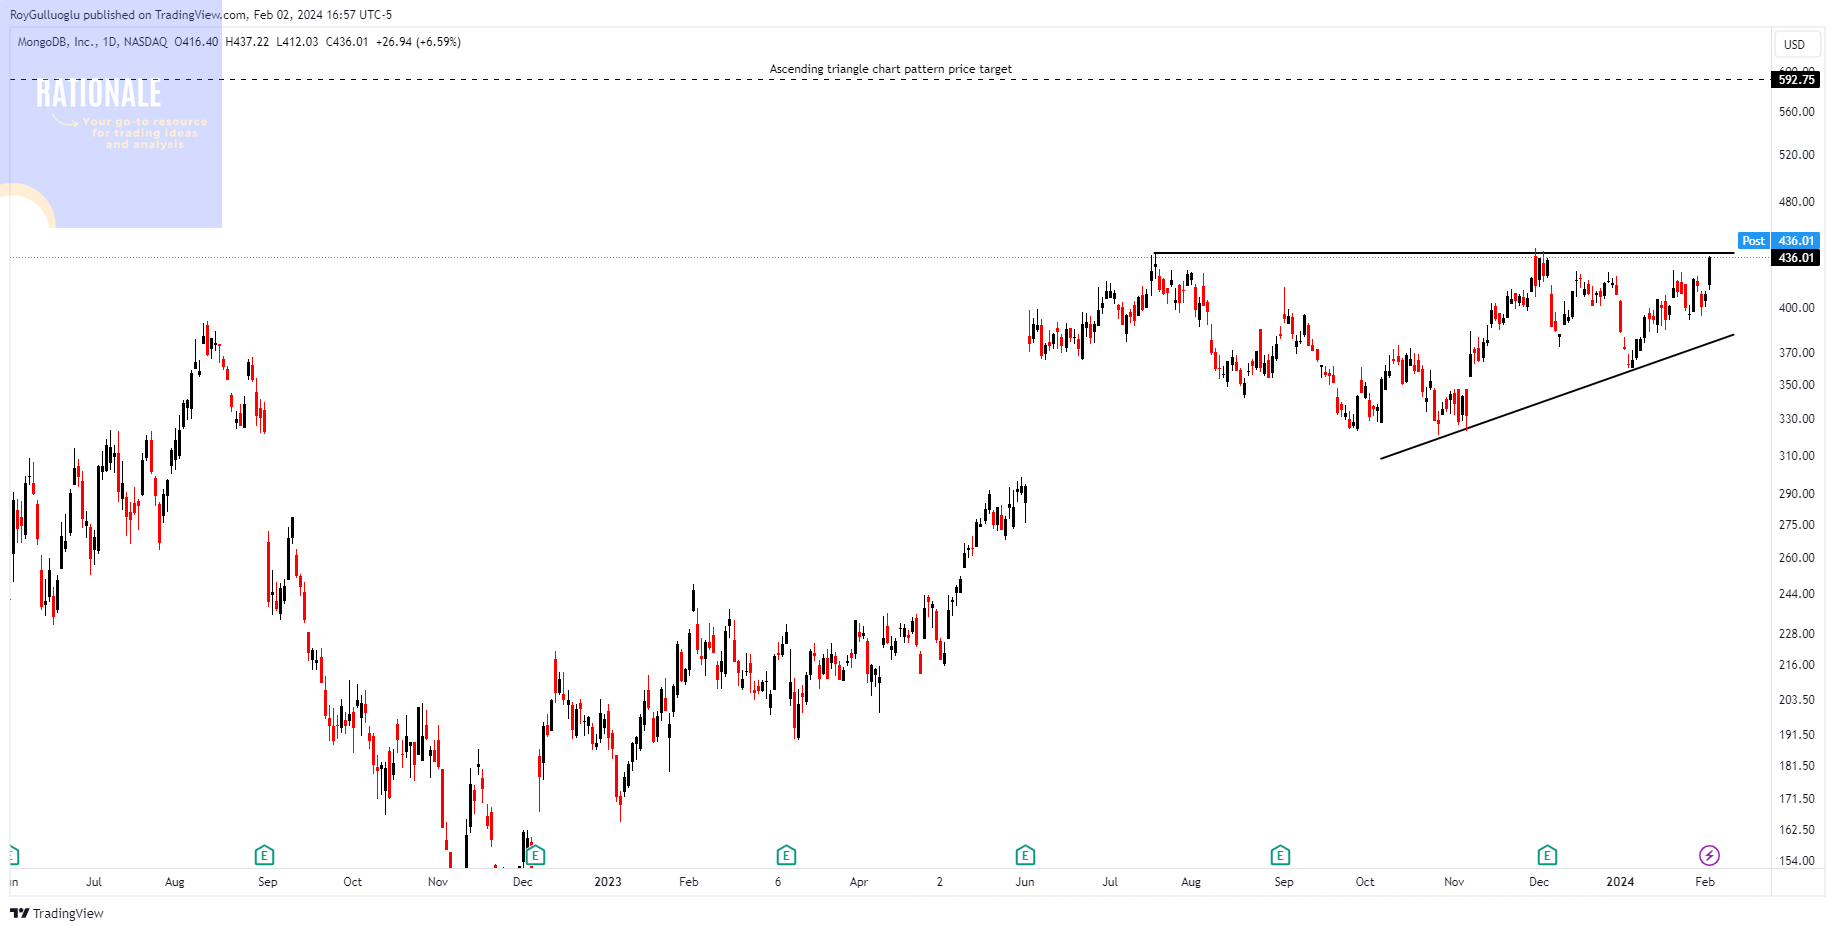
MongoDB, Inc. delivers a versatile database platform globally. The company presents MongoDB Atlas, a hosted multi-cloud database-as-a-service solution; MongoDB Enterprise Advanced, a commercial database server designed for enterprise clients to operate in the cloud, on-premise, or within a hybrid setting; and Community Server, a freely available version of its database encompassing the essential functionality for developers initiating work with MongoDB.
The above daily chart formed an approximately 4-month-long ascending triangle chart pattern as a bullish continuation after an uptrend.
The horizontal boundary at 439 levels acts as a resistance within this pattern.
A daily close above 452.1 levels would validate the breakout from the 4-month-long ascending triangle chart pattern.
Based on this chart pattern, the potential price target is 592.75 levels.
Multiple quarters of increasing EPS and revenue is another strength of the stock.
MDB, classified under the "technology" sector, falls under the “Large Cap - Growth” stock category.
Janus Henderson Group plc-(JHG/NYSE)-Long Idea
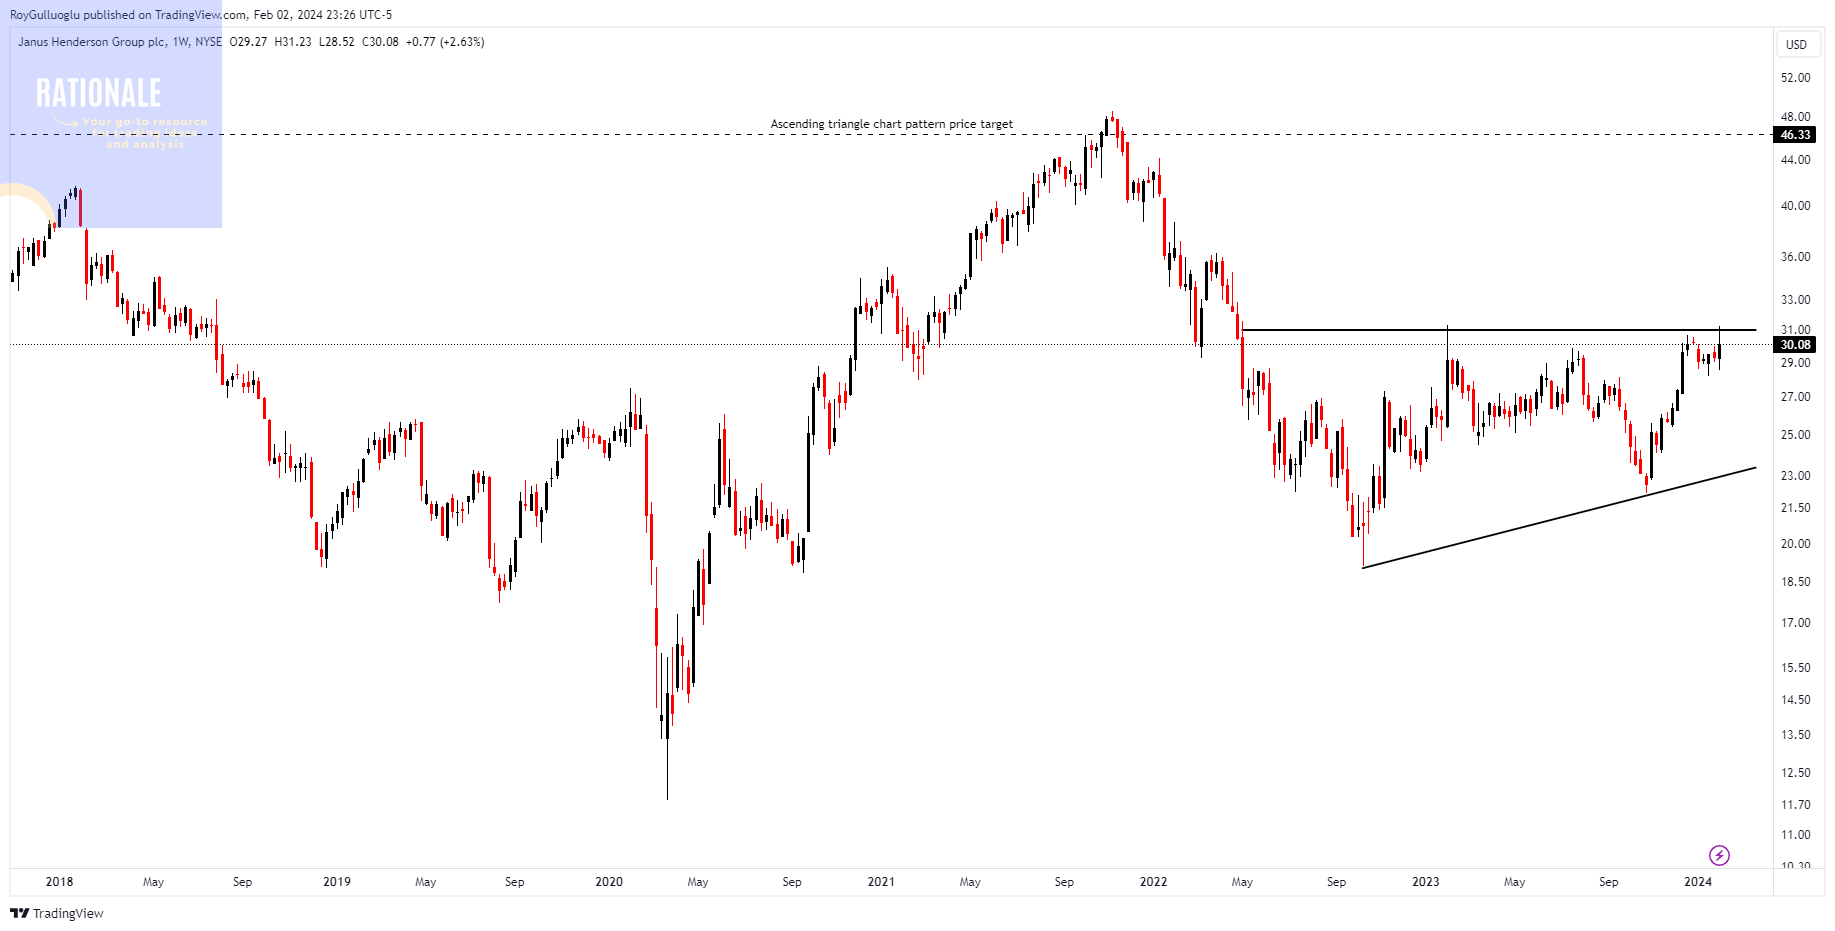
Janus Henderson Group plc is an asset management holding entity. Through its subsidiaries, the firm provides services to institutional, retail clients, and high-net-worth clients. It manages separate client-focused equity and fixed-income portfolios.
The above weekly chart formed an approximately 22-month-long ascending triangle chart pattern as a bullish reversal after a downtrend.
Within this pattern, the horizontal boundary at 31 levels acts as a resistance.
A daily close above 31.93 levels would validate the breakout from the 3-month-long ascending triangle chart pattern.
Based on this chart pattern, the potential price target is 46.3levels.
Three-quarters of EPS acceleration YoY in Quarterly Earnings is another strength of the stock.
JHG, classified under the "financial services" sector, falls under the “Mid Cap - Income” stock category.
Ametek, Inc.-(AME/NYSE)-Long Idea
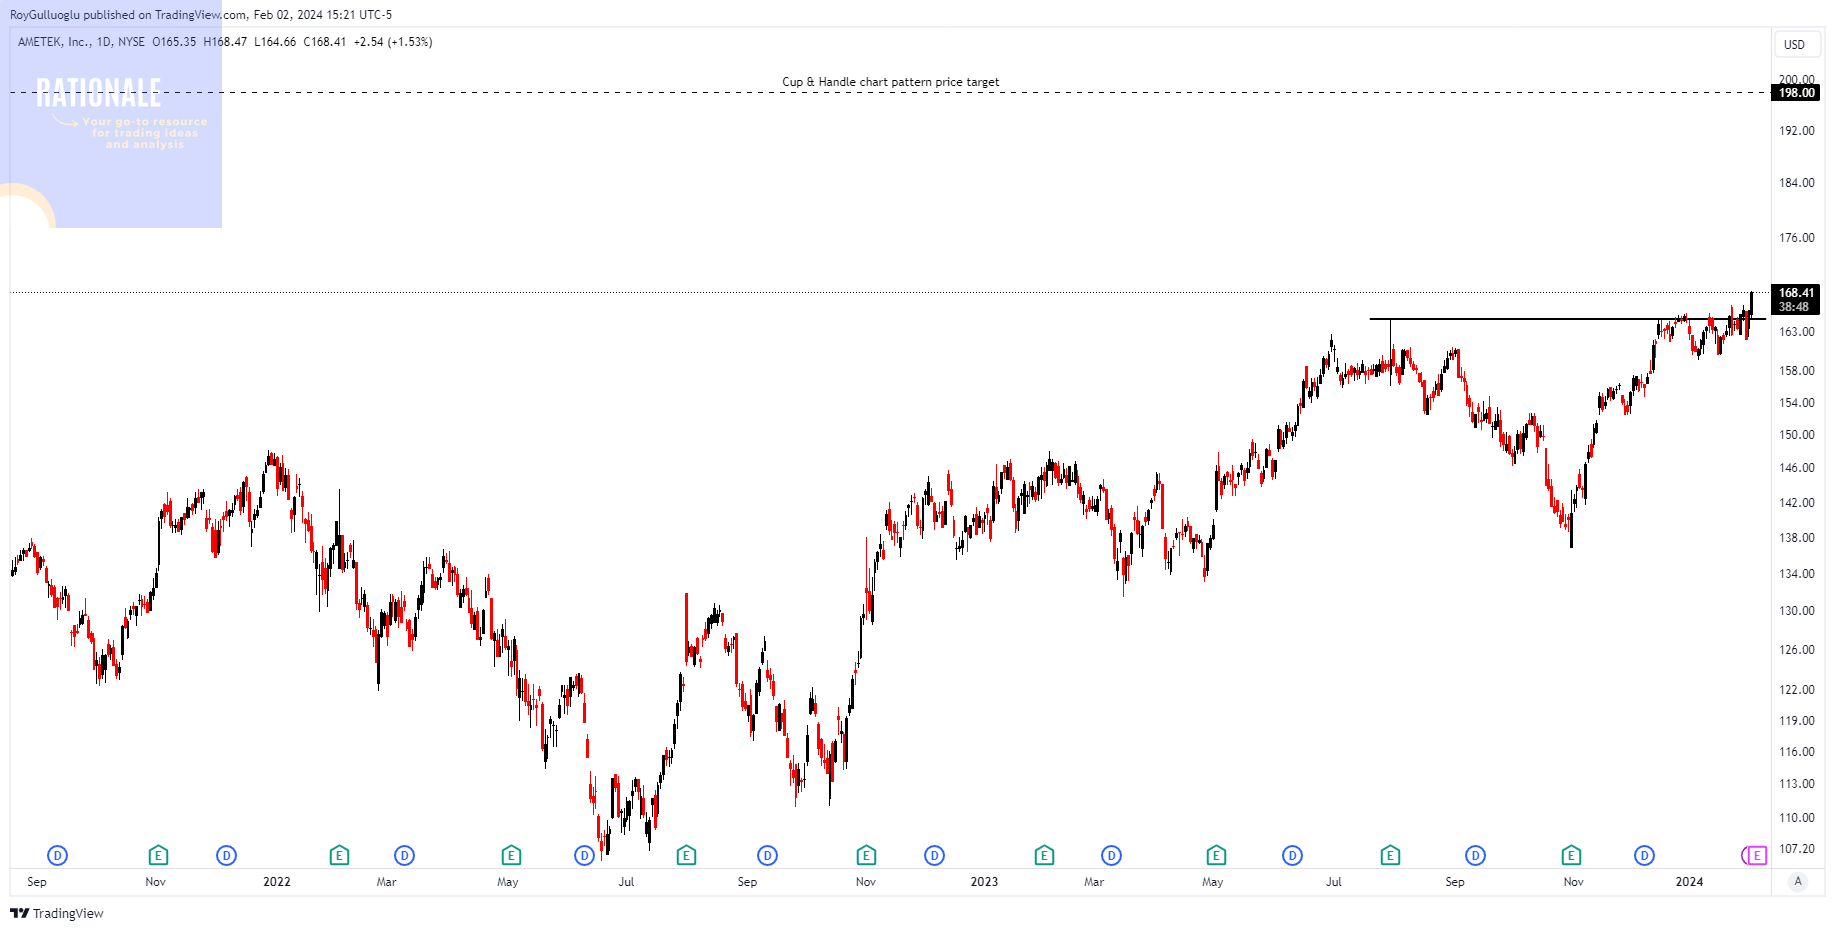
AMETEK, Inc. produces and markets electronic instruments and electromechanical devices across North America, Europe, Asia, and South America.
The above daily chart formed an approximately 4-month-long cup & handle chart pattern as a bullish continuation after an uptrend.
Within this pattern, the horizontal boundary at 164.75 levels acts as a resistance.
A daily close above 169.69 levels would validate the breakout from the 4-month-long Cup & Handle chart pattern.
Based on this chart pattern, the potential price target is 198 levels.
Three-quarters of EPS acceleration YoY in Quarterly Earnings is another strength of the stock.
AME, classified under the "industrials" sector, falls under the “Large Cap - Value” stock category.
Sun Life Financial, Inc.-(SLF/NYSE) - Long Idea
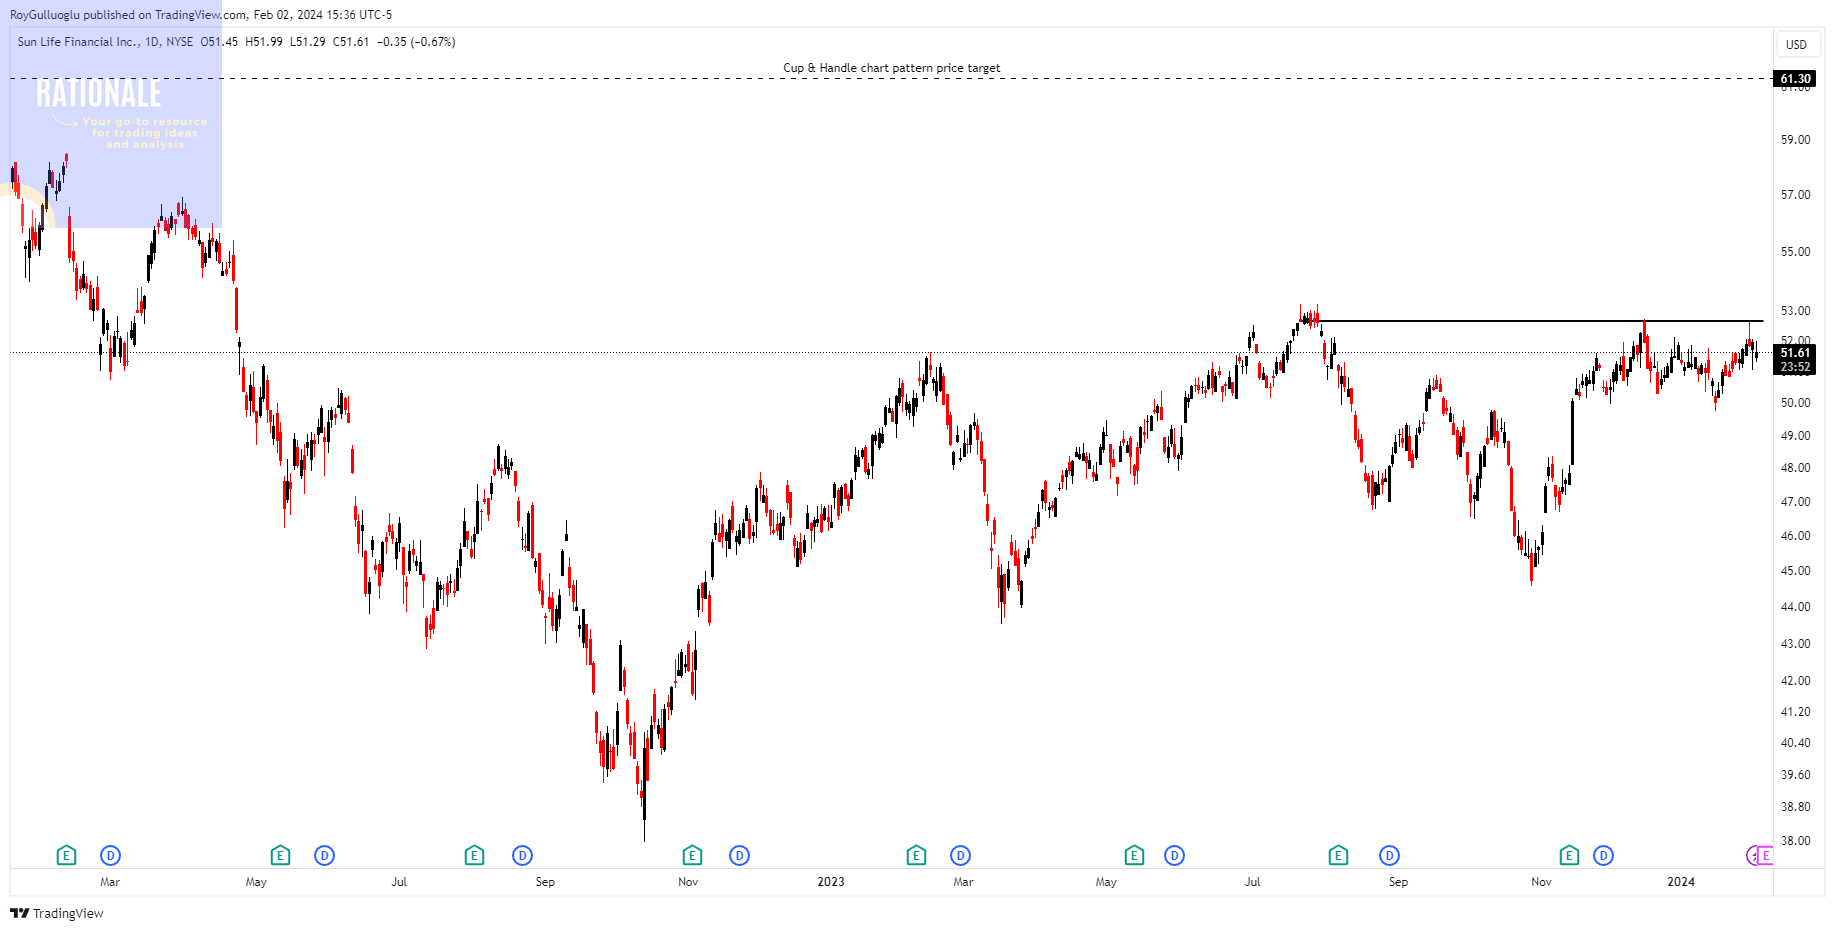
Sun Life Financial Inc., a financial services company, provides savings, retirement, and pension products worldwide. It offers term and permanent life, as well as personal health, dental, critical illness, long-term care, and disability insurance products.
The above daily chart formed an approximately 4-month-long cup & handle chart pattern as a bullish continuation after an uptrend.
The boundary at 52.64 levels acts as a resistance within this pattern.
A daily close above 54.22 levels would validate the breakout from the 4-month-long Cup & Handle chart pattern.
Based on this chart pattern, the potential price target is 61.3 levels.
SLF, classified under the "financial services" sector, falls under the “Large Cap - Income” stock category.
Motorola Solutions, Inc.-(MSI/NYSE)-Long Idea
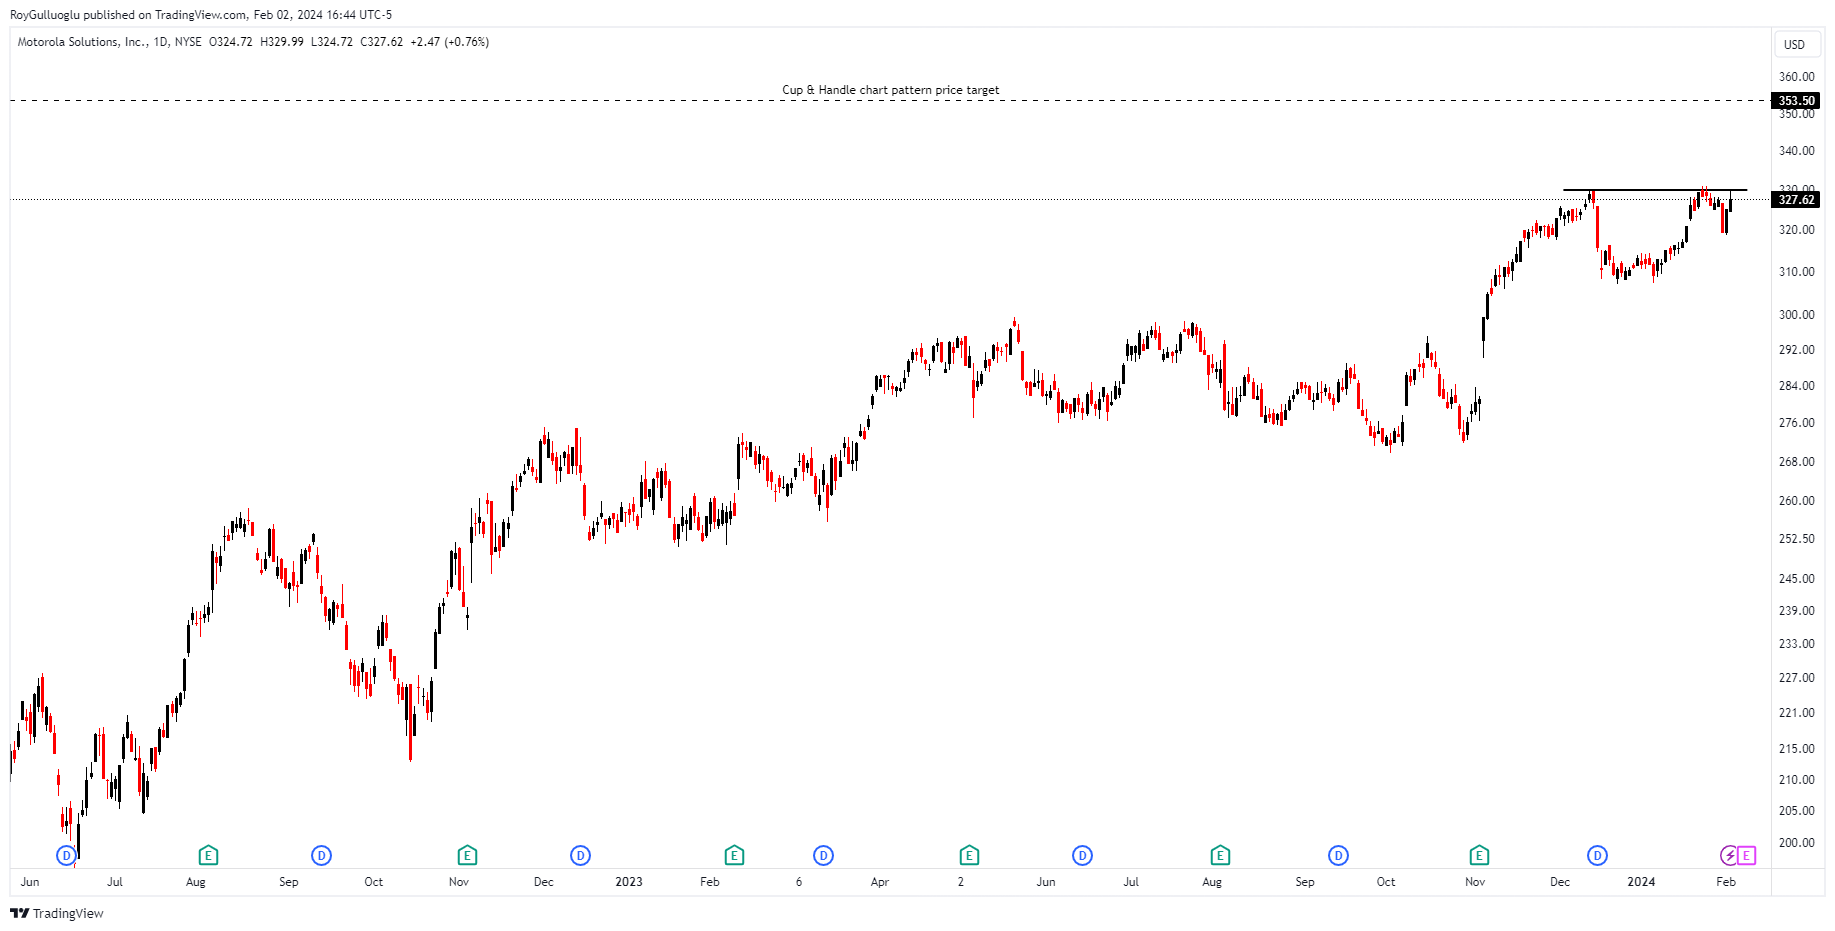
Motorola Solutions, Inc. provides public safety and enterprise security solutions in the United States, the United Kingdom, Canada, and internationally. The company operates in two segments, Products and Systems Integration, and Software and Services.
The above daily chart formed an approximately 2-month-long cup & handle chart pattern as a bullish continuation after an uptrend.
The boundary at 330 levels acts as a resistance within this pattern.
A daily close above 340 levels would validate the breakout from the 2-month-long Cup & Handle chart pattern.
Based on this chart pattern, the potential price target is 353 levels.
MSI, classified under the "technology" sector, falls under the “Large Cap - Growth” stock category.
Oracle Corporation-(ORCL/NYSE)-Long Idea
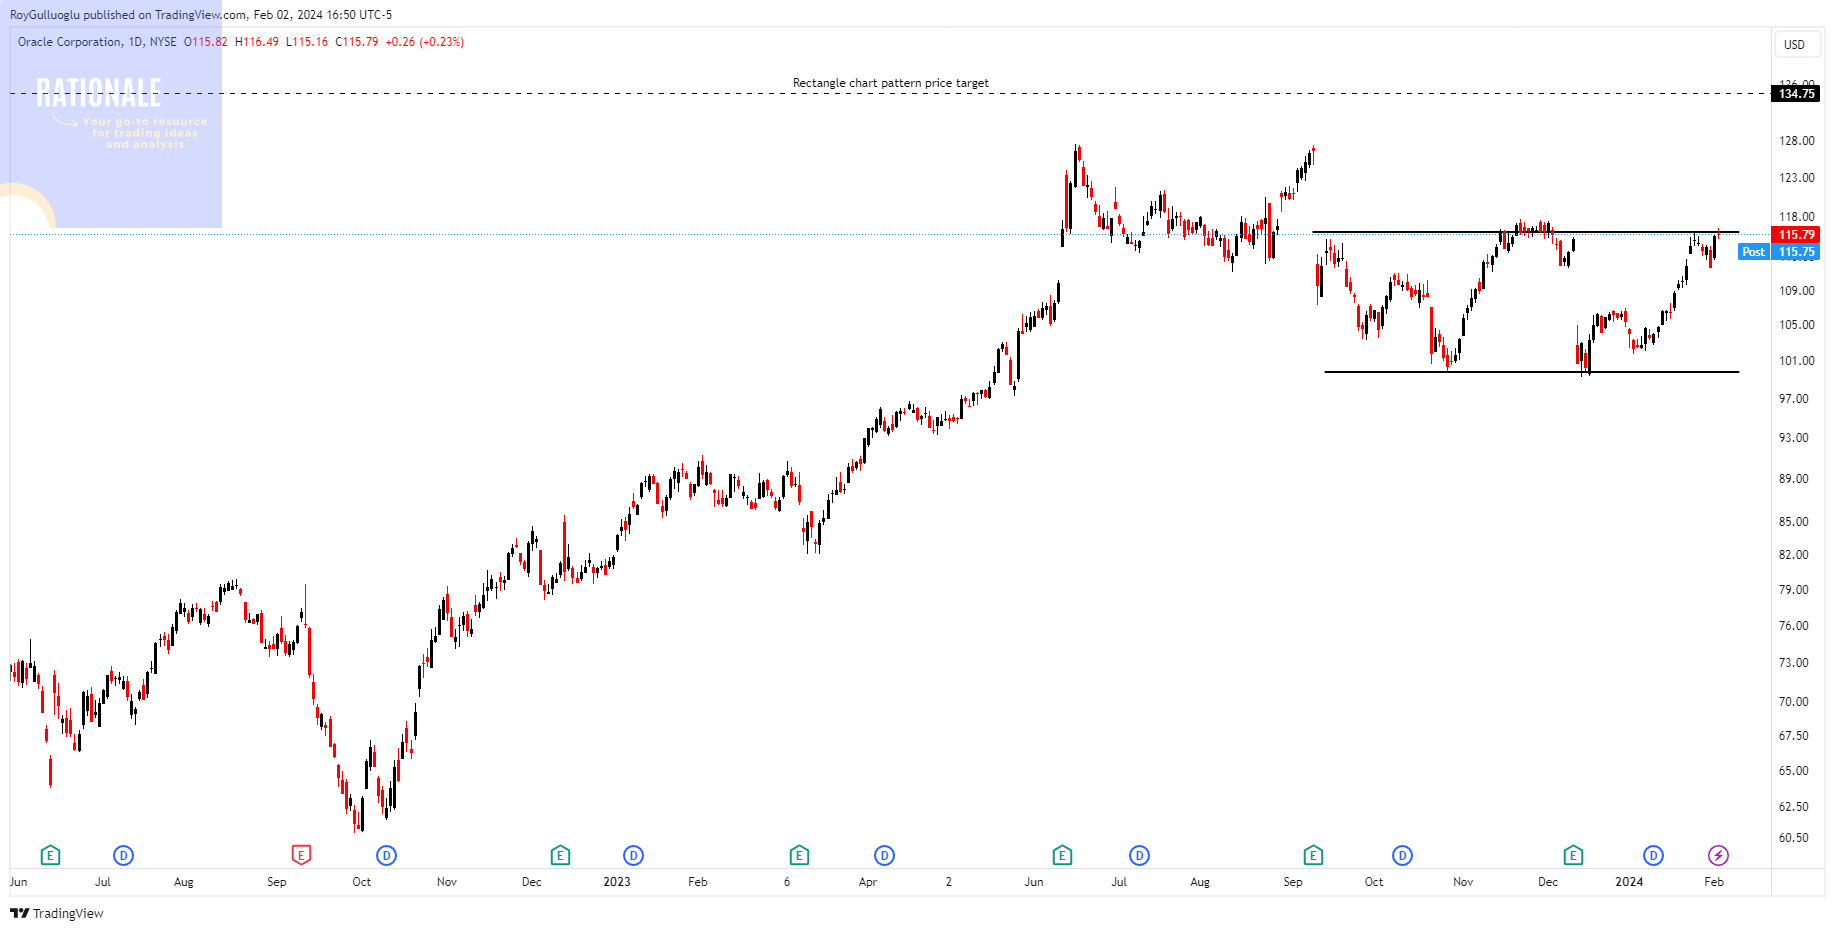
Oracle Corporation offers products and services that address enterprise information technology environments worldwide.
The above daily chart formed an approximately 3-month-long rectangle chart pattern as a bullish reversal after a downtrend.
The horizontal boundary at 116 levels acts as a resistance within this pattern.
A daily close above 119.48 levels would validate the breakout from the 3-month-long rectangle chart pattern.
Based on this chart pattern, the potential price target is 134.75 levels.
ORCL, classified under the "technology" sector, falls under the “Large Cap - Growth” stock category.
Yum! Brands, Inc.-(YUM/NYSE)-Long Idea
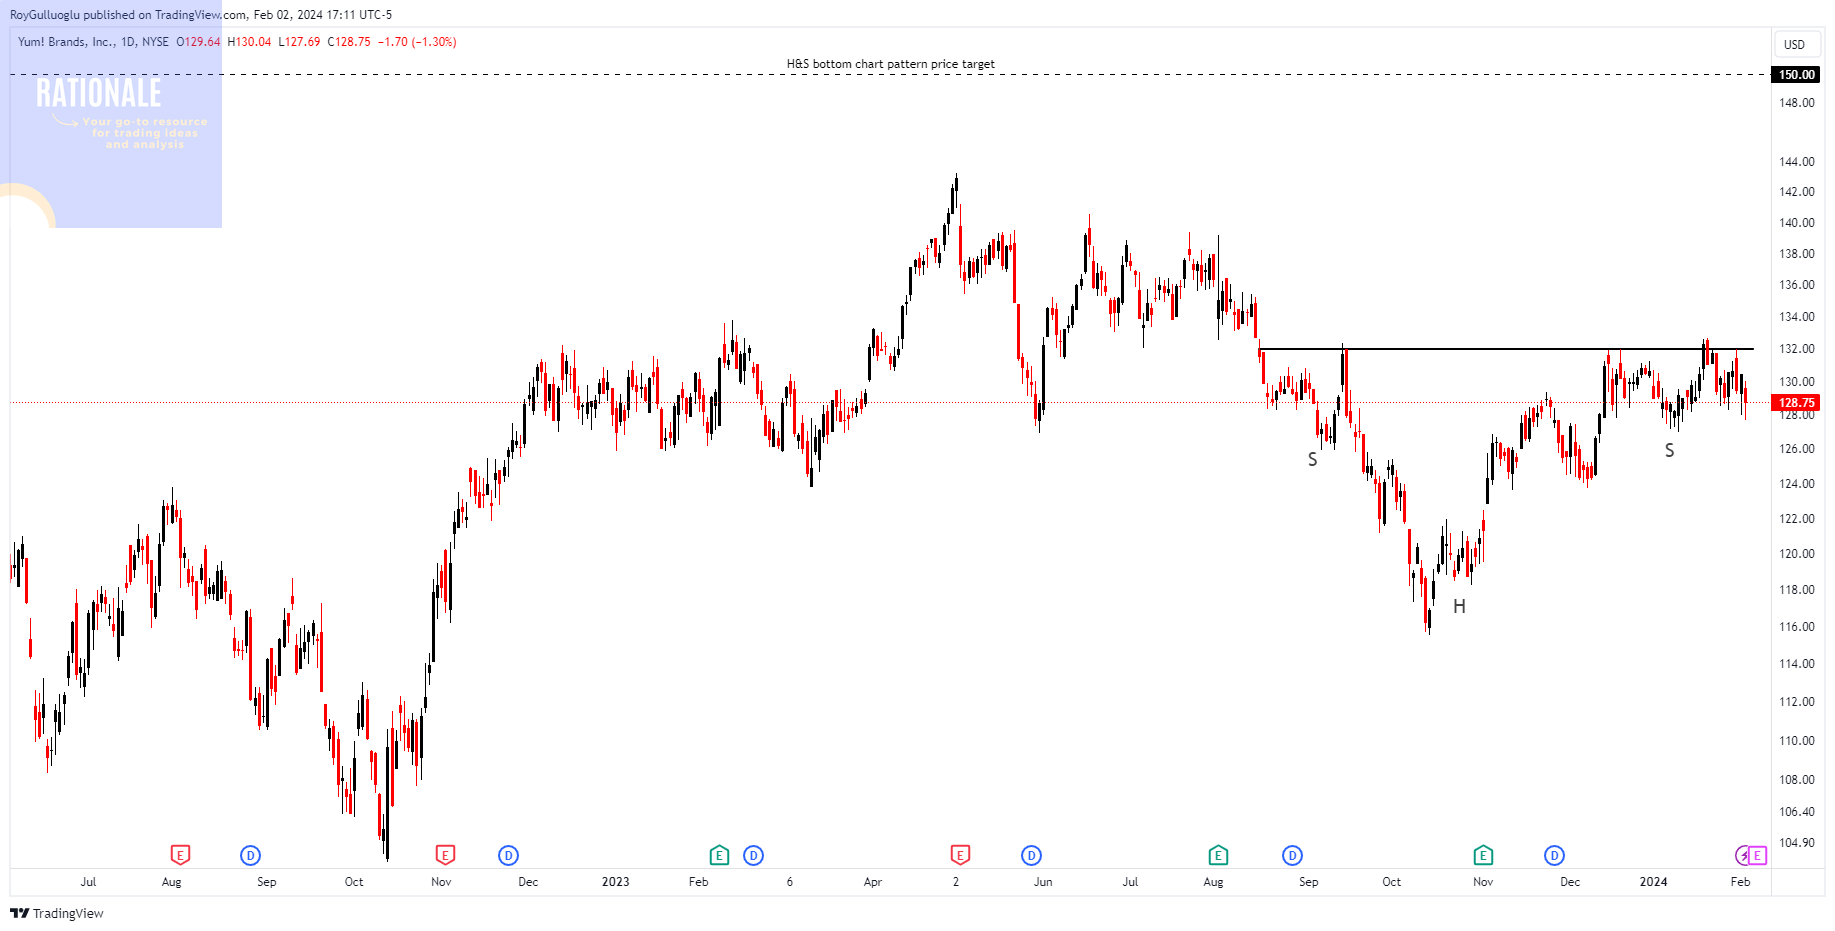
Yum! Brands, Inc., together with its subsidiaries, develops, operates, and franchises quick-service restaurants worldwide. The company operates through four segments: the KFC Division, the Taco Bell Division, the Pizza Hut Division, and the Habit Burger Grill Division.
The above weekly chart formed an approximately 4-month-long H&S bottom chart pattern as a bullish reversal after a downtrend.
The horizontal boundary at 132 levels acts as a resistance within this pattern.
A daily close above 135.96 levels would validate the breakout from the 4-month-long H&S bottom chart pattern.
Based on this chart pattern, the potential price target is 150 levels.
YUM, classified under the "consumer cyclical" sector, falls under the “Large Cap - Growth” stock category.
Follow-ups
Weatherford International plc-(WFRD/NASDAQ)-Long Idea
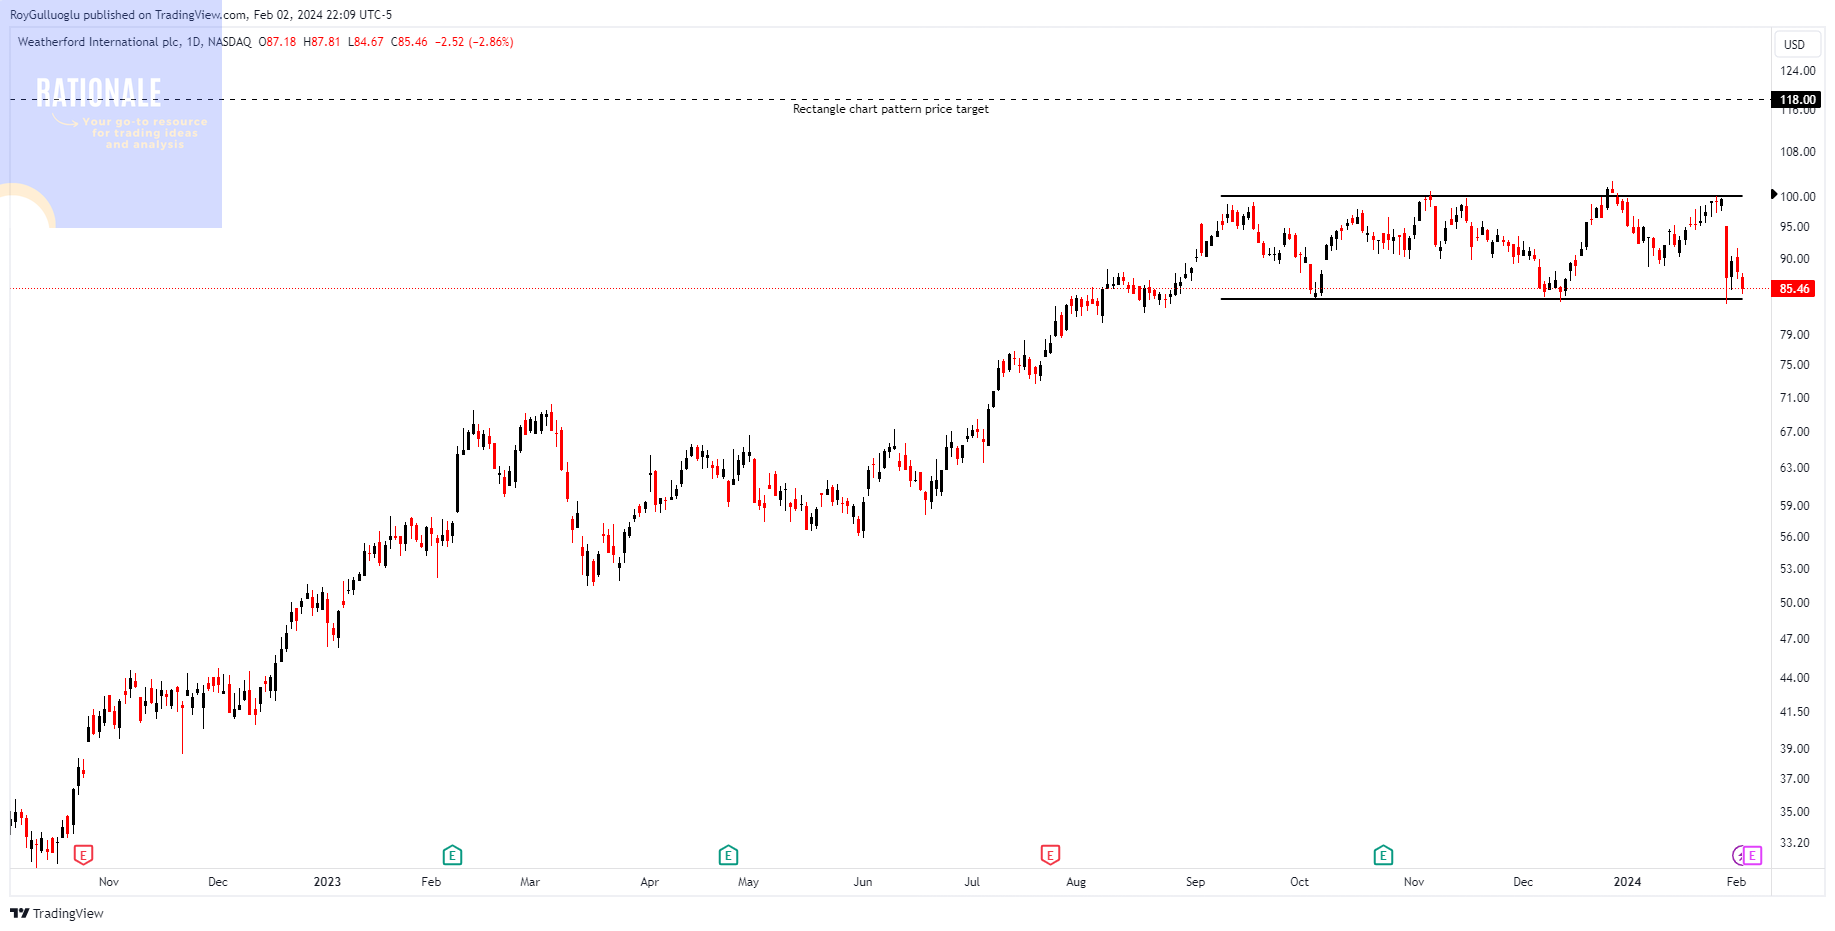
You can click the WFRD ticker above to access the first report explaining the RATIONALE behind the trade idea.
The price of the equity is testing the support level of the rectangle chart pattern.
The resistance level is changed to 100 level from 99.1. Accordingly, a daily close above 103 levels would validate the breakout from the 2.5-month-long rectangle chart pattern.
Applovin Corporation-(APP/NASDAQ)-Long Idea
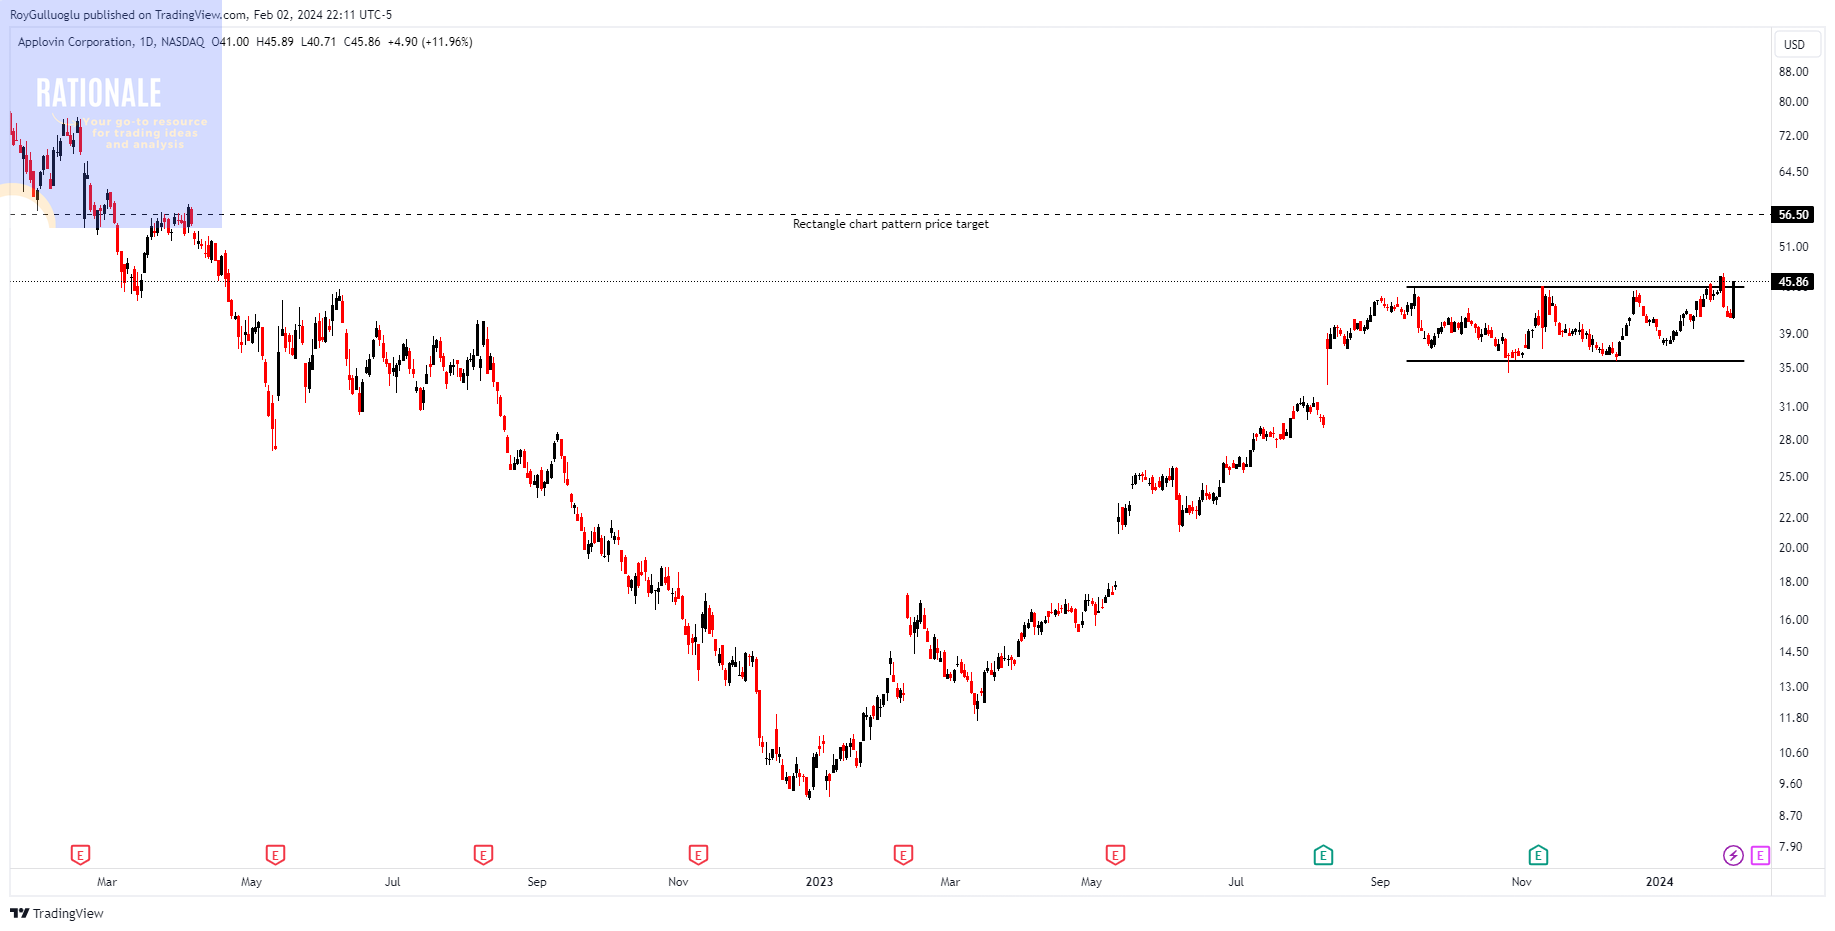
You can click the APP ticker above to access the first report explaining the RATIONALE behind the trade idea.
W.W. Grainger , Inc-(GWW/NYSE)-Long Idea
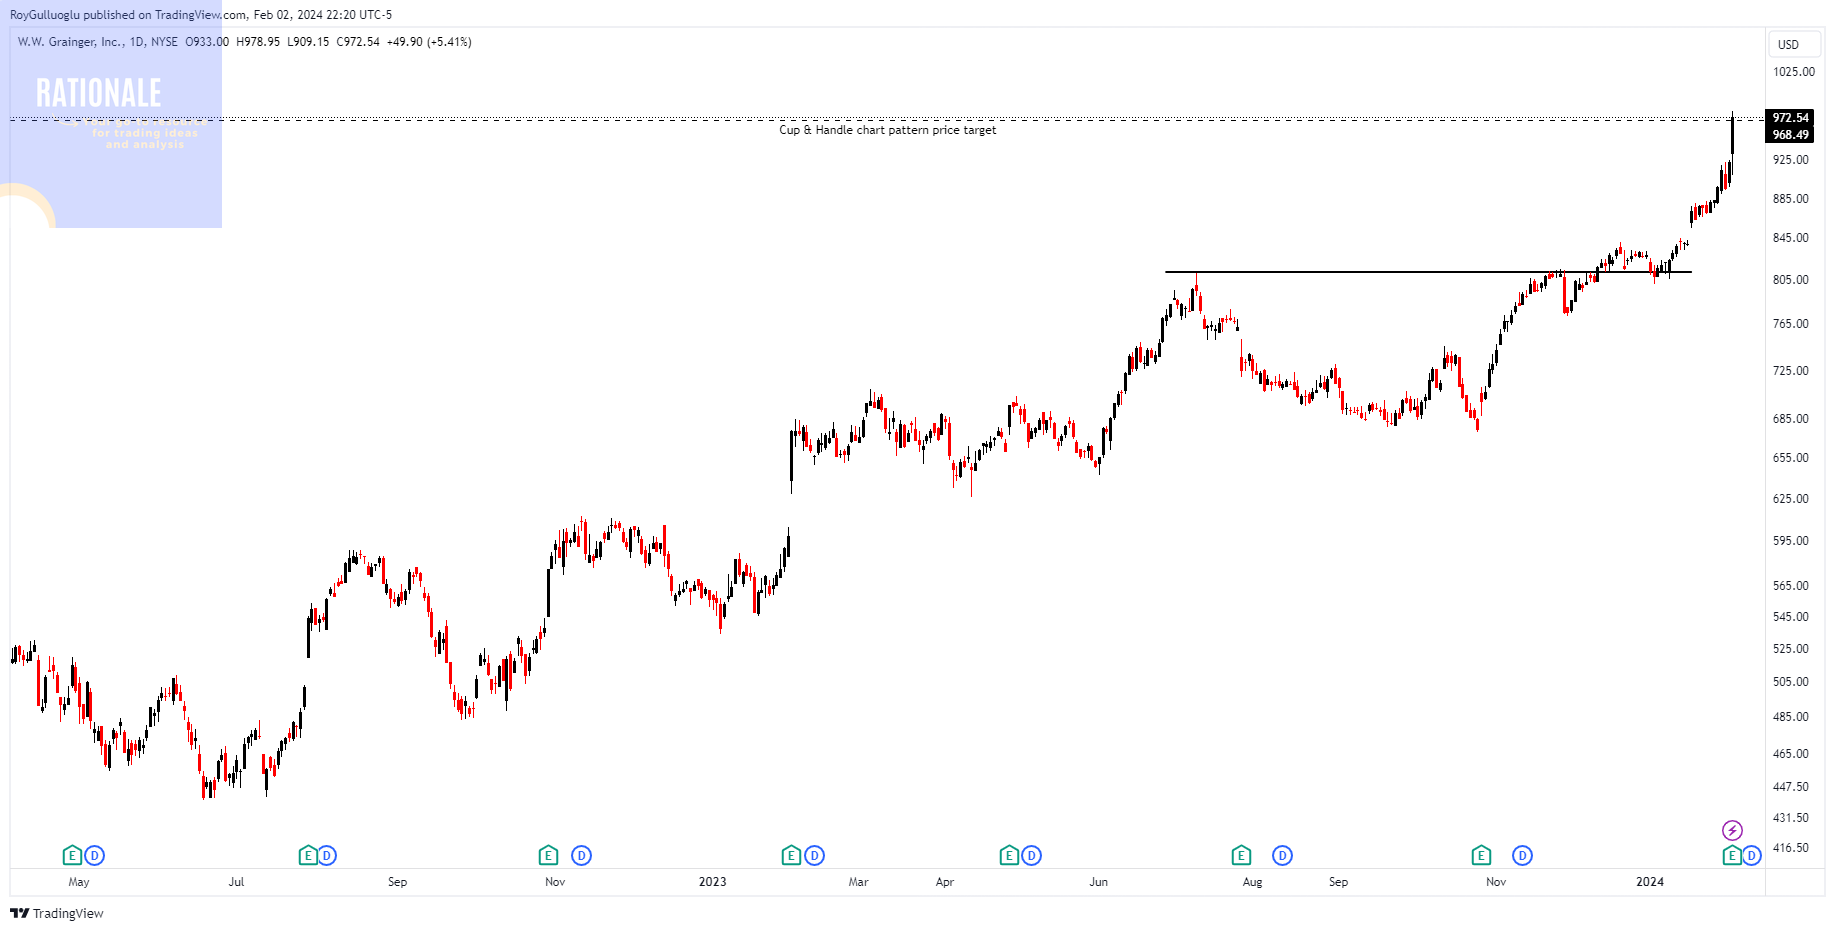
You can click the GWW ticker above to access the first report explaining the RATIONALE behind the trade idea.
The cup & candle chart pattern price target is reached.
Nucor Corporation-(NUE/NYSE)-Long Idea
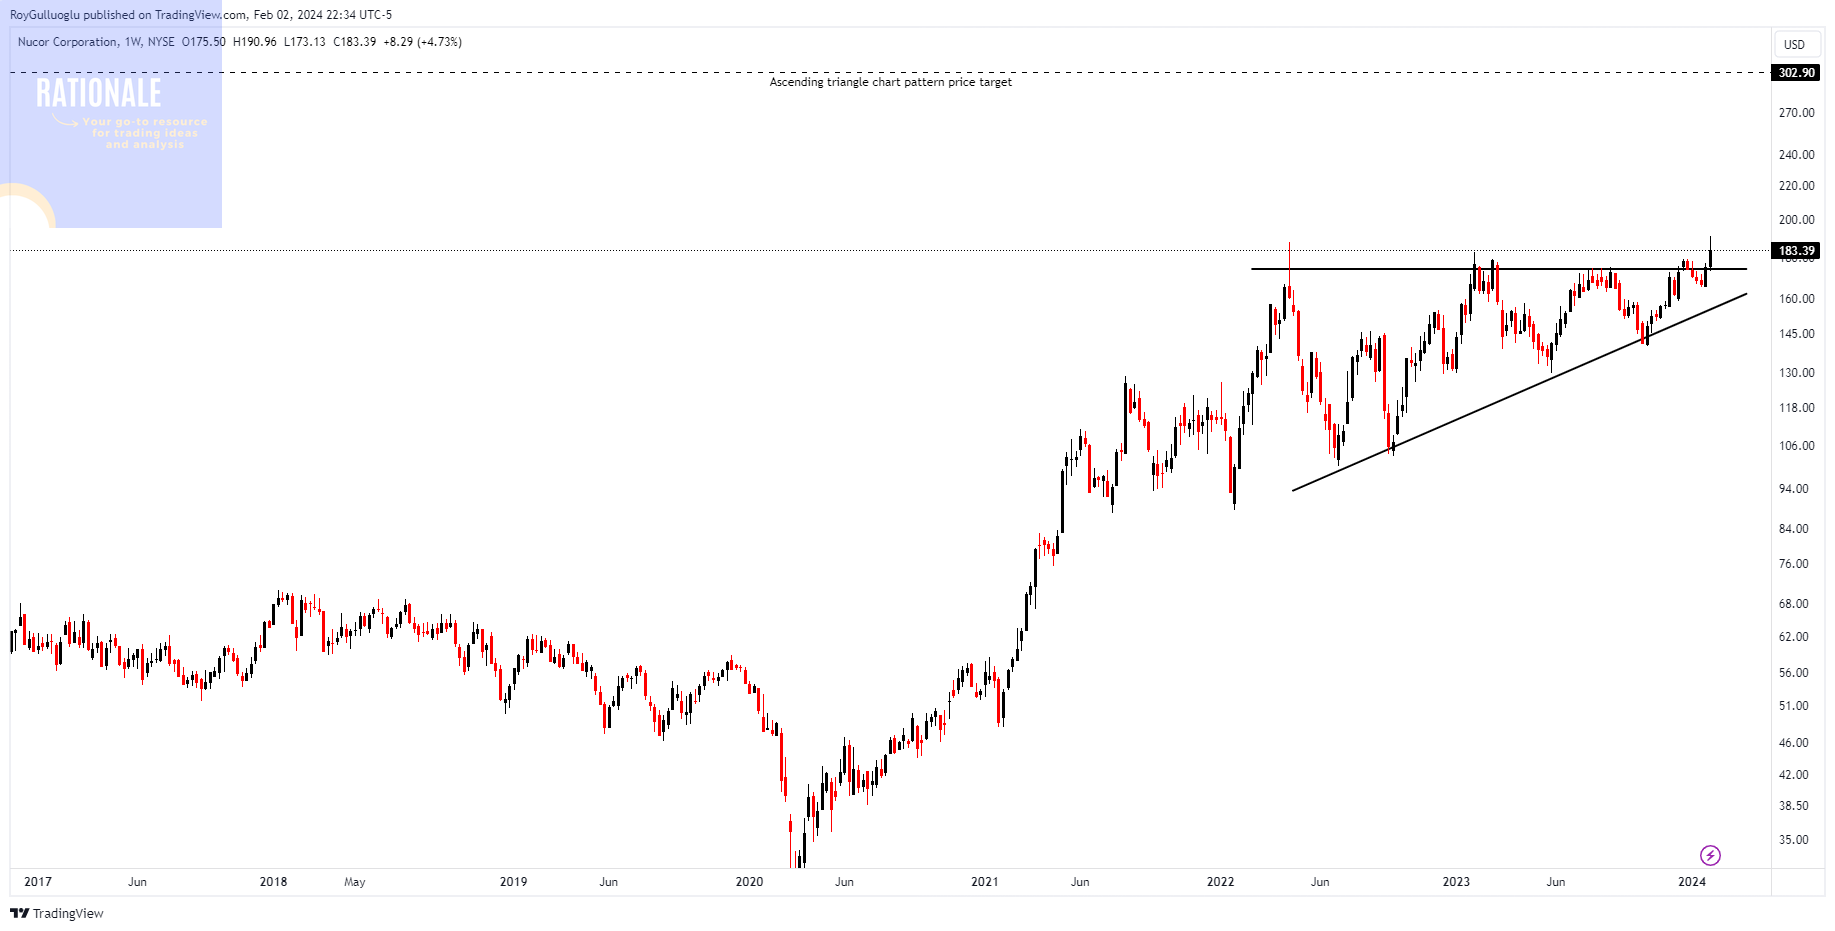
You can click the NUE ticker above to access the first report explaining the RATIONALE behind the trade idea.
Union Pacific Corporation-(UNP/NYSE)-Long Idea
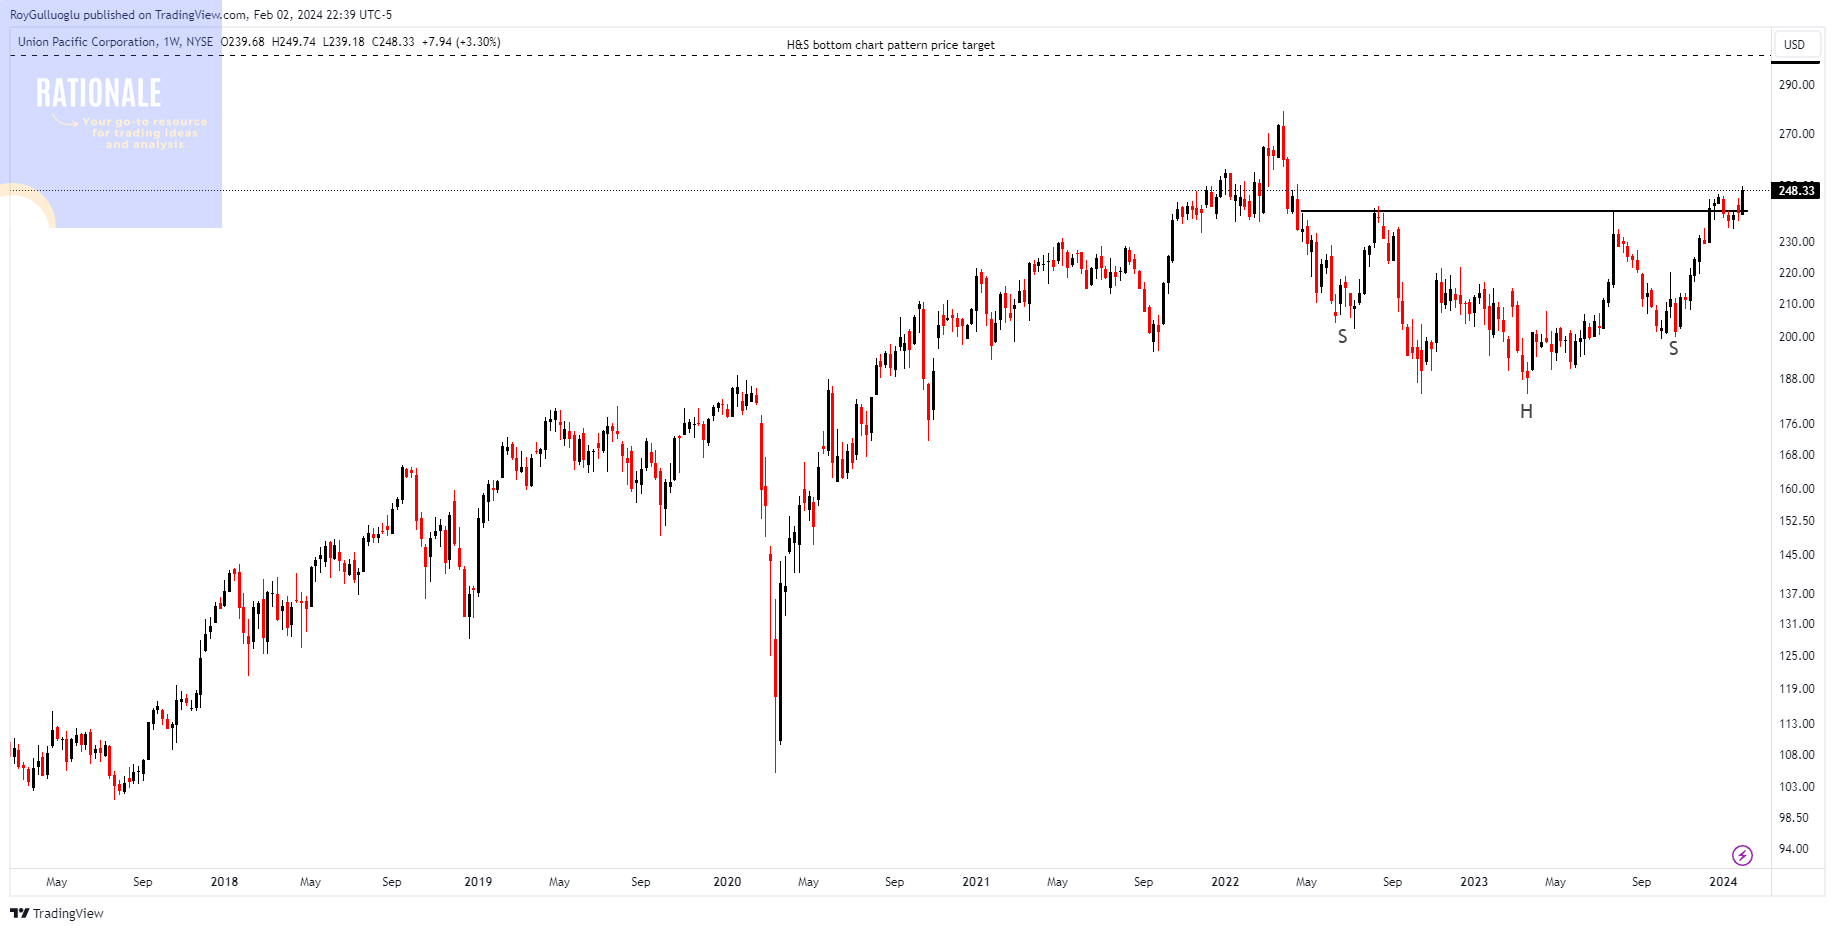
You can click the UNP ticker above to access the first report explaining the RATIONALE behind the trade idea.