


New setups
Palo Alto Networks, Inc-(PANW/NASDAQ)-Long Idea

Palo Alto Networks Inc. specializes in developing and offering cybersecurity solutions for networks and endpoints, specifically designed for enterprise customers.
The above daily chart formed approximately a month-long rectangle chart pattern as a bullish continuation after an uptrend.
Within this pattern, the horizontal boundary at 265.6 levels acts as a resistance.
A daily close above 273.5 levels would validate the breakout from the 1-month-long rectangle chart pattern.
Based on this chart pattern, the potential price target is 296.5 levels.
However, rather than positioning at the potential breakout of the rectangle chart pattern, the ideal entry point to me in the daily graph is shown as a `B/O arrow` in the attached graph.
The price broke out after a multiple price contraction as shown in the graph where the volume contraction accompanied, then it got pulled back to the current levels of 240$-245$.
240$-245$ levels also coincide with the long-term uptrend which you can trace with higher lows shown in the graph(4 touches).
PANW, classified under the "technology" sector, falls under the “Large Cap - Growth” stock category.
The AI narrative also supports the PANW considering the demand for robust cybersecurity measures becomes imperative to protect AI systems, sensitive data, and interconnected networks.
Multiple quarters of EPS, and revenue acceleration YoY in Quarterly Earnings is another strength of the stock.
T-Mobile US, Inc-(TMUS/NASDAQ)-Long Idea
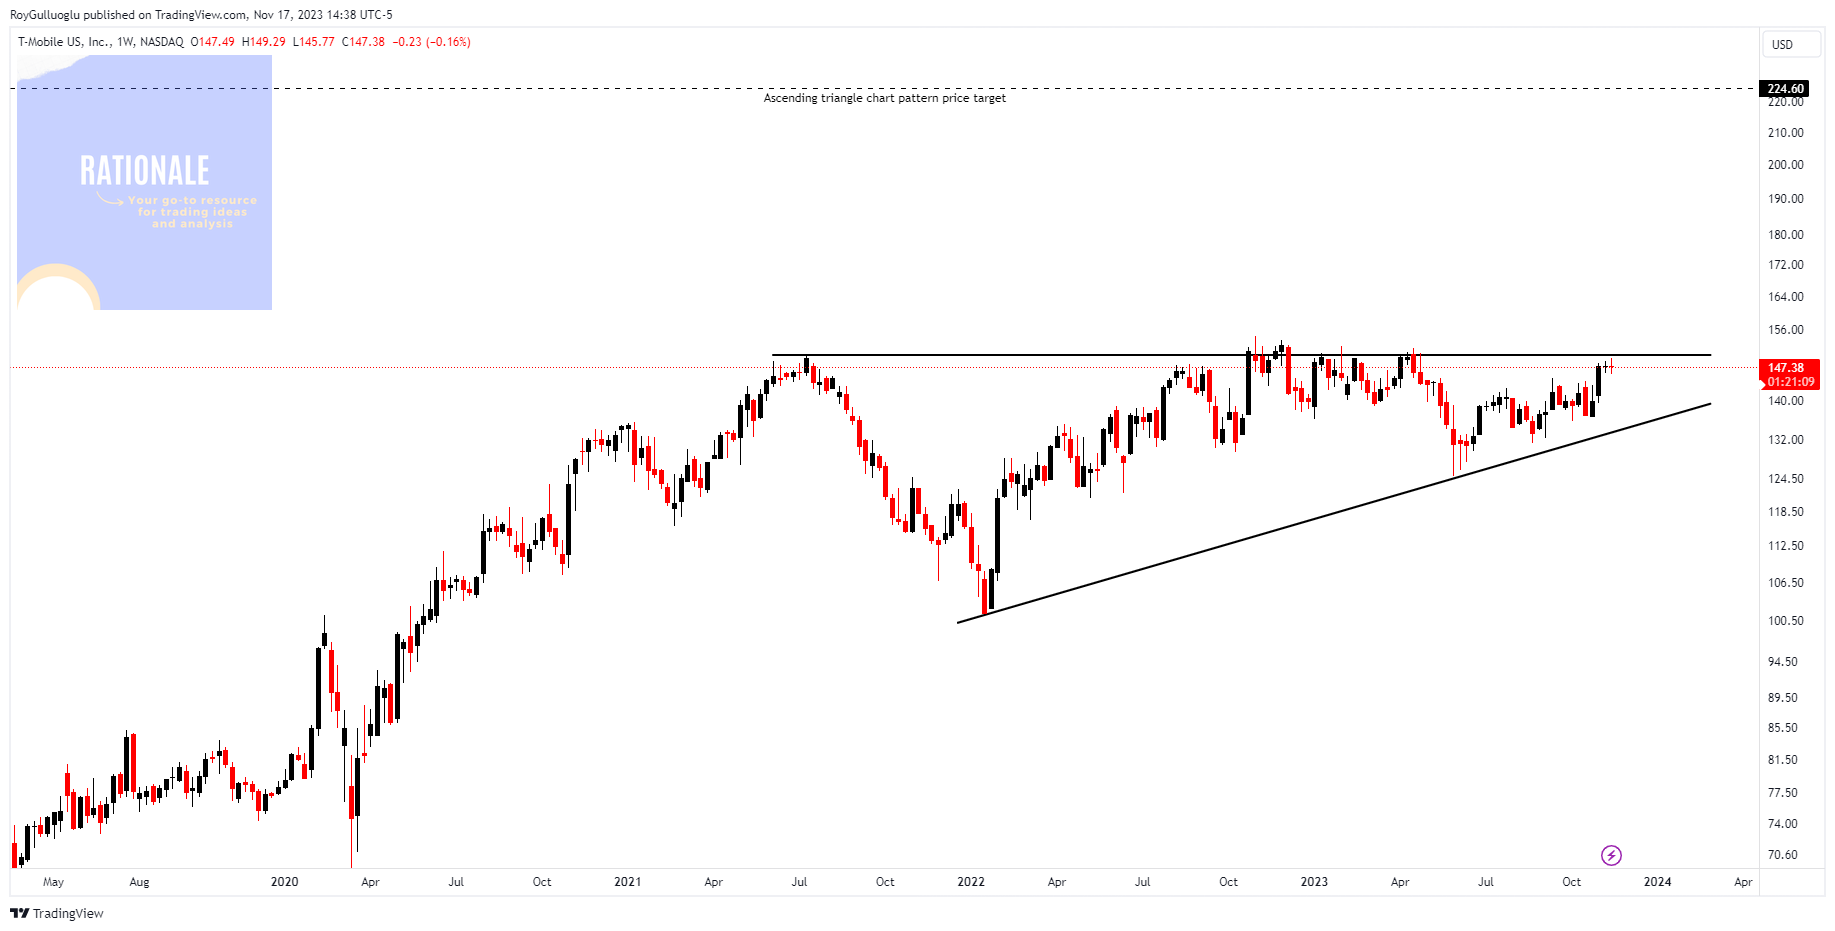
T-Mobile US, Inc. and its subsidiaries provide mobile communication services, including voice, messaging, and data, across the United States, Puerto Rico, and the United States Virgin Islands. They offer a variety of wireless devices, financing options, and High-Speed Internet services. T-Mobile operates retail stores under the T-Mobile and Metro by T-Mobile brands. Founded in 1994, the company is headquartered in Bellevue, Washington.
The above weekly chart formed an approximately 30-month-long ascending triangle chart pattern as a bullish continuation after an uptrend.
Within this pattern, the horizontal boundary at 150 levels acts as strong resistance.
A daily close above 154.5 levels would validate the breakout from the 30-month-long ascending triangle chart pattern.
Based on this chart pattern, the potential price target is 224.6 levels.
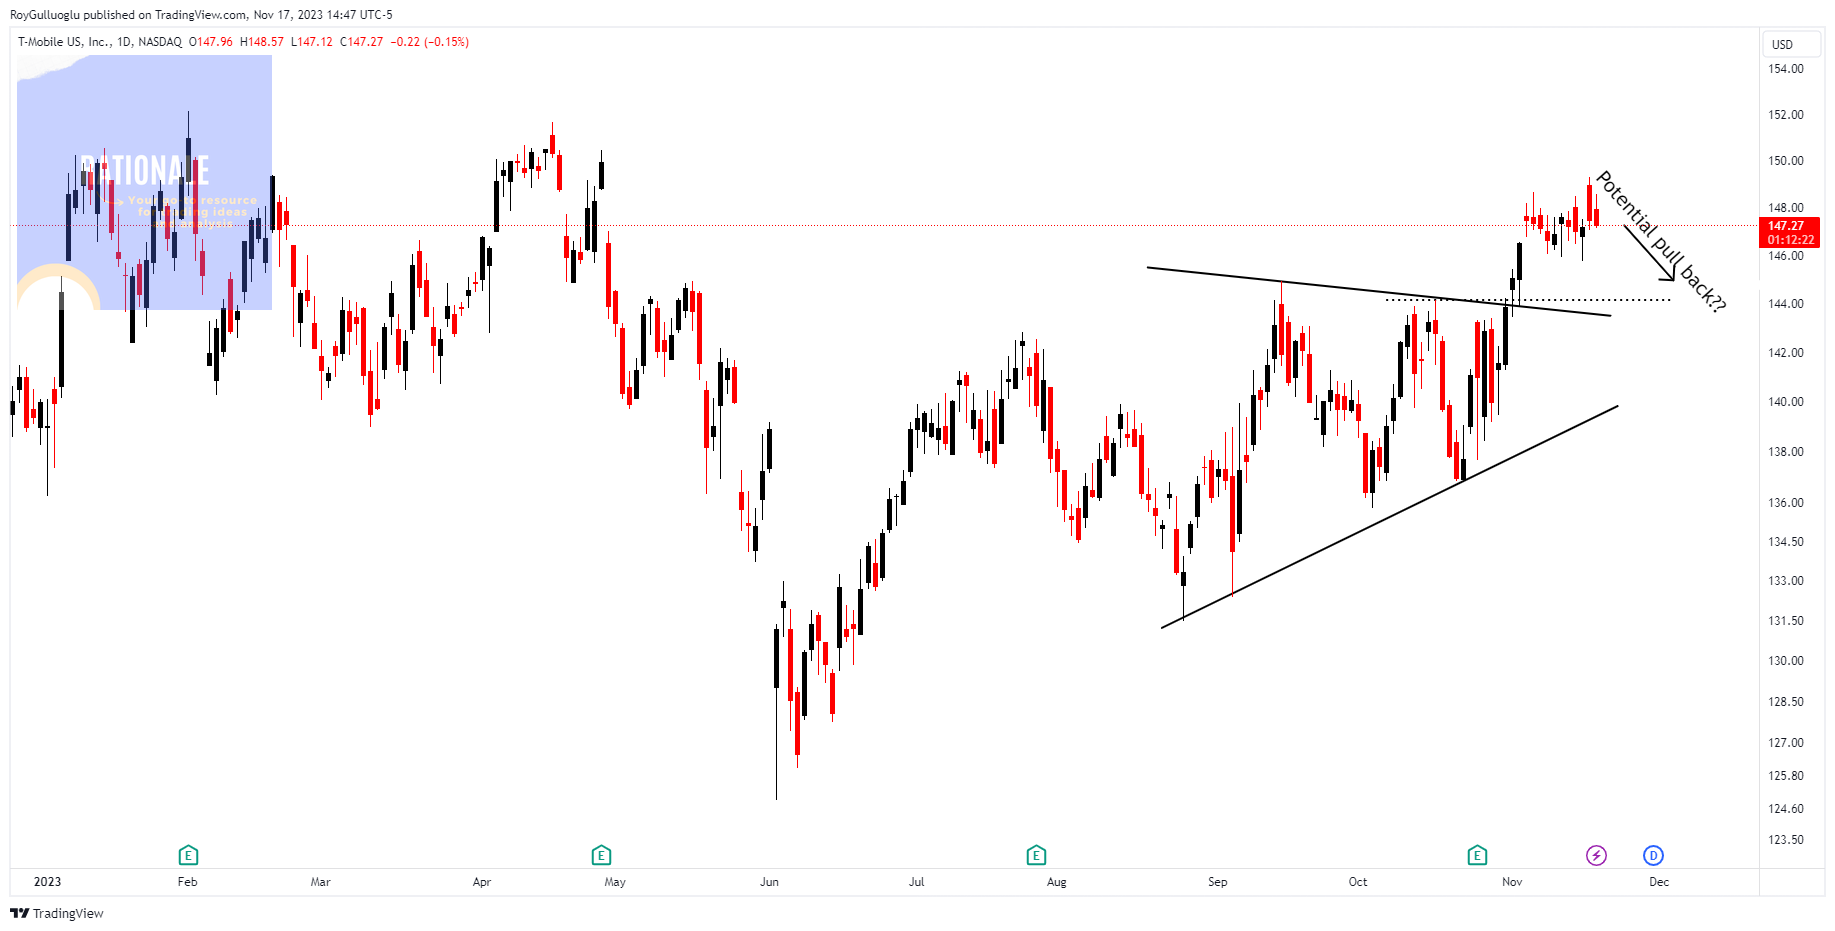
Alternatively, it could be positioned in a potential pullback toward the 144.15 levels(dotted line) in the daily graph.

TMUS, classified under the "communication services" sector, falls under the “Large Cap - Growth” stock category.
Centene Corporation-(CNC/NYSE)-Long Idea
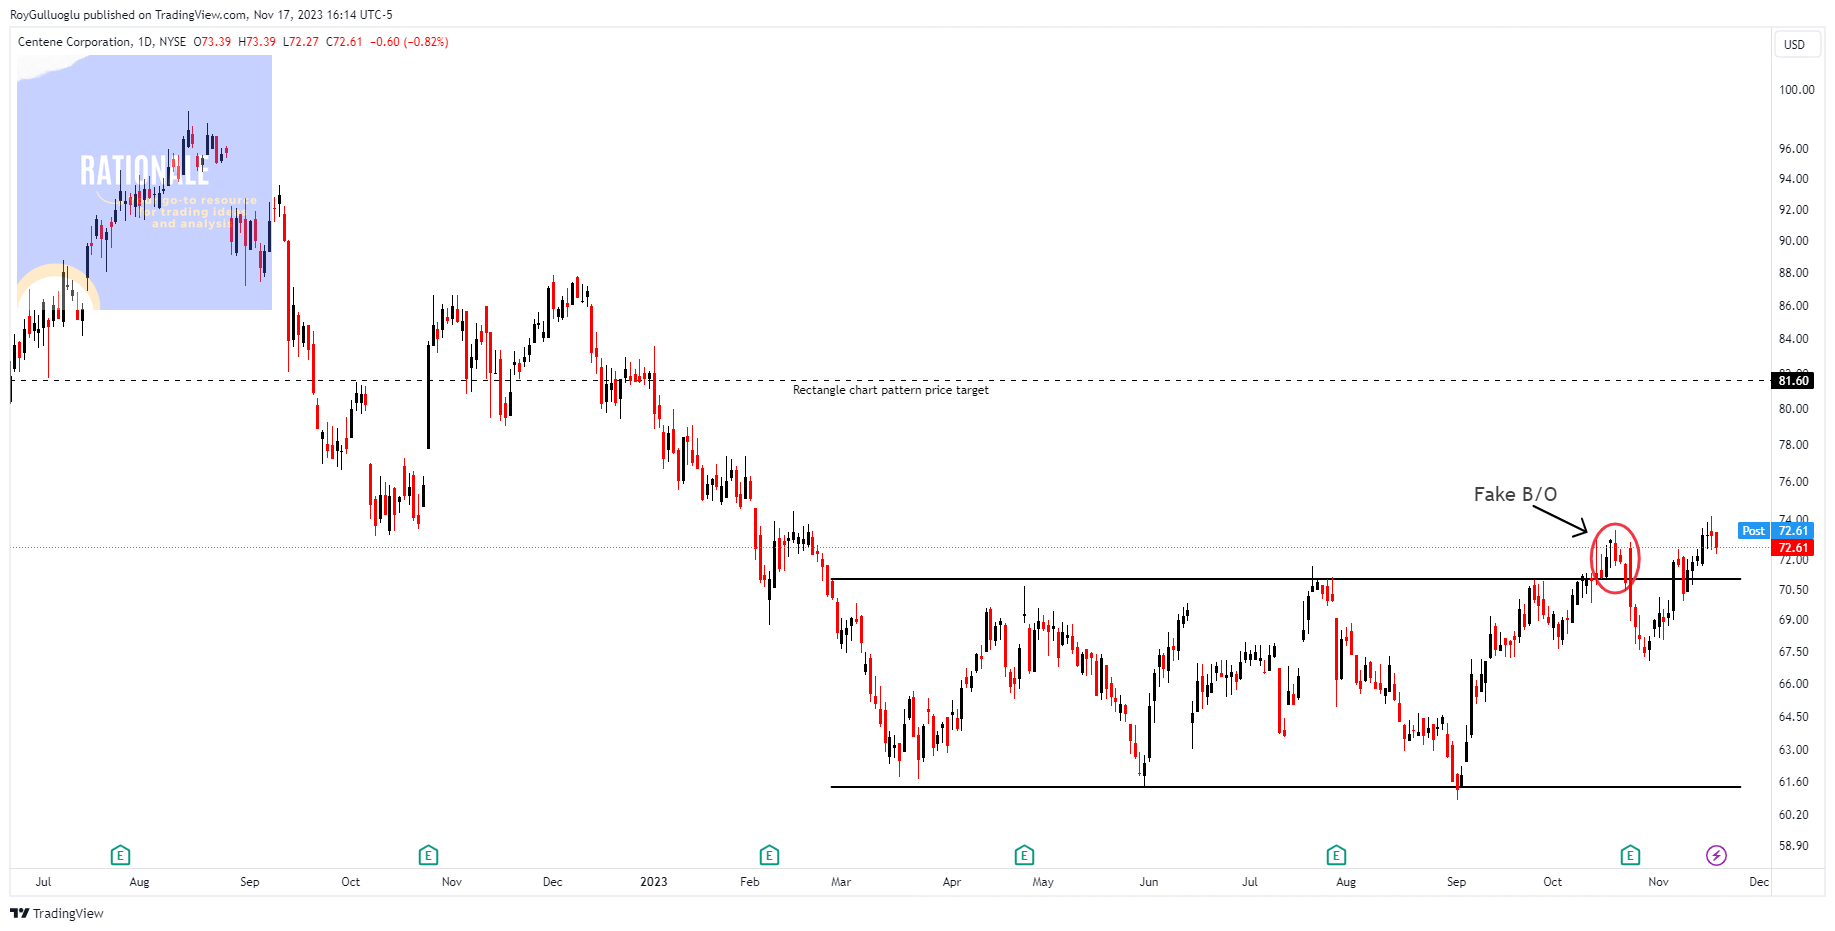
Centene Corporation functions as a healthcare enterprise offering programs and services to underinsured and uninsured families, commercial organizations, and military families in the United States. The company operates through two segments: Managed Care and Specialty Services.
The above daily chart formed an approximately 5-month-long rectangle chart pattern as a bullish reversal after a downtrend.
Within this pattern, the horizontal boundary at 71 levels acted as strong resistance.
A daily close above 73.15 levels validated the breakout from the -month-long rectangle chart pattern.
Based on this chart pattern, the potential price target is 81.6 levels.
CNC, classified under the "healthcare" sector, falls under the “Large Cap - Value” stock category.
Multiple quarters of EPS, and revenue acceleration YoY in Quarterly Earnings is another strength of the stock.
Rapid7 ,Inc-(RPD/NYSE)-Long Idea
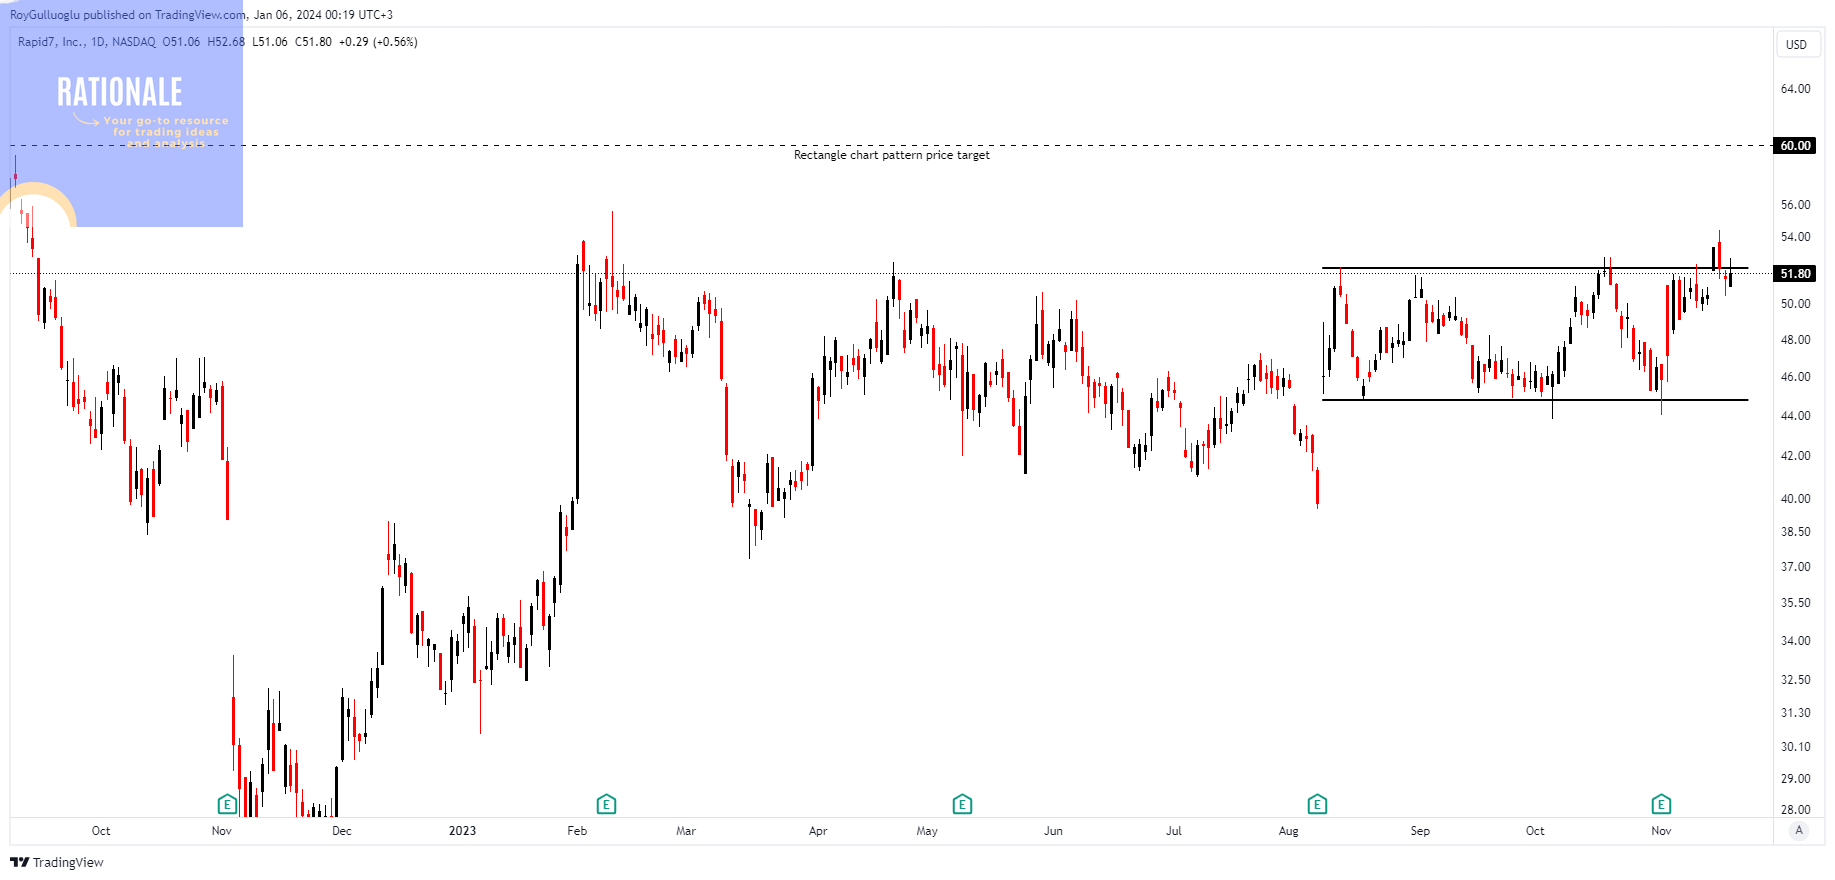
Rapid7, Inc. delivers cybersecurity solutions, providing a cloud-native insight platform for customers to establish and oversee analytics-driven cybersecurity risk management programs.
The above daily chart formed an approximately 2.5-month-long rectangle chart pattern as a bullish continuation after an uptrend.
Within this pattern, the horizontal boundary at 52.1 levels acts as strong resistance.
A daily close above 53.6 levels validated the breakout from the 2.5-month-long rectangle chart pattern.
Based on this chart pattern, the potential price target is 60 levels.
RPD, classified under the "technology" sector, falls under the “Mid Cap - Growth” stock category.
Multiple quarters of EPS, and revenue acceleration YoY in Quarterly Earnings is another strength of the stock.
Samsara, Inc-(IOT/NYSE)-Long Idea
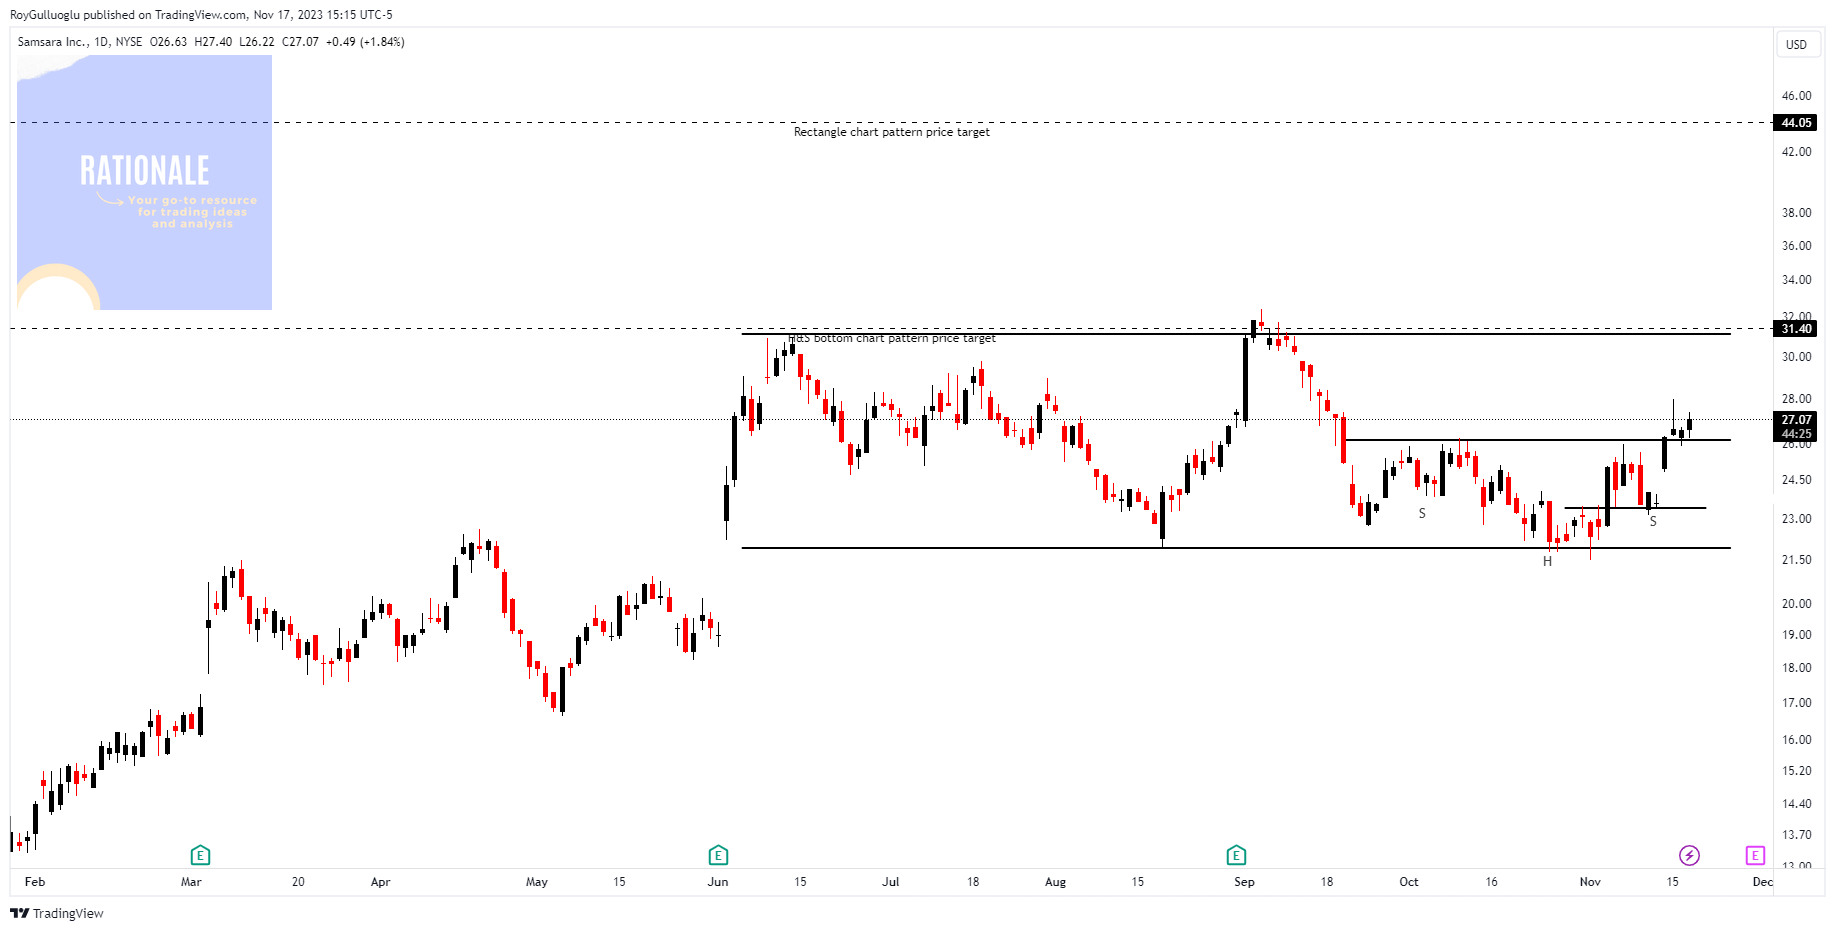
Samsara Inc. links physical operations data to its Connected Operations Cloud globally. The Cloud encompasses a Data Platform that processes data from IoT devices, integrating AI, workflows, analytics, alerts, API connections, and data security. It also features applications for video-based safety, vehicle telematics, driver workflows, equipment monitoring, and site visibility.
The above daily chart formed an approximately month-long H&S bottom chart pattern as a bullish reversal after a short-term downtrend and potentially forming a 4-month-long rectangle chart pattern as a bullish continuation after an uptrend.
Within this pattern, the horizontal boundary at 26.14 levels acted as strong resistance and a daily close above 26.9 levels validated the breakout from the month-long H&S bottom chart pattern. Based on this chart pattern, the potential price target is 31.4 levels.
Also, within this pattern, the horizontal boundary at 31 levels might act as a resistance if the rectangle chart pattern is formed. A daily close above 31.9 levels would validate the breakout from the 4-month-long rectangle chart pattern. Based on this chart pattern, the potential price target is 44 levels.
IOT, classified under the "technology" sector, falls under the “Large Cap - Growth” stock category.
Amphenol Corporation-(APH/NYSE)-Long Idea
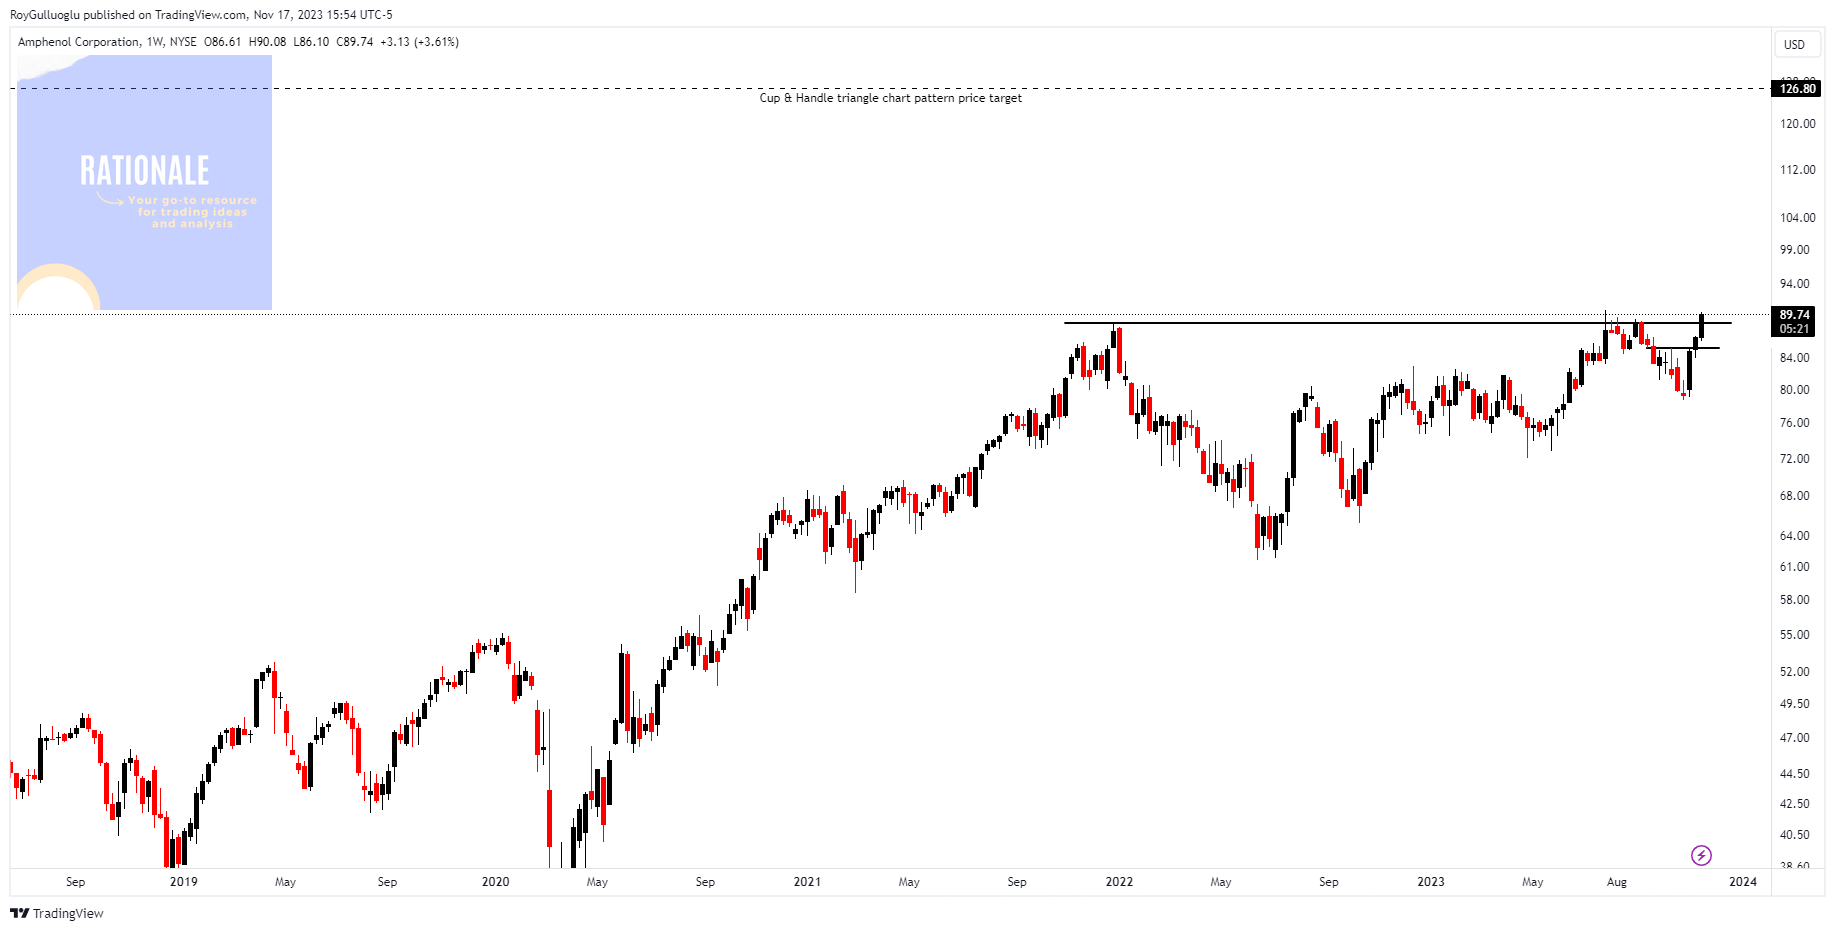
Amphenol Corporation, along with its subsidiaries, is principally engaged in the design, manufacturing, and global marketing of electrical, electronic, and fiber optic connectors, with a focus on the United States and China.
The above daily weekly chart formed an approximately 25-month-long cup & handle chart pattern as a bullish continuation after an uptrend.
Within this pattern, the horizontal boundary at 88.5 levels acts as strong resistance.
A daily close above 91.5 levels would validate the breakout from the 25-month-long cup & handle chart pattern.
Based on this chart pattern, the potential price target is 126.8 levels.
APH, classified under the "technology" sector, falls under the “Large Cap - Growth” stock category.
Western Digital Corporation-(WDC/NYSE)-Long Idea
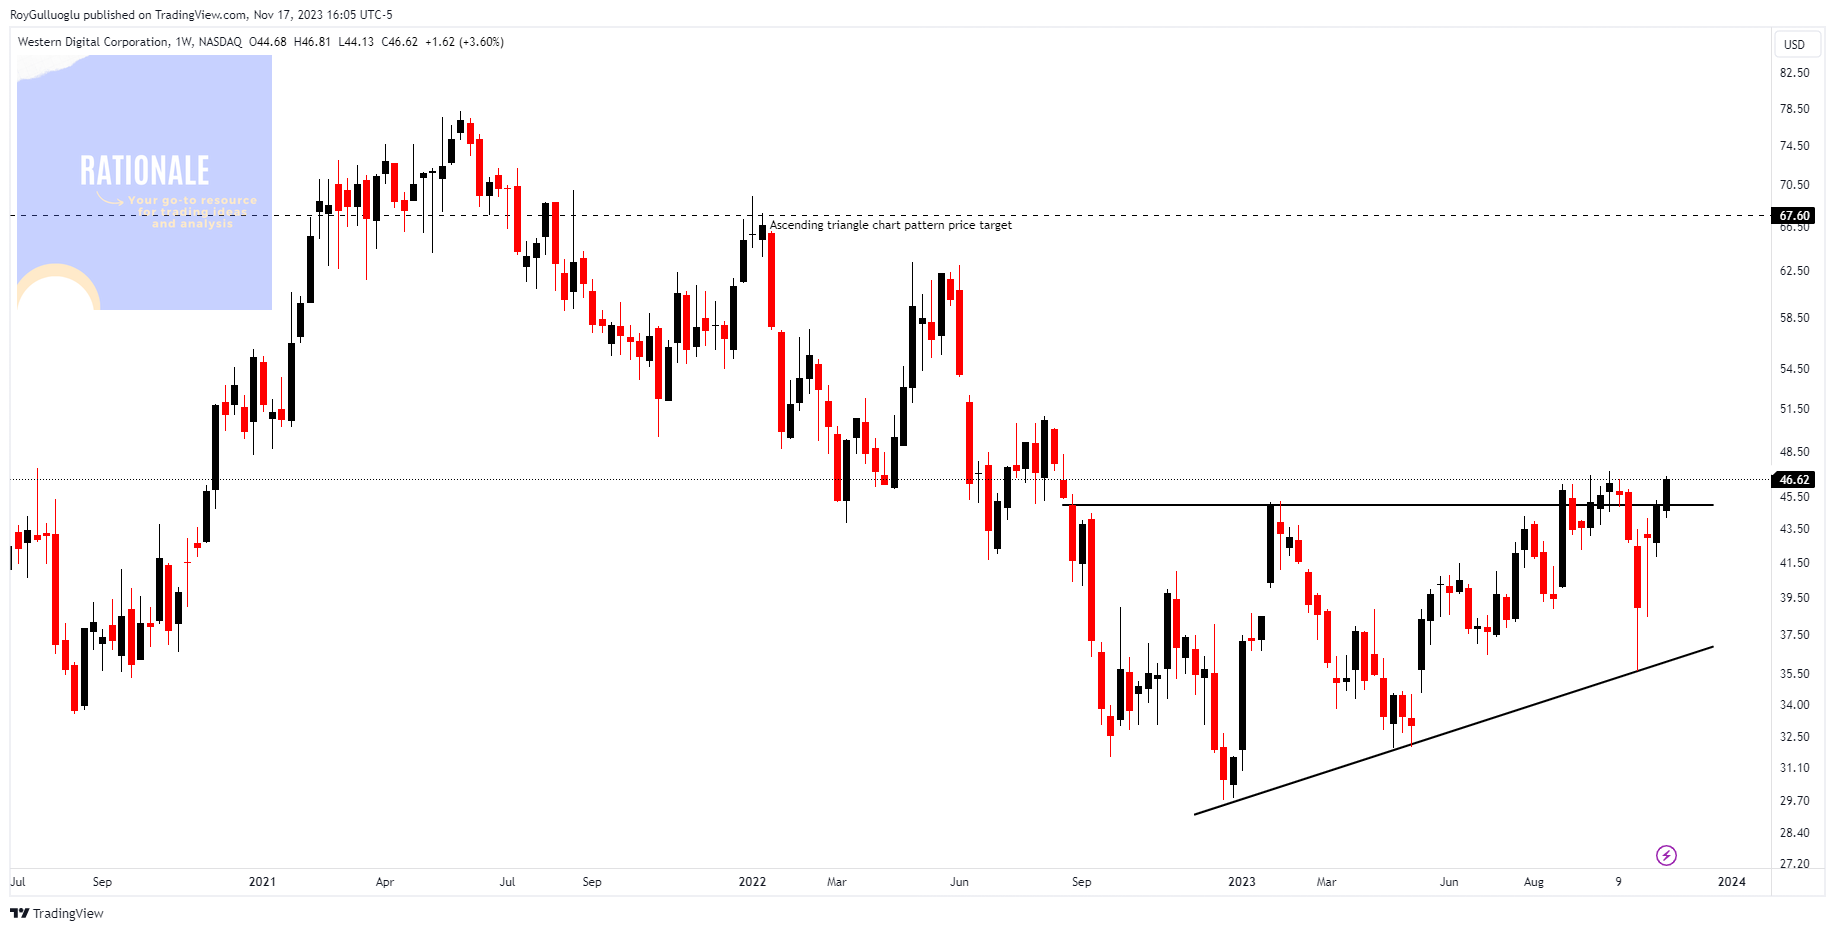
Western Digital Corporation designs, manufactures, and sells data storage devices globally, providing hard disk drives (HDDs) and solid-state drives (SSDs) for various applications, including desktop and notebook PCs, gaming consoles, and set-top boxes. The company operates in multiple regions, including the United States, China, Hong Kong, Europe, the Middle East, Africa, and Asia.
The above daily weekly chart formed an approximately 10-month-long ascending triangle chart pattern as a bullish reversal after a downtrend.
Within this pattern, the horizontal boundary at 45 levels acts as strong resistance.
A daily close above 46.35 levels validated the breakout from the 10-month-long ascending triangle chart pattern.
Based on this chart pattern, the potential price target is 67.6 levels.
WDC, classified under the "technology" sector, falls under the “Large Cap - Growth” stock category.
MINISO Group Holding Limited-(MNSO/NYSE)-Long Idea
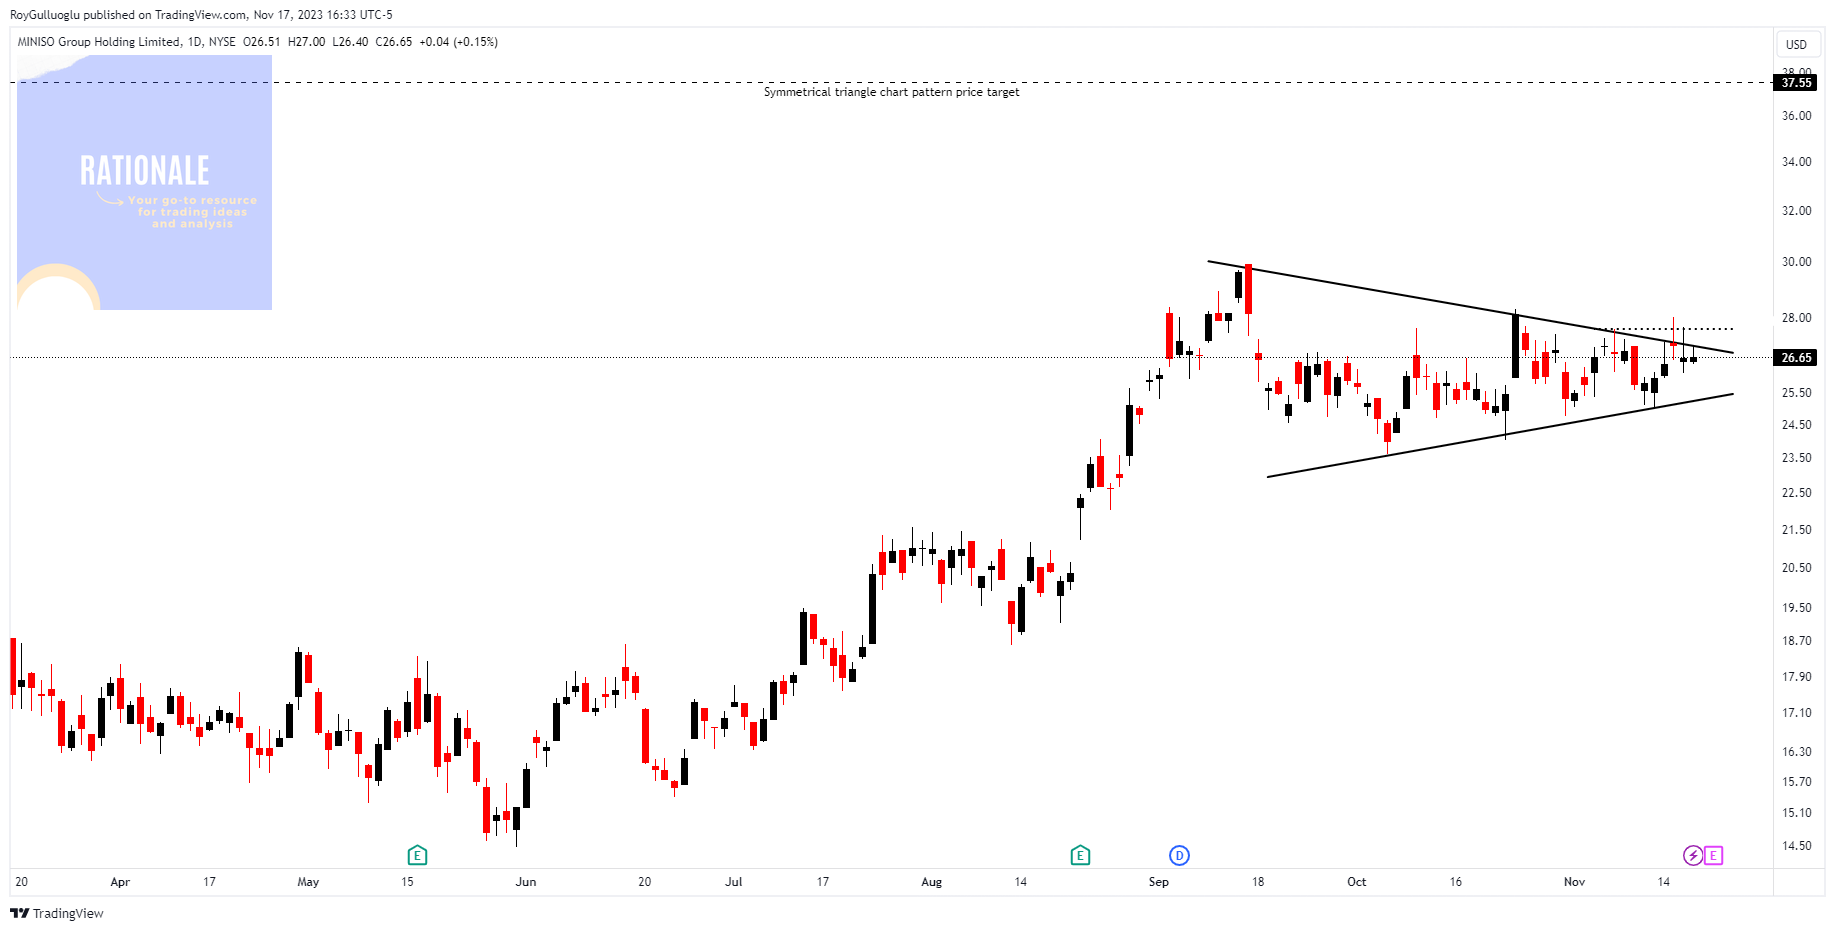
MINISO Group Holding Limited, as an investment holding company, participates in the retail and wholesale distribution of lifestyle products and pop toy items across China, Asia, the United States, and Europe. The company's diverse product range spans home decor, small electronics, textiles, accessories, beauty tools, toys, cosmetics, and personal care products.
The above daily chart formed an approximately 1.5-month-long symmetrical triangle chart pattern as a bullish continuation after an uptrend.
Within this pattern, a daily close above 27.6 levels would validate the breakout from the 1.5-month-long rectangle chart pattern.
Based on this chart pattern, the potential price target is 37.55 levels.
MNSO, classified under the "consumer cyclical" sector, falls under the “Mid Cap - Growth” stock category.
Follow-ups
The Ensign Group-(ENSG/NASDAQ)-Long Idea
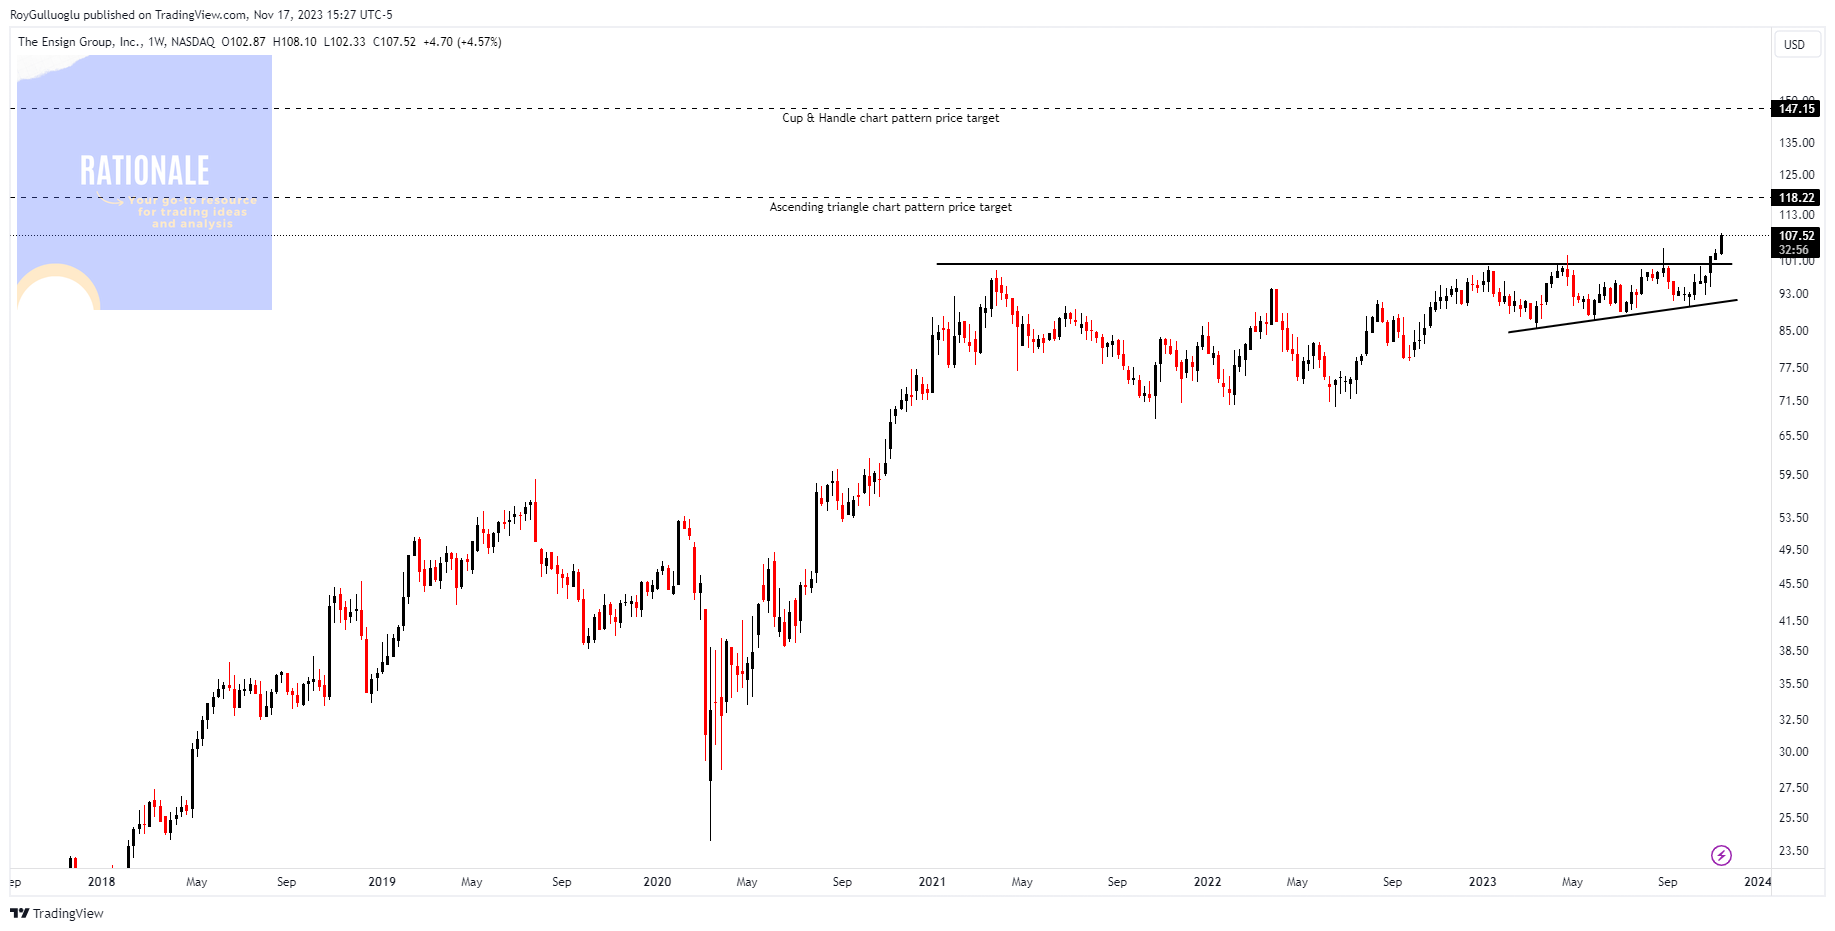
You can click the ENSG ticker above to access the first report explaining the RATIONALE behind the trade idea.
Copart Inc-(CPRT/NASDAQ)-Long Idea
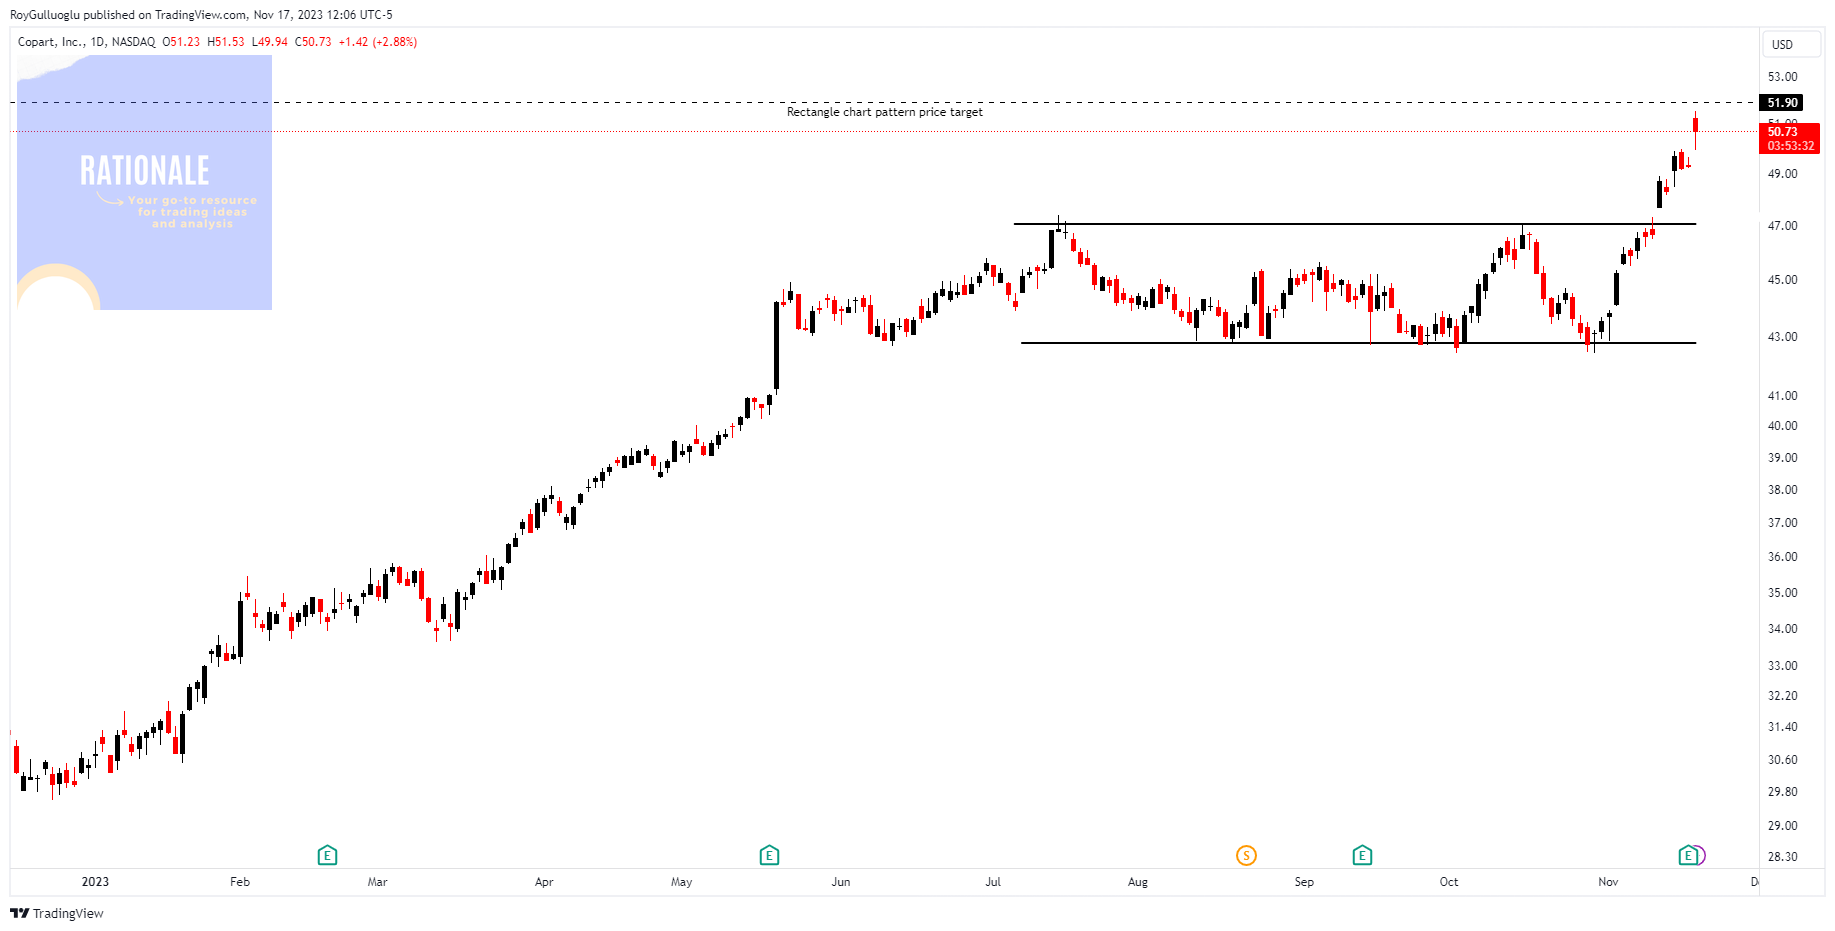
You can click the CPRT ticker above to access the first report explaining the RATIONALE behind the trade idea.
ServiceNow Inc-(NOW/NYSE)-Long Idea
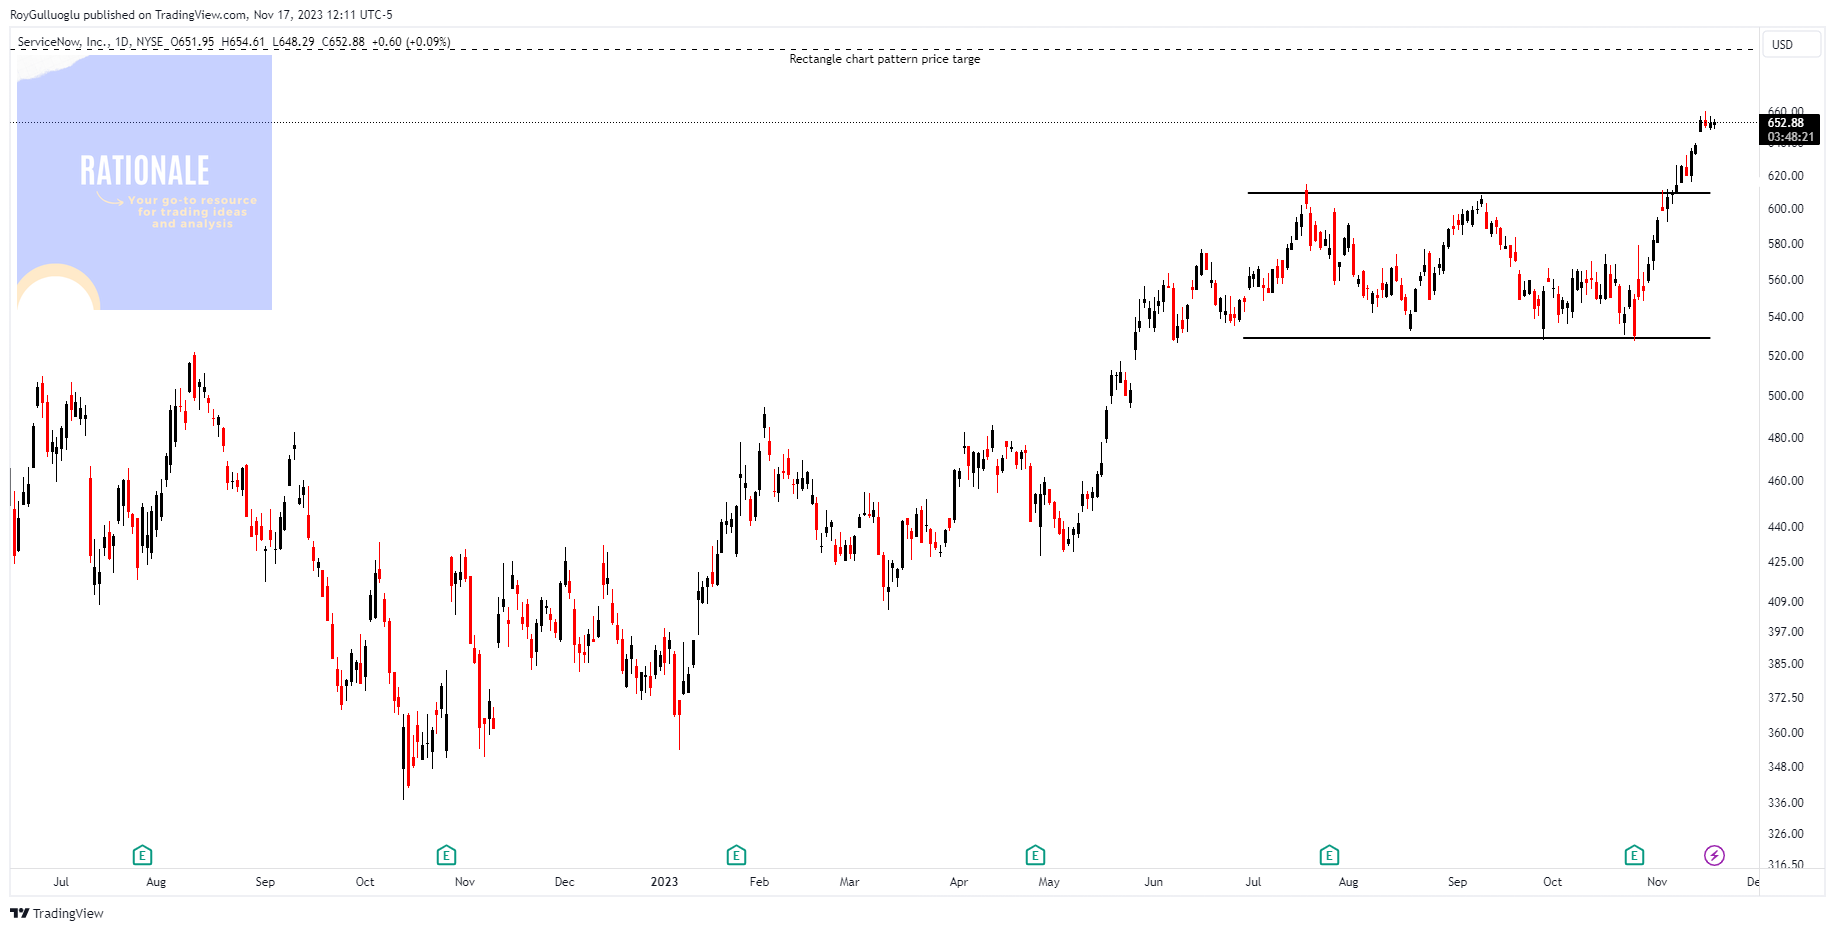
You can click the NOW ticker above to access the first report explaining the RATIONALE behind the trade idea.
Ross Stores Inc.-(ROST/NASDAQ)-Long Idea
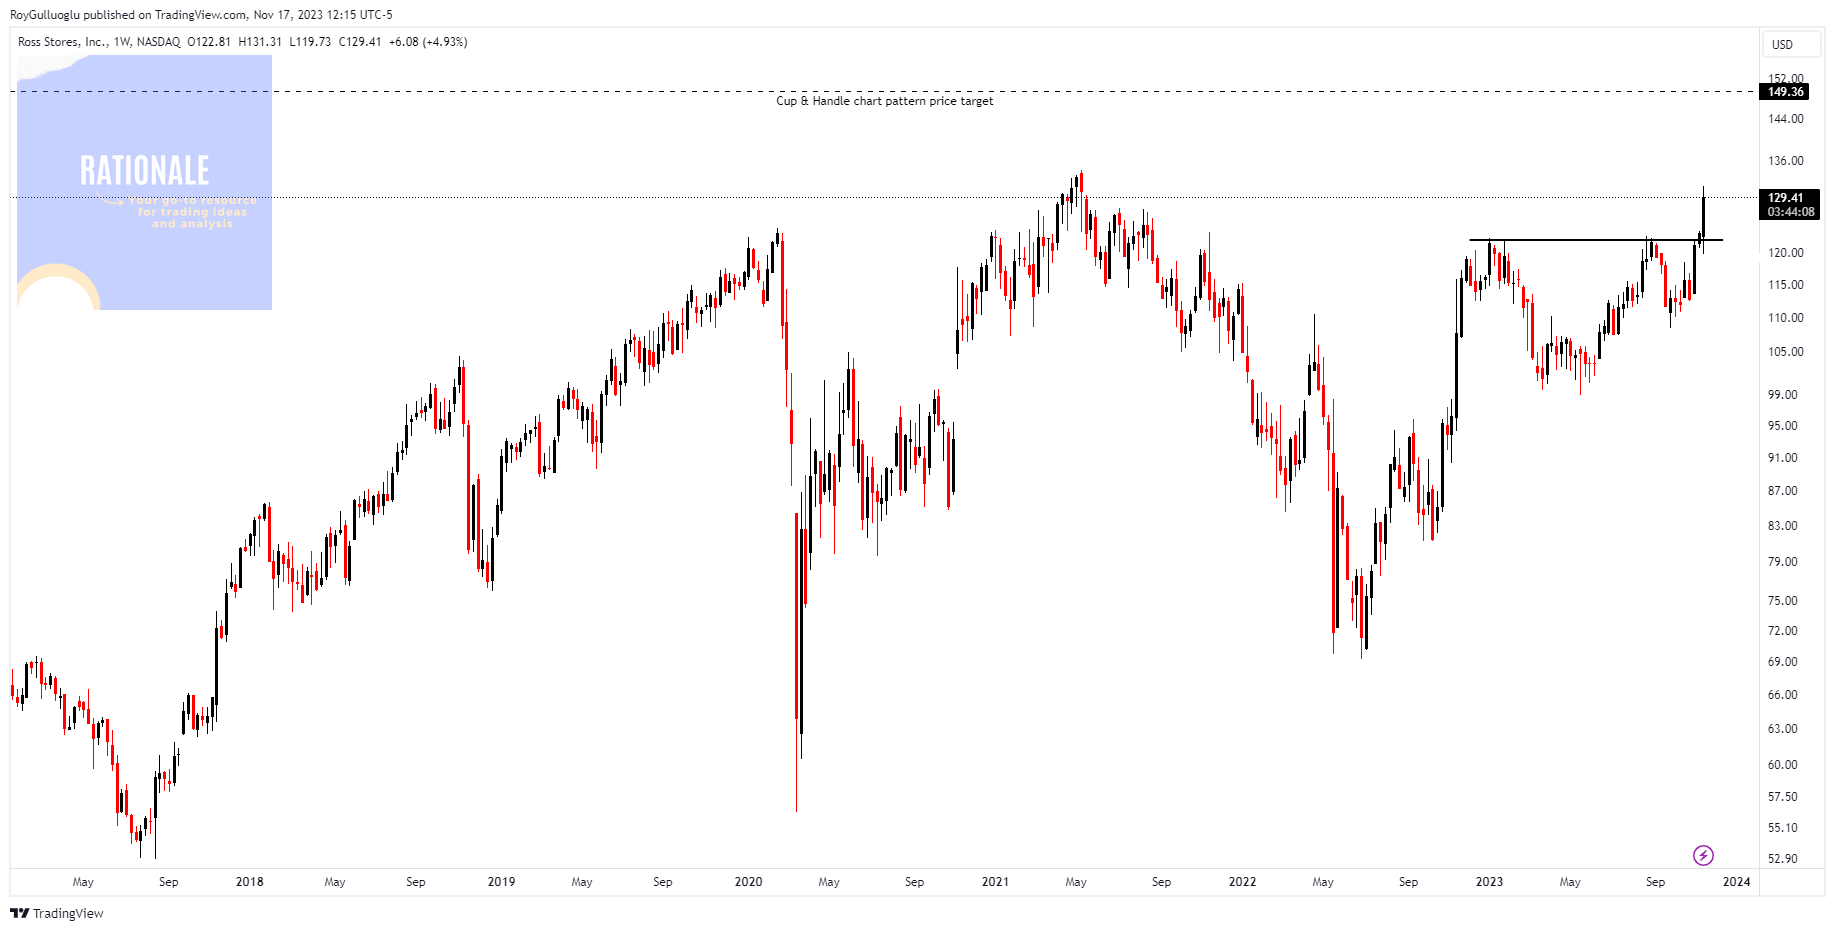
You can click the ROST ticker above to access the first report explaining the RATIONALE behind the trade idea.
Hilton Worldwide Holdings-(HLT/NYSE)-Long/Short Idea
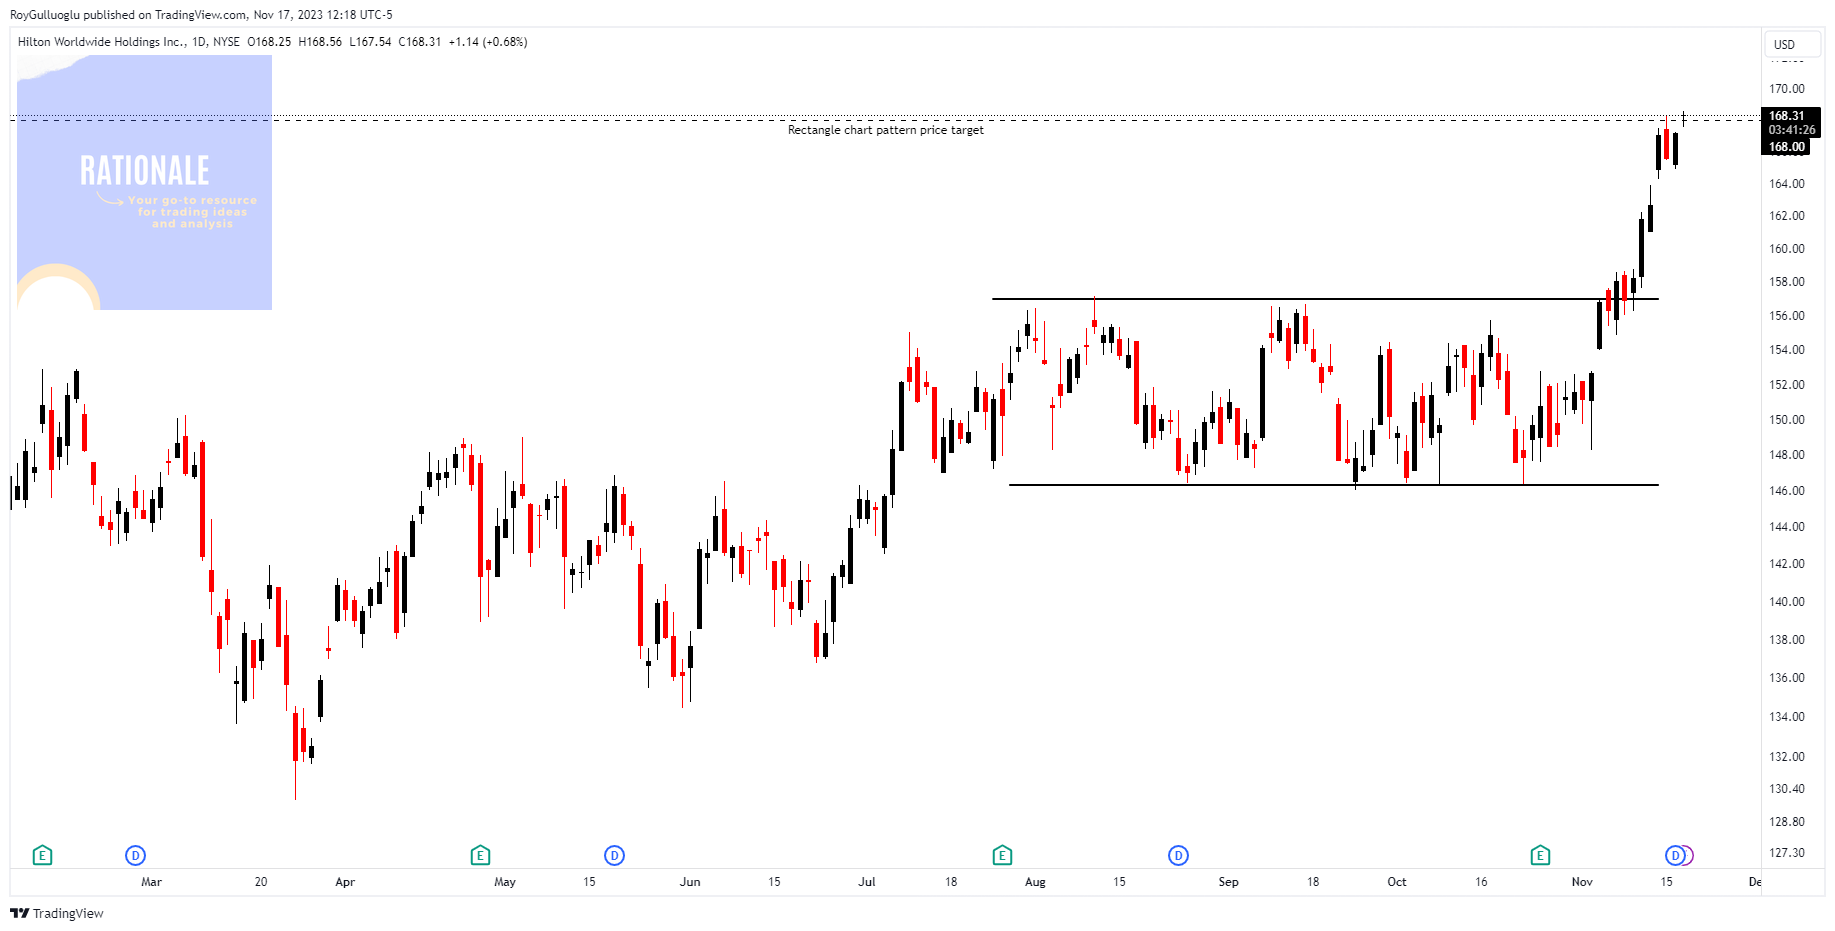
You can click the HLT ticker above to access the first report explaining the RATIONALE behind the trade idea.
The rectangle price target is reached.
Motorola Solutions Inc-(MSI/NYSE)-Long Idea
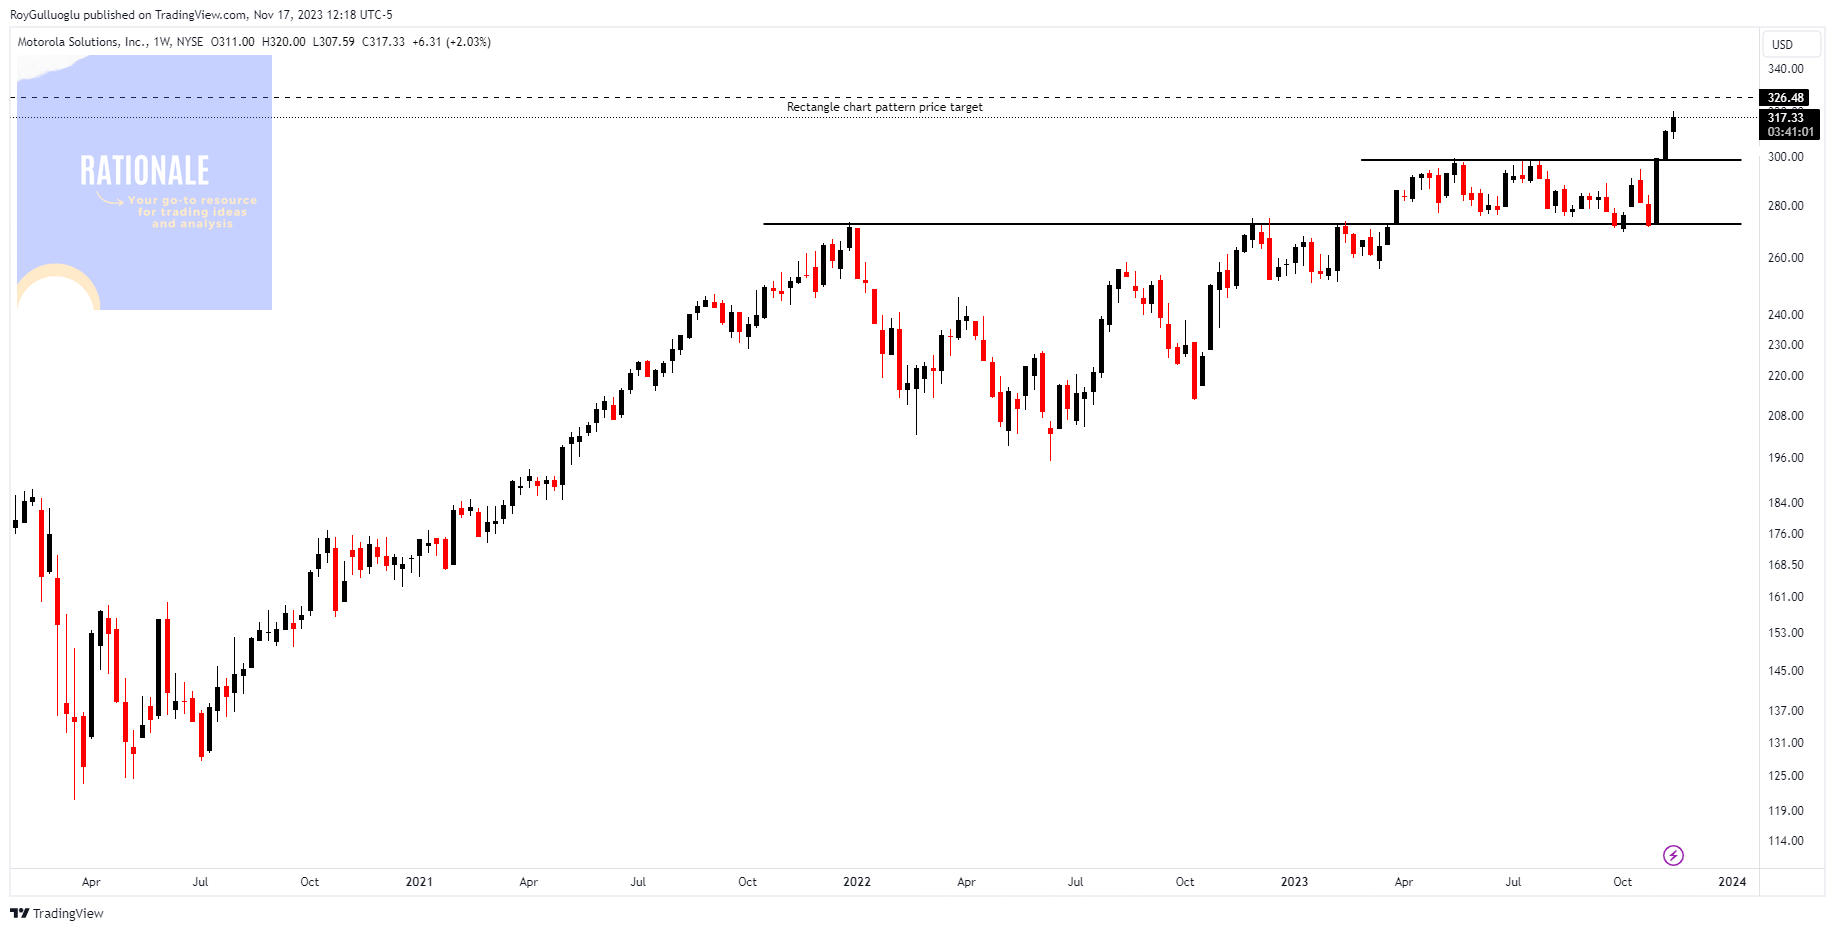
You can click the MSI ticker above to access the first report explaining the RATIONALE behind the trade idea.
Empire Co Ltd-(EMP.A/TSX) - Long Idea
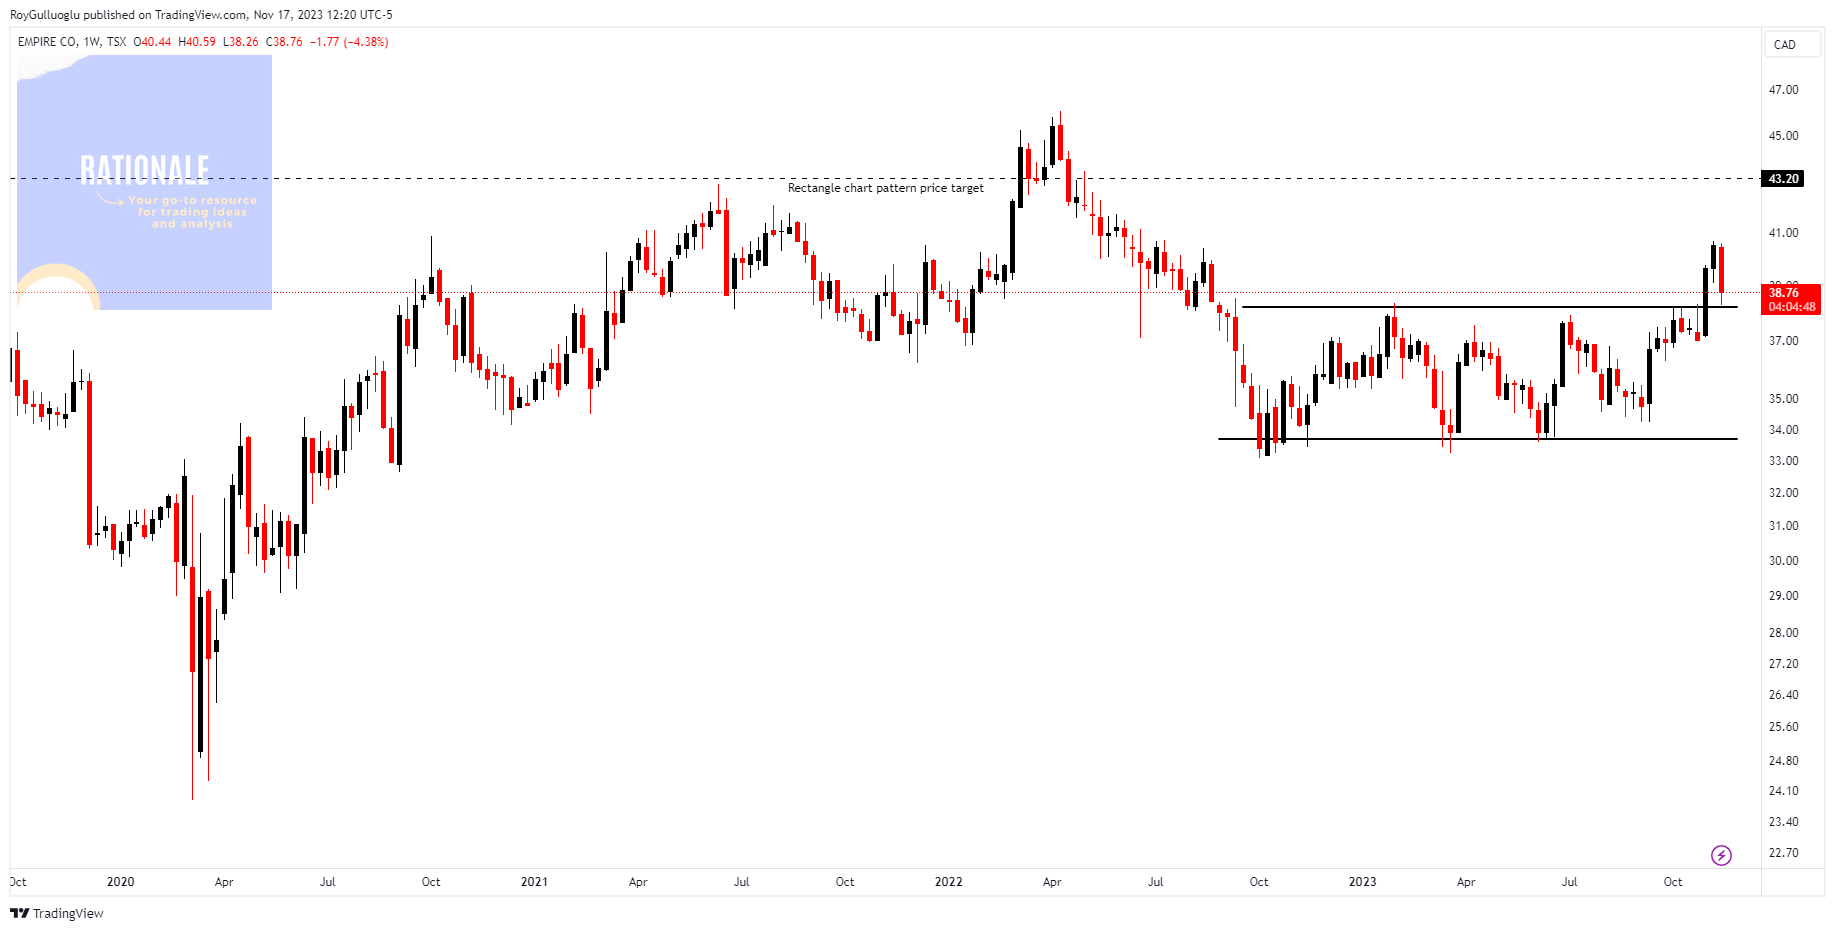
You can click the EMP. A ticker above to access the first report explaining the RATIONALE behind the trade idea.
The price pulled back to the old resistance and new support level.
thank you so much.