


MSCI Inc.-(MSCI/NYSE)-Long Idea
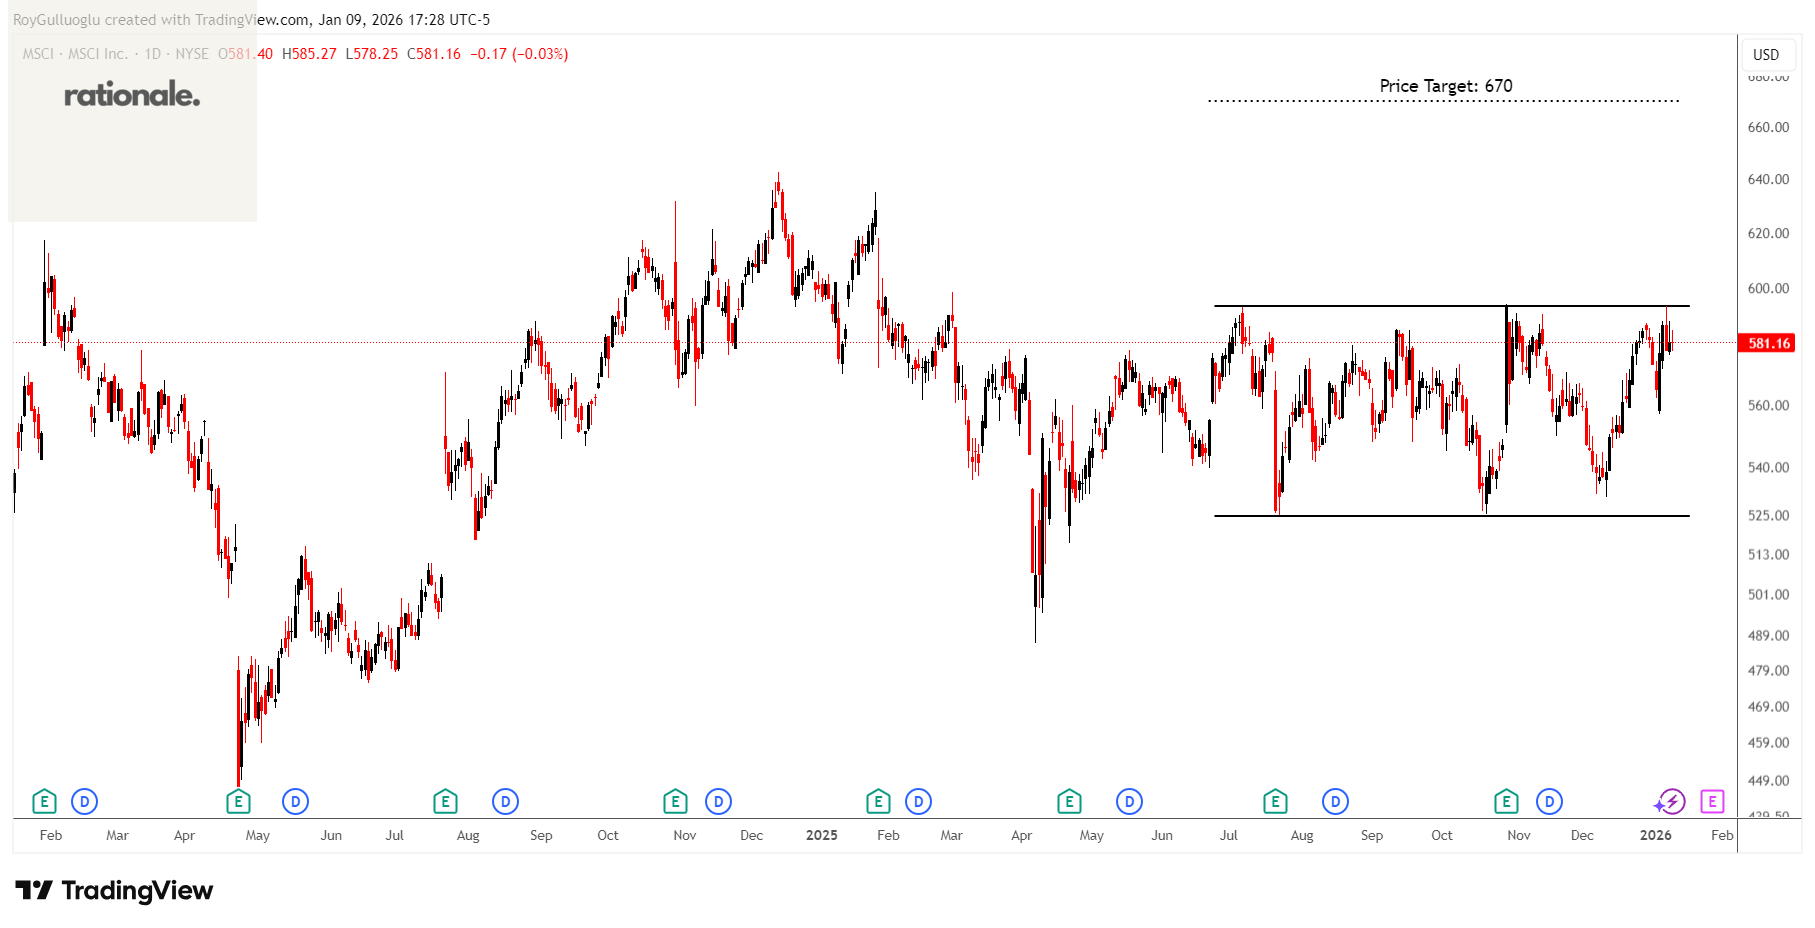
MSCI Inc., together with its subsidiaries, provides critical decision support tools and solutions for the investment community to manage investment processes worldwide.
The above daily chart formed an approximately 5-month-long rectangle chart pattern as a bullish continuation after an uptrend.
The horizontal boundary at 593.78 levels acts as a support within this pattern.
A daily close above 611.59 levels would validate the breakdown from the 5-month-long rectangle chart pattern.
Based on this chart pattern, the potential price target is 670 levels.
CRA International, Inc.-(CRAI/NASDAQ)-Long Idea
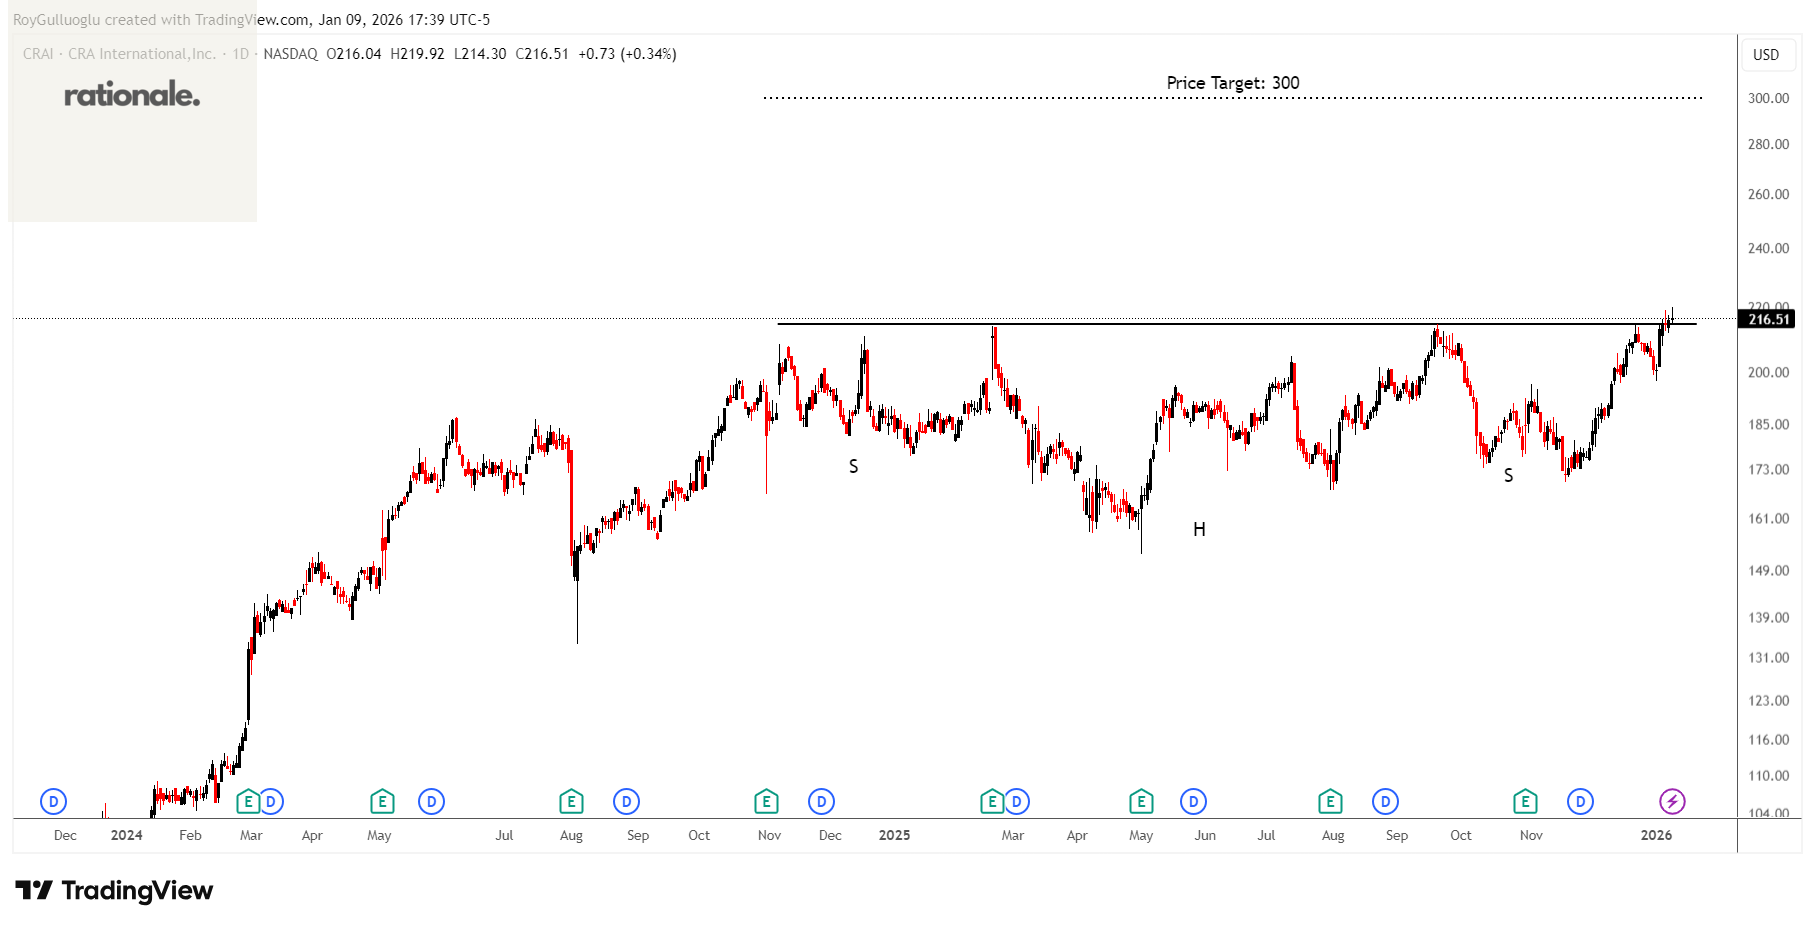
CRA International, Inc., together with its subsidiaries, provides economic, financial, and management consulting services worldwide.
The above daily chart formed an approximately 9-month-long H&S continuation chart pattern as a bullish contuniation after an uptrend.
The horizontal boundary at 214.66 levels acts as a resistance within this pattern.
A daily close above 221 levels would validate the breakout from the 9-month-long H&S continuation chart pattern.
Based on this chart pattern, the potential price target is 300 levels.
Alerus Financial Corporation-(ALRS/NASDAQ)-Long Idea
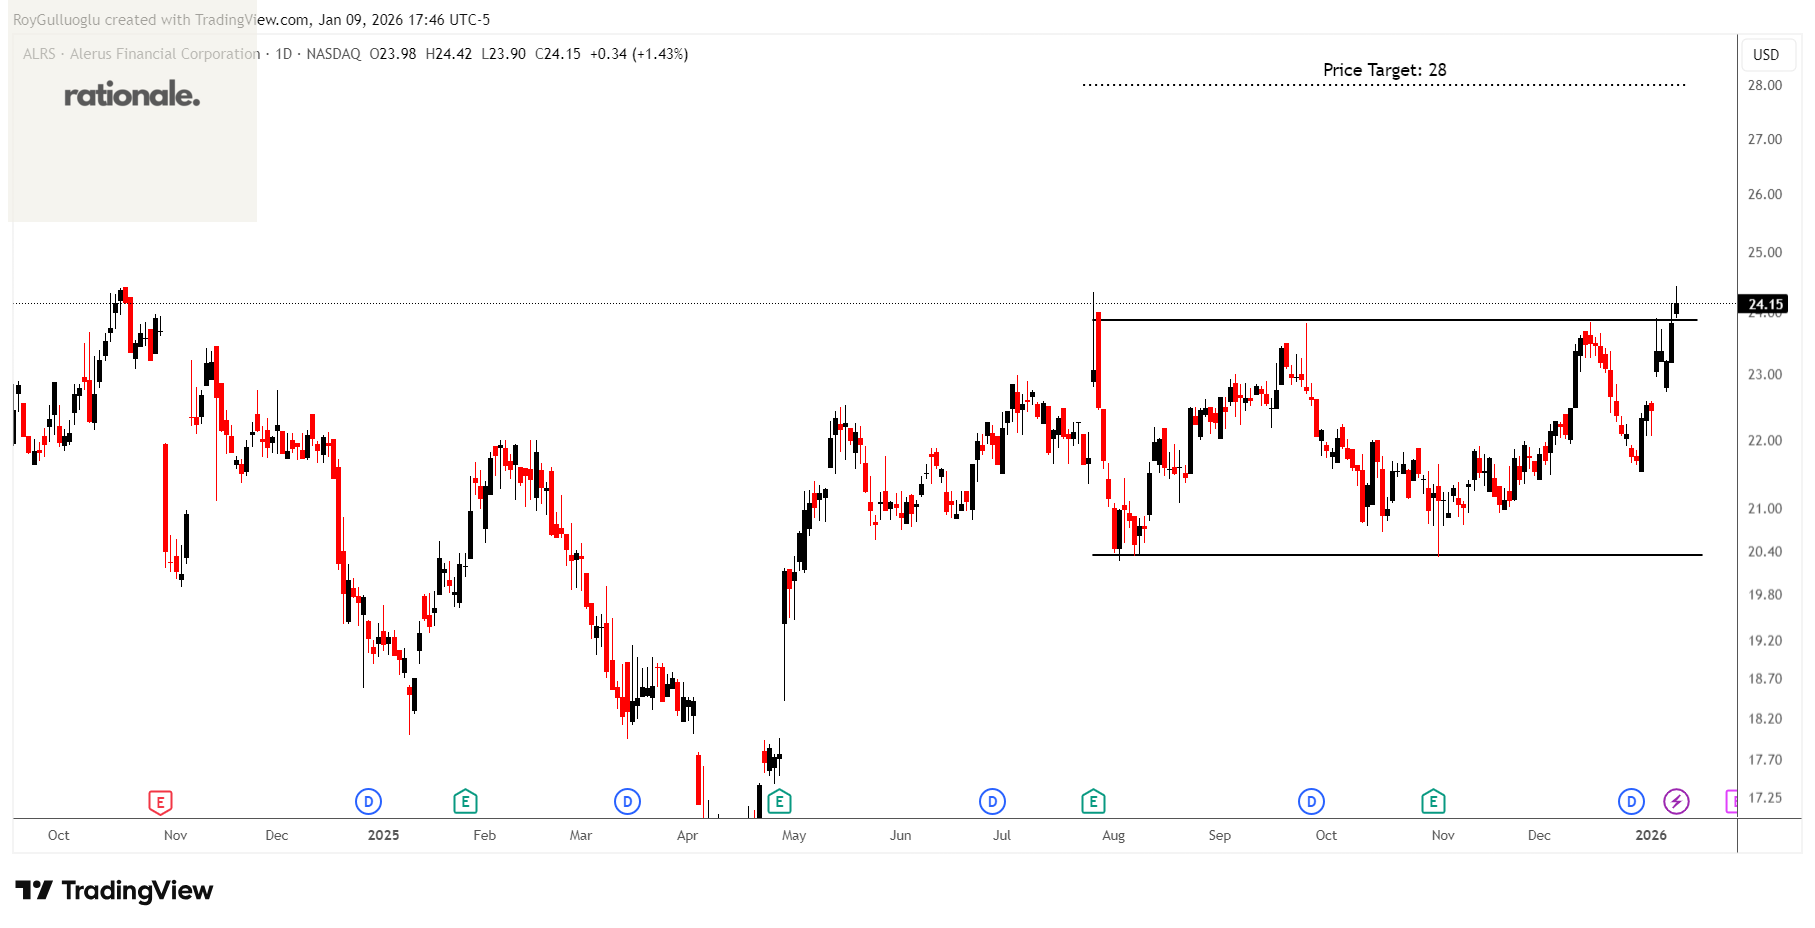
Alerus Financial Corporation operates as the bank holding company for Alerus Financial, National Association that provides various financial services to businesses and consumers in the United States
The above daily chart formed an approximately 4-month-long rectangle chart pattern as a bullish continuation after an uptrend.
The horizontal boundary at 23.86 levels acts as a resistance within this pattern.
A daily close above 24.5 levels would validate the breakout from the 4-month-long rectangle chart pattern.
Based on this chart pattern, the potential price target is 28 levels.
The Walt Disney Company-(DIS/NYSE)-Long Idea
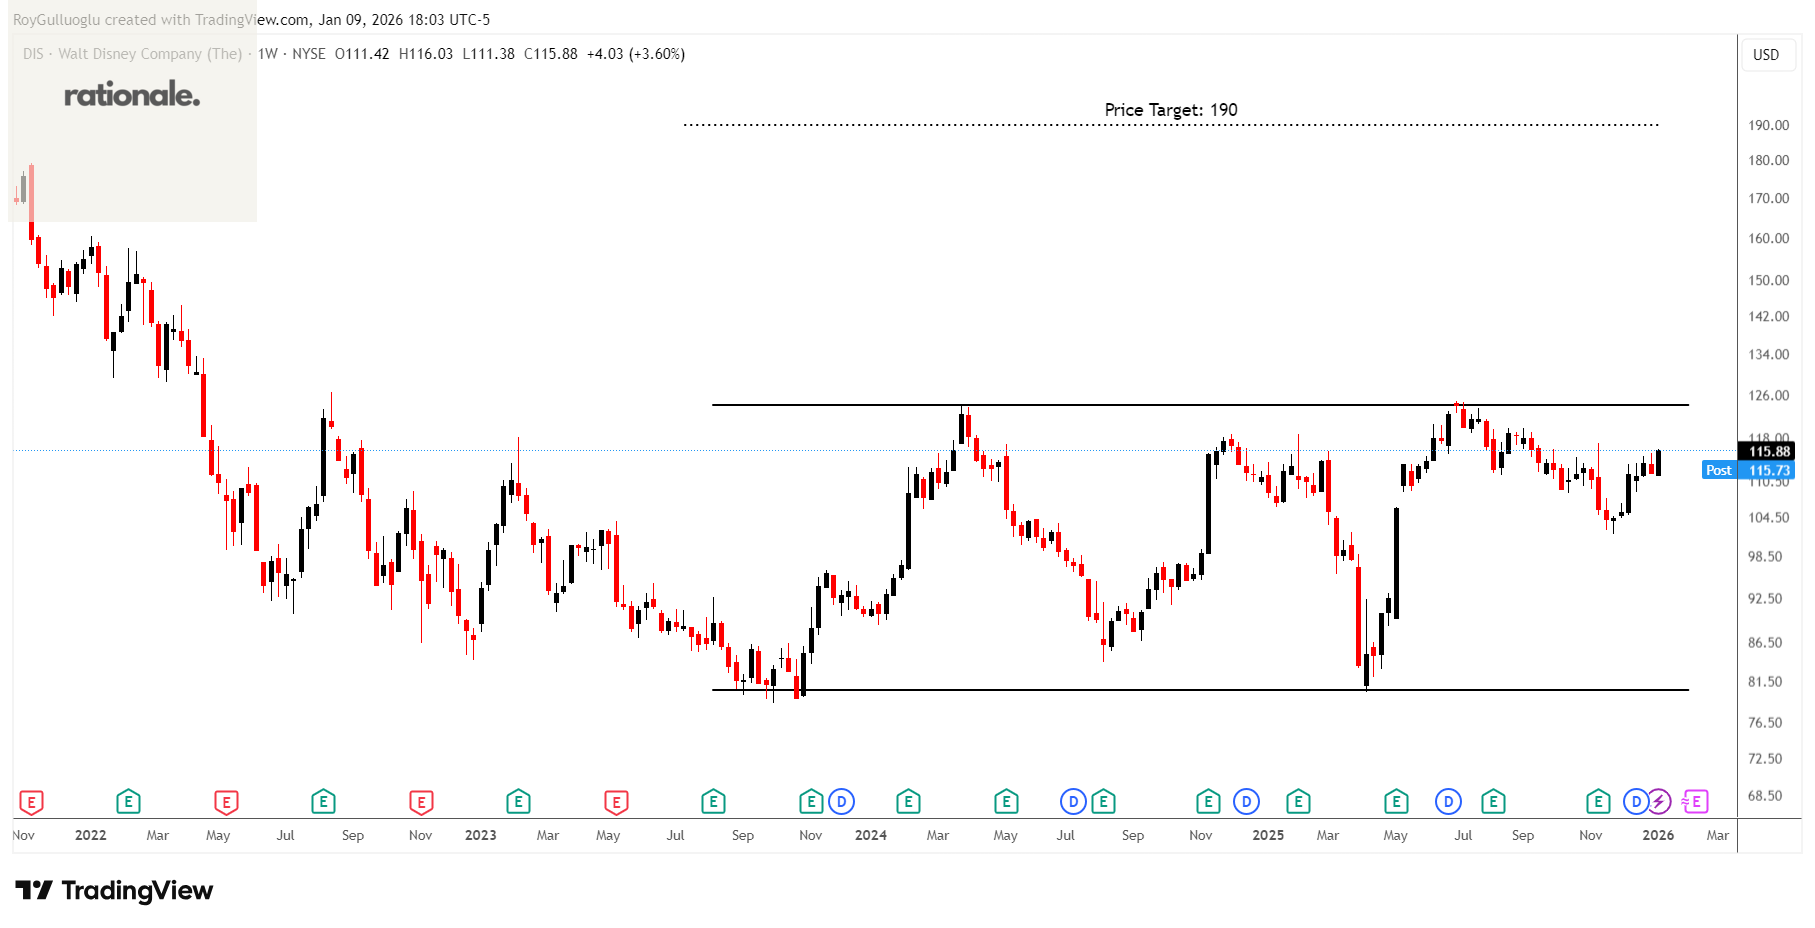
The Walt Disney Company operates as an entertainment company in Americas, Europe, and the Asia Pacific
The above weekly chart formed an approximately 30-month-long rectangle chart pattern as a bullish reversal after a downtrend.
The horizontal boundary at 124 levels acts as a resistance within this pattern.
A daily close above 127.7 levels would validate the breakout from the 30-month-long rectangle chart pattern.
Based on this chart pattern, the potential price target is 190 levels.
Solaris Energy Infrastructure, Inc.-(SEI/NYSE)-Long Idea
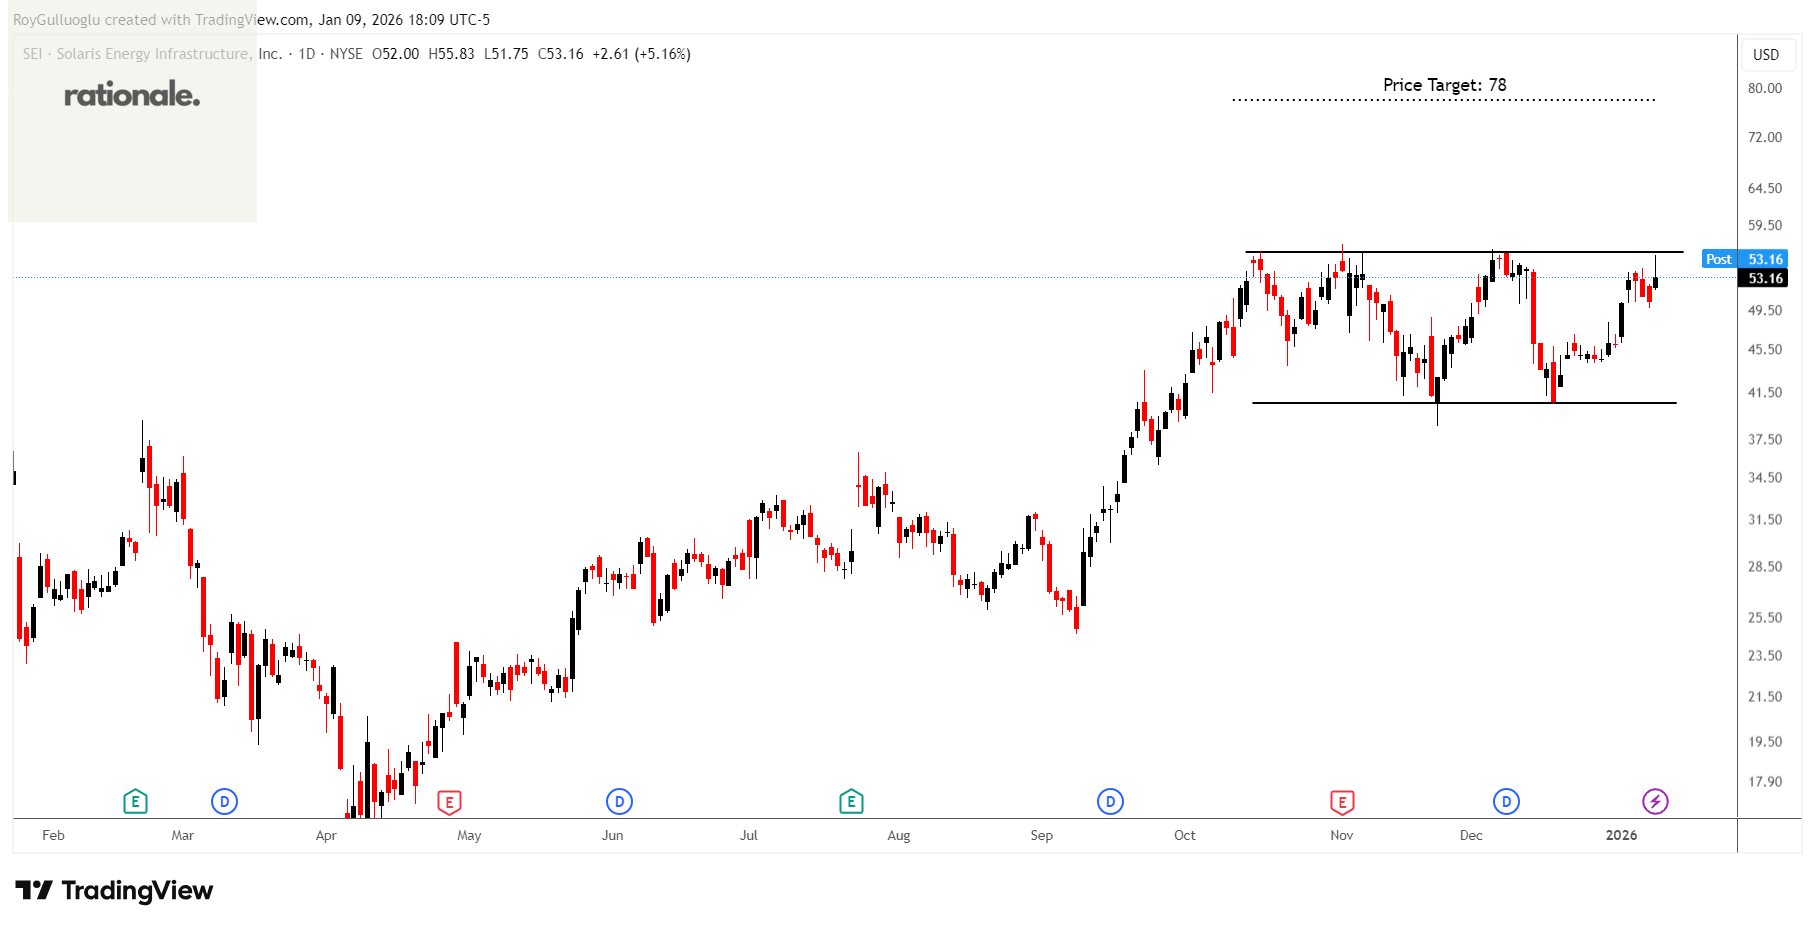
Solaris Energy Infrastructure, Inc. provides mobile and scalable equipment-based solutions for use in distributed power generation and management of raw materials used in the completion of oil and natural gas wells in the United States.
The above daily chart formed an approximately 2-month-long rectangle chart pattern as a bullish continuation after an uptrend.
The horizontal boundary at 56.14 levels acts as a resistance within this pattern.
A daily close above 57.8 levels would validate the breakout from the 2-month-long rectangle chart pattern.
Based on this chart pattern, the potential price target is 78 levels.
Teşekkürler Roy