


New setups
TICKERS: RF(NYSE), LYV(NYSE), USAC(NYSE), BNS(NYSE), LPX(NYSE), MRC(NYSE), SCR(EURONEXT), RYSAS(BIST)
Regions Financials Corporation-(RF/NYSE)-Long Idea
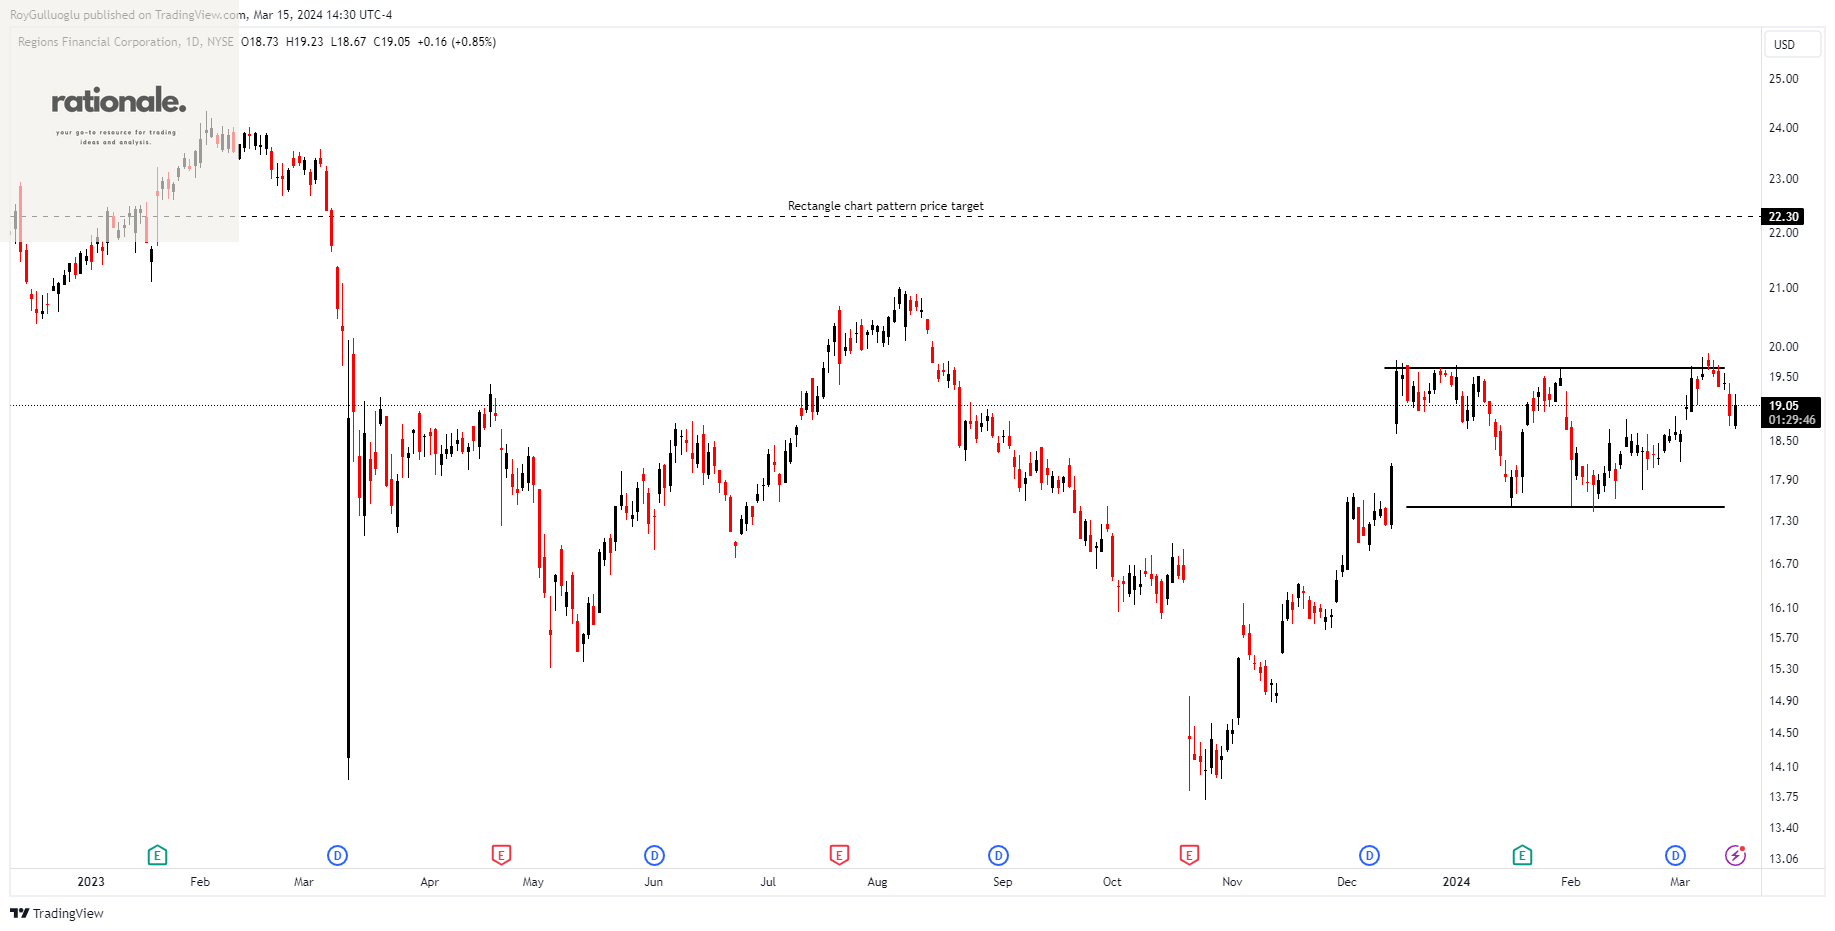
Regions Financial Corporation, a financial institution, delivers banking and bank-related offerings to both individual and corporate clientele. Its operations are organized into three main divisions: Corporate Bank, Consumer Bank, and Wealth Management.
The above daily chart formed an approximately 2-month-long rectangle chart pattern as a bullish continuation after an uptrend.
The horizontal boundary at 19.65 levels acts as a resistance within this pattern.
A daily close above 20.24 levels would validate the breakout from the 2-month-long rectangle chart pattern.
Based on this chart pattern, the potential price target is 22.3 levels.
RF, classified under the "financial services" sector, falls under the “Large Cap - Income” stock category.
Live Nation Entertainment, Inc.-(LYV/NYSE)-Long Idea
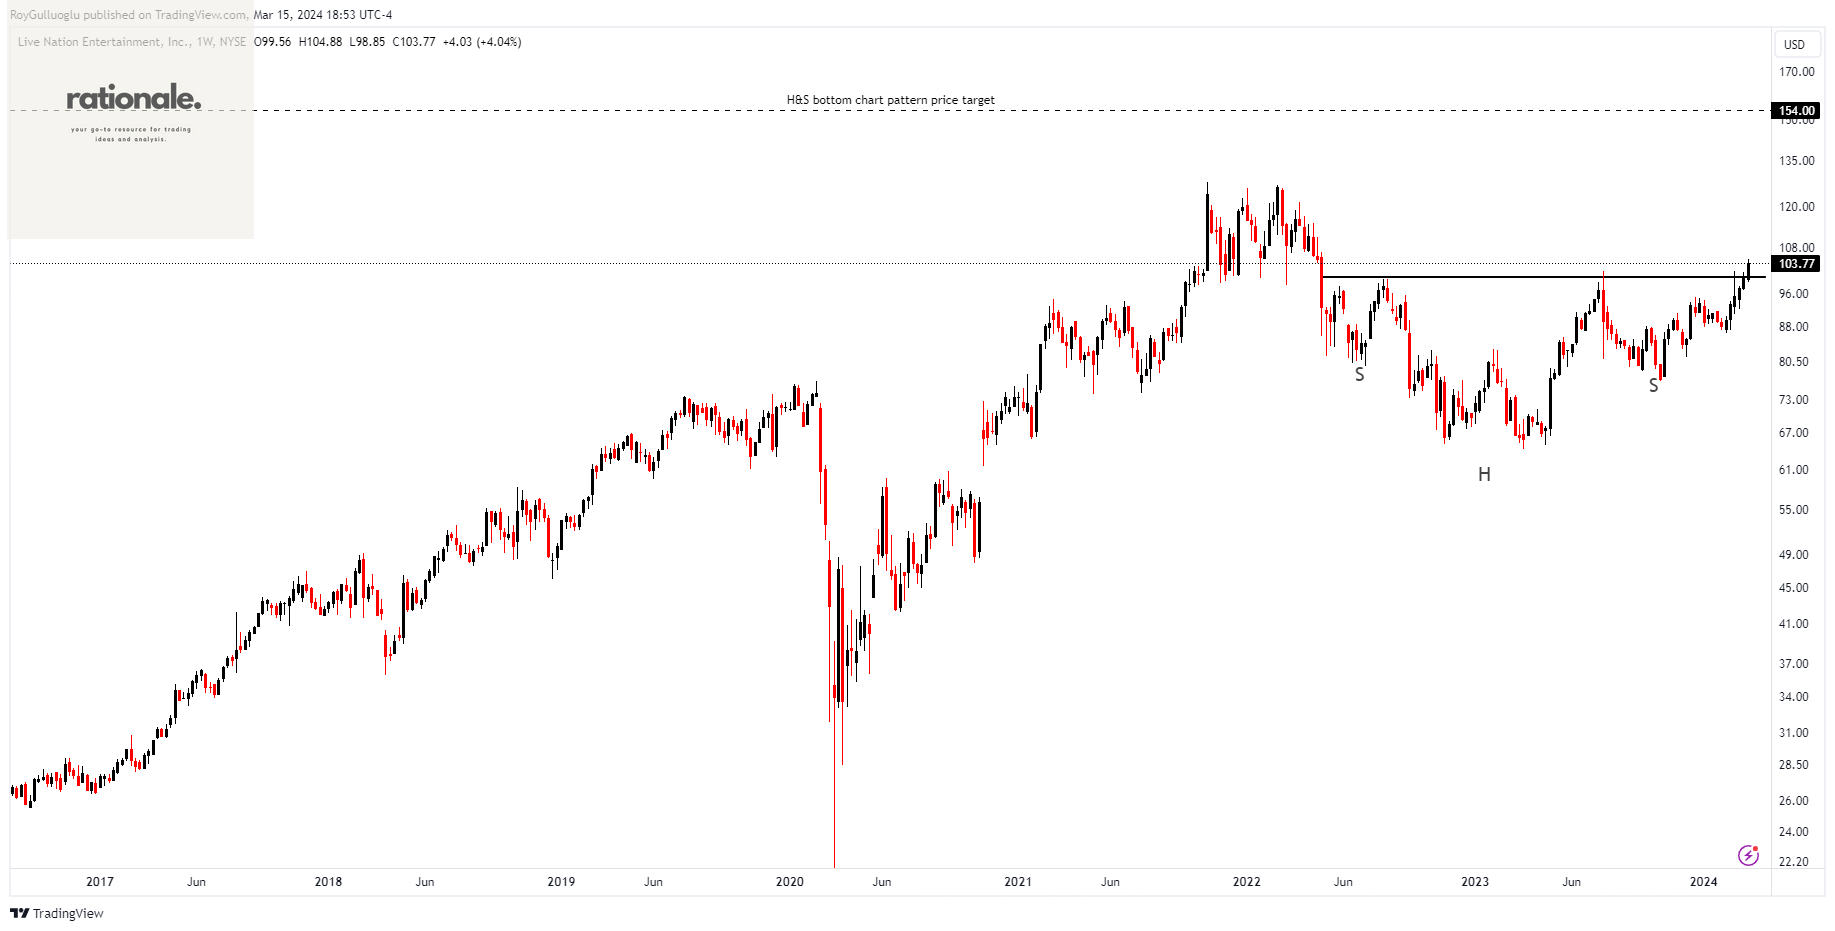
Live Nation Entertainment, Inc. functions as a global live entertainment enterprise. Its operations are divided into Concerts, Ticketing, and Sponsorship & Advertising segments. Within the Concerts segment, the company organizes live music performances in venues it owns or manages, as well as in external venues rented for the events.
The above weekly chart formed an approximately 24-month-long H&S bottom chart pattern as a bullish reversal after a downtrend.
The horizontal boundary at 100 levels acted as a resistance within this pattern.
A daily close above 103 levels validated the breakout from the 24-month-long H&S bottom chart pattern.
Based on this chart pattern, the potential price target is 16 levels.
LYV, classified under the "communication services" sector, falls under the “Large Cap - Growth” stock category.
USA Compression Partners, LP-(USAC/NYSE)-Long Idea
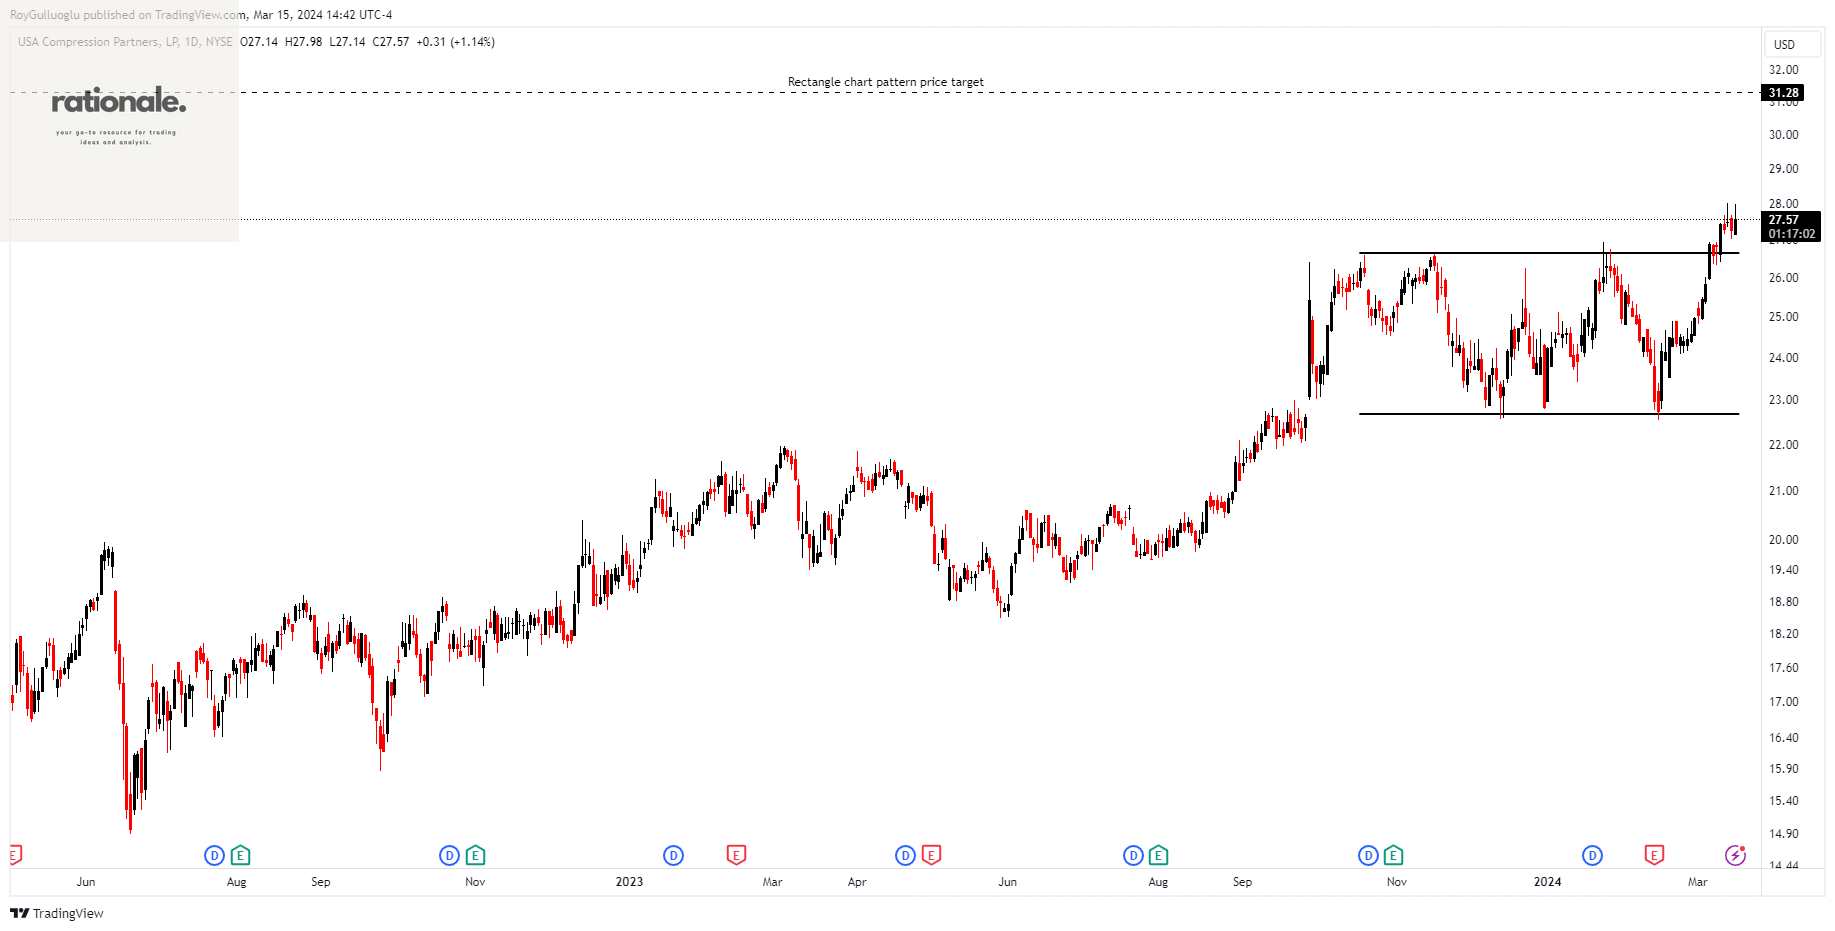
USA Compression Partners, LP delivers natural gas compression solutions within the United States. Its clientele includes oil companies, independent producers, processors, gatherers, and transporters of natural gas and crude oil who benefit from its compression services.
The above daily chart formed an approximately 3-month-long rectangle chart pattern as a bullish continuation after an uptrend.
The horizontal boundary at 26.65 levels acted as a resistance within this pattern.
A daily close above 27.45 levels validated the breakout from the 3-month-long rectangle chart pattern.
Based on this chart pattern, the potential price target is 31.28 levels.
USAC, classified under the "energy" sector, falls under the “Mid Cap - Income” stock category.
The Bank of Nova Scotia-(BNS/NYSE) - Long Idea
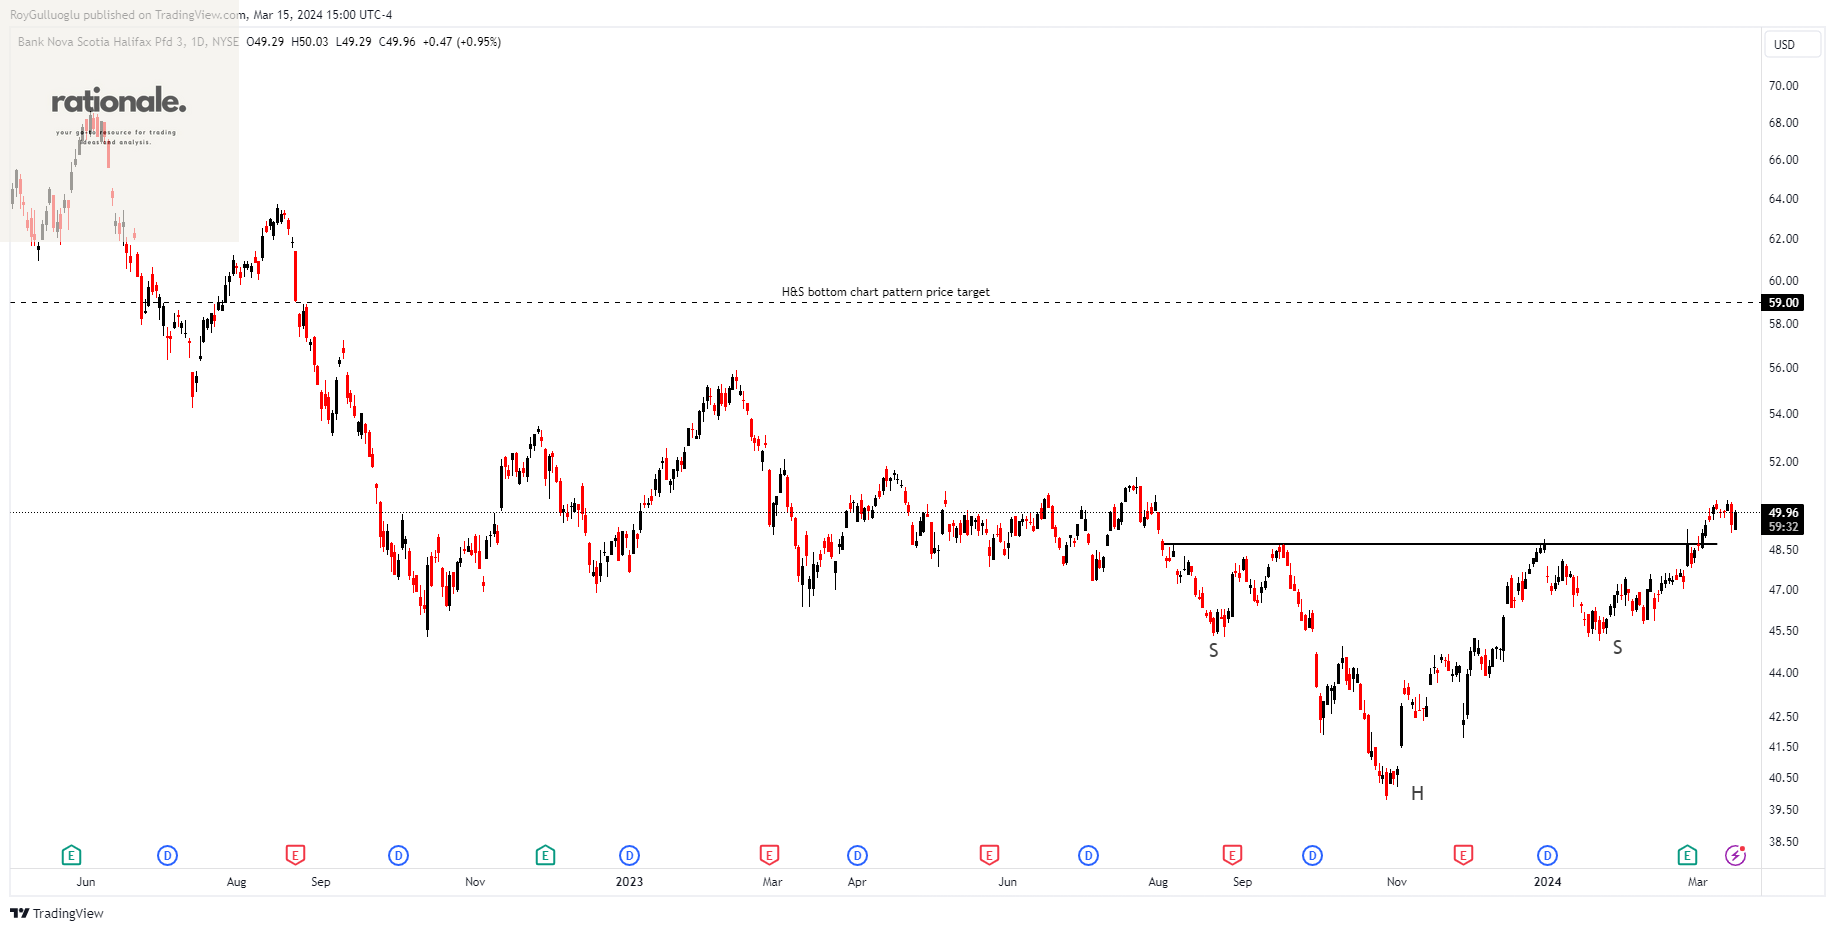
The Bank of Nova Scotia offers a range of banking products and services across Canada, the United States, Mexico, Peru, Chile, Colombia, the Caribbean, Central America, and beyond. Its operations are structured into segments including Canadian Banking, International Banking, Global Wealth Management, and Global Banking and Markets.
The above daily chart formed an approximately 5-month-long H&S bottom chart pattern as a bullish reversal after a downtrend.
The horizontal boundary at 48.72 levels acted as a resistance within this pattern.
A daily close above 50.18 levels validated the breakout from the 5-month-long H&S bottom chart pattern.
Based on this chart pattern, the potential price target is 59 levels.
BNS, classified under the "financial services" sector, falls under the “Large Cap - Income” stock category.
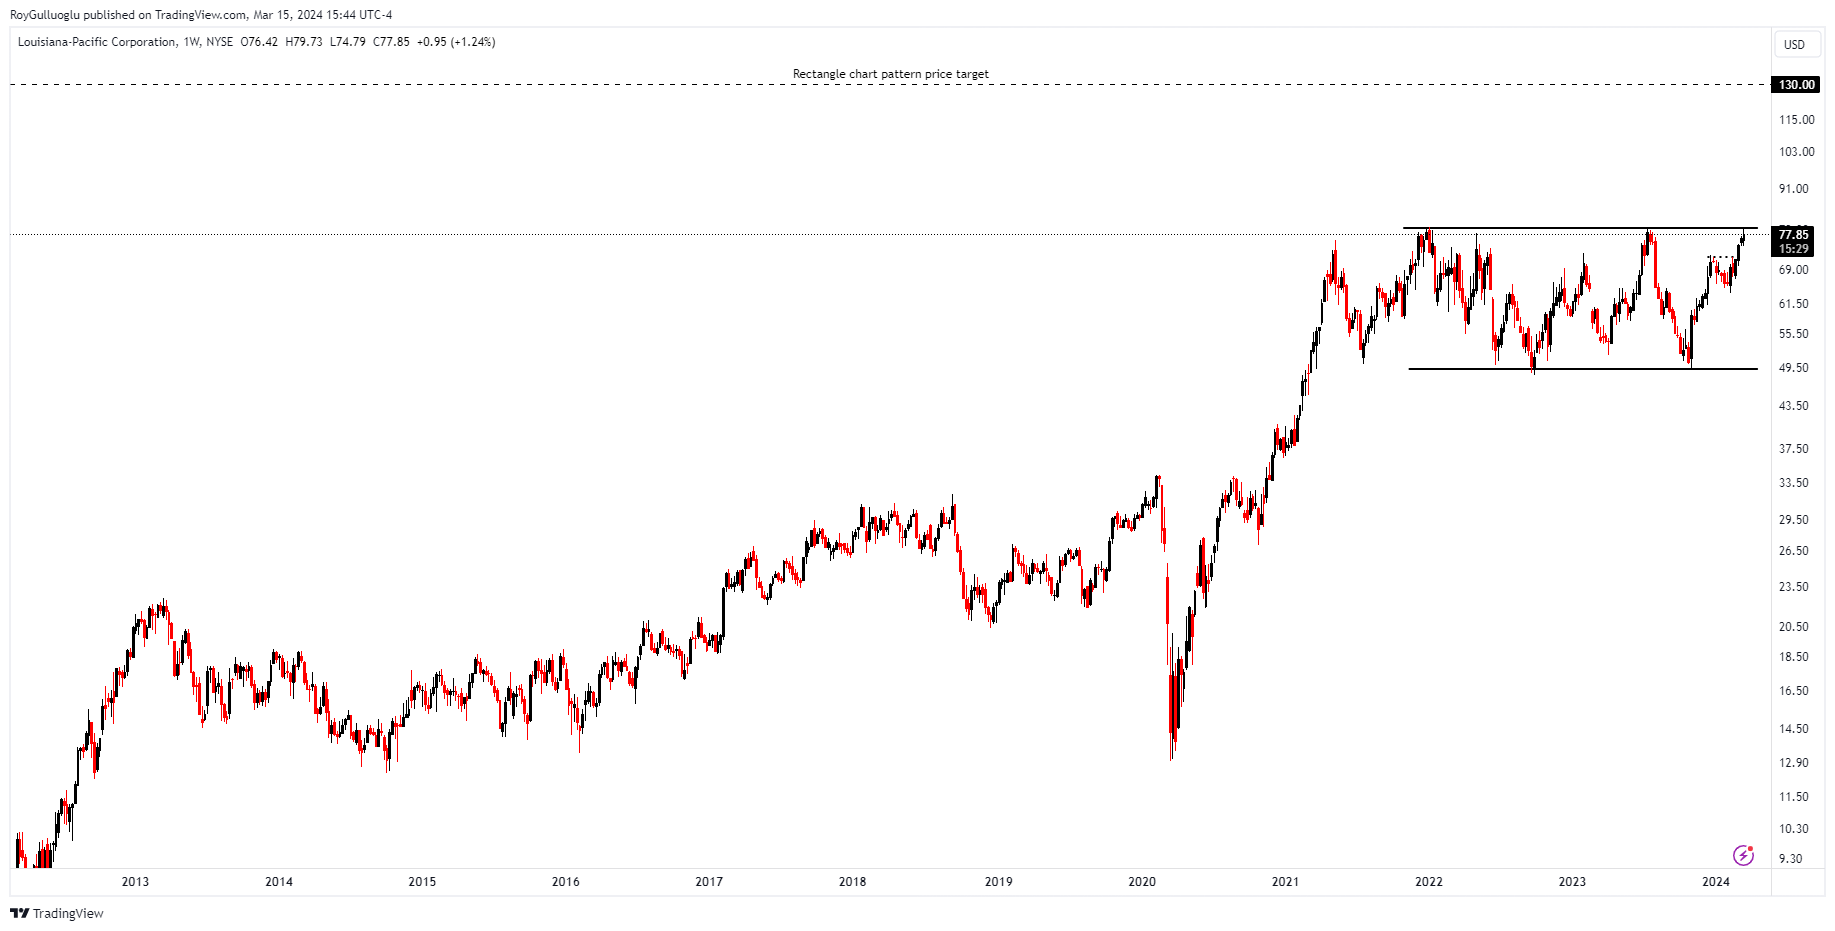
Louisiana-Pacific Corporation-(LPX/NYSE)-Long Idea
Louisiana-Pacific Corporation and its subsidiaries specialize in delivering building solutions primarily tailored for new home construction, repair and renovation, and outdoor structure markets. The company operates through distinct segments including Siding, Oriented Strand Board, LP South America, and Others.
The above weekly chart formed an approximately 4-month-long rectangle chart pattern as a bullish continuation after an uptrend.
The horizontal boundary at 79.5 levels acts as a resistance within this pattern.
A daily close above 81.88 levels would validate the breakout from the 4-month-long rectangle chart pattern.
Based on this chart pattern, the potential price target is 130 levels.
LPX, classified under the "industrials" sector, falls under the “Mid Cap - Value” stock category.
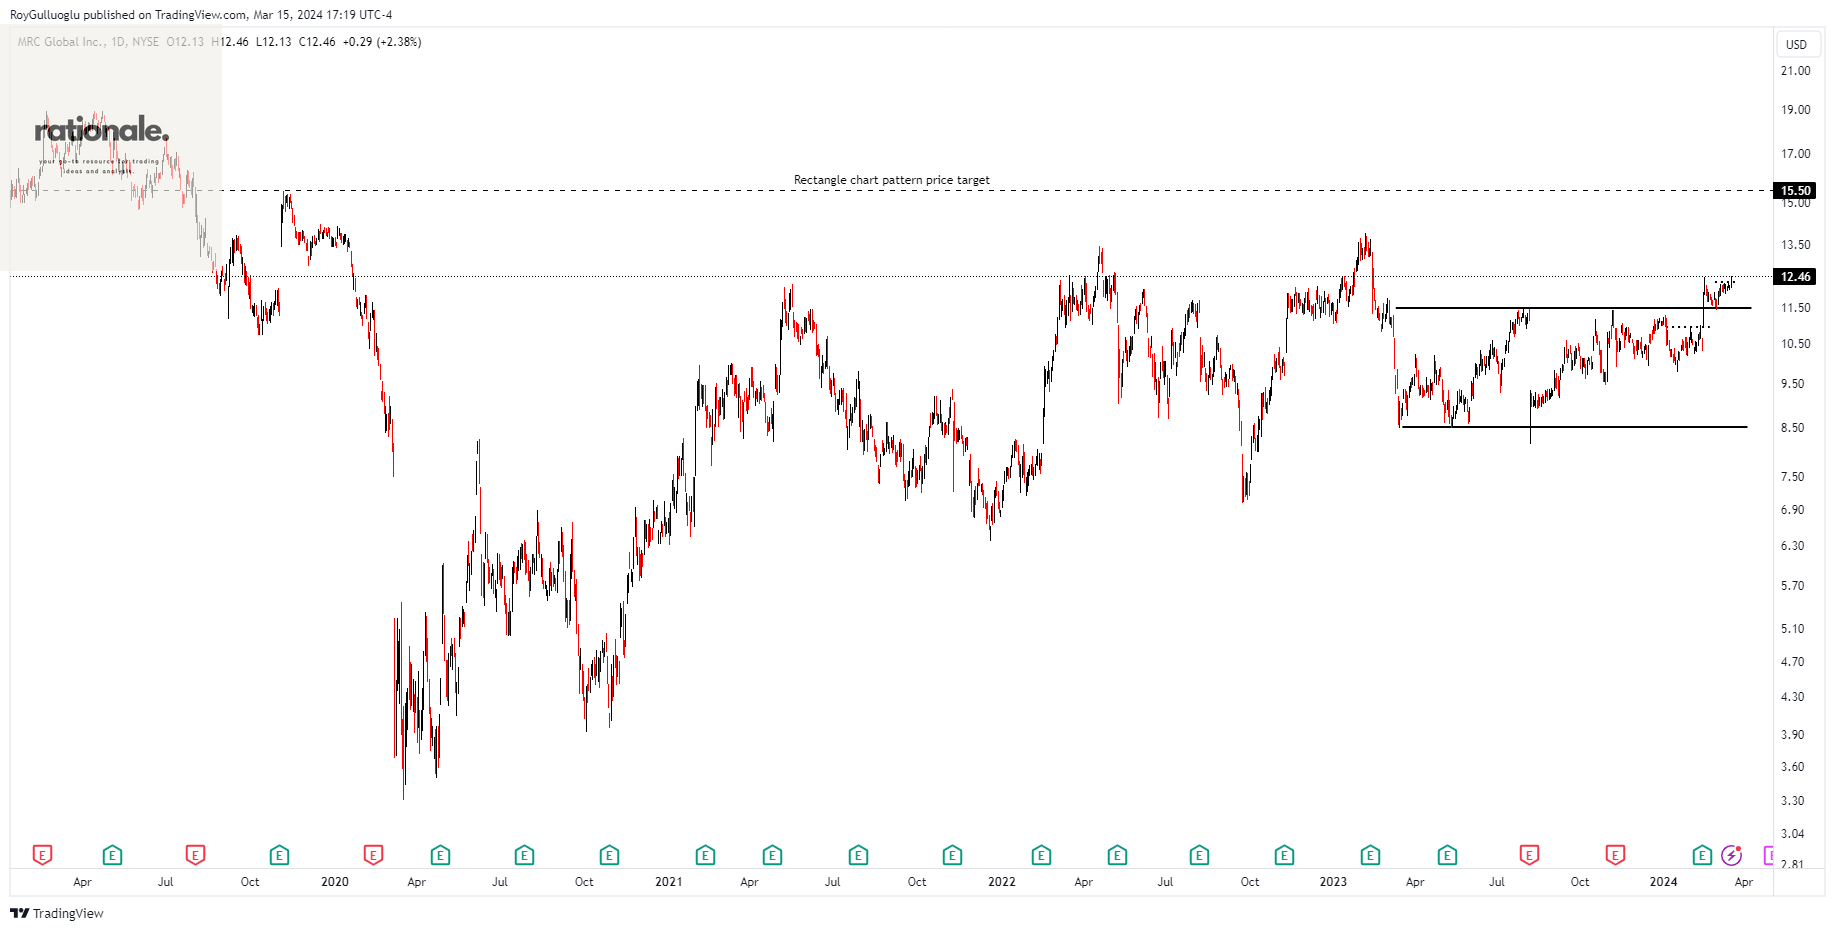
MRC Global Inc.-(MRC/NYSE)-Long Idea
MRC Global Inc., along with its subsidiaries, distributes pipes, valves, fittings, and other infrastructure products and services across the United States, Canada, and various international markets.
The above daily chart formed an approximately 7-month-long rectangle chart pattern as a bullish reversal after a downtrend
The boundary at 11.48 levels acted as a resistance within this pattern.
A daily close above 11.82 levels validated the breakout from the 7-month-long rectangle chart pattern.
Based on this chart pattern, the potential price target is 15.50 levels.
MRC, classified under the "energy" sector, falls under the “Small Cap - Income” stock category.
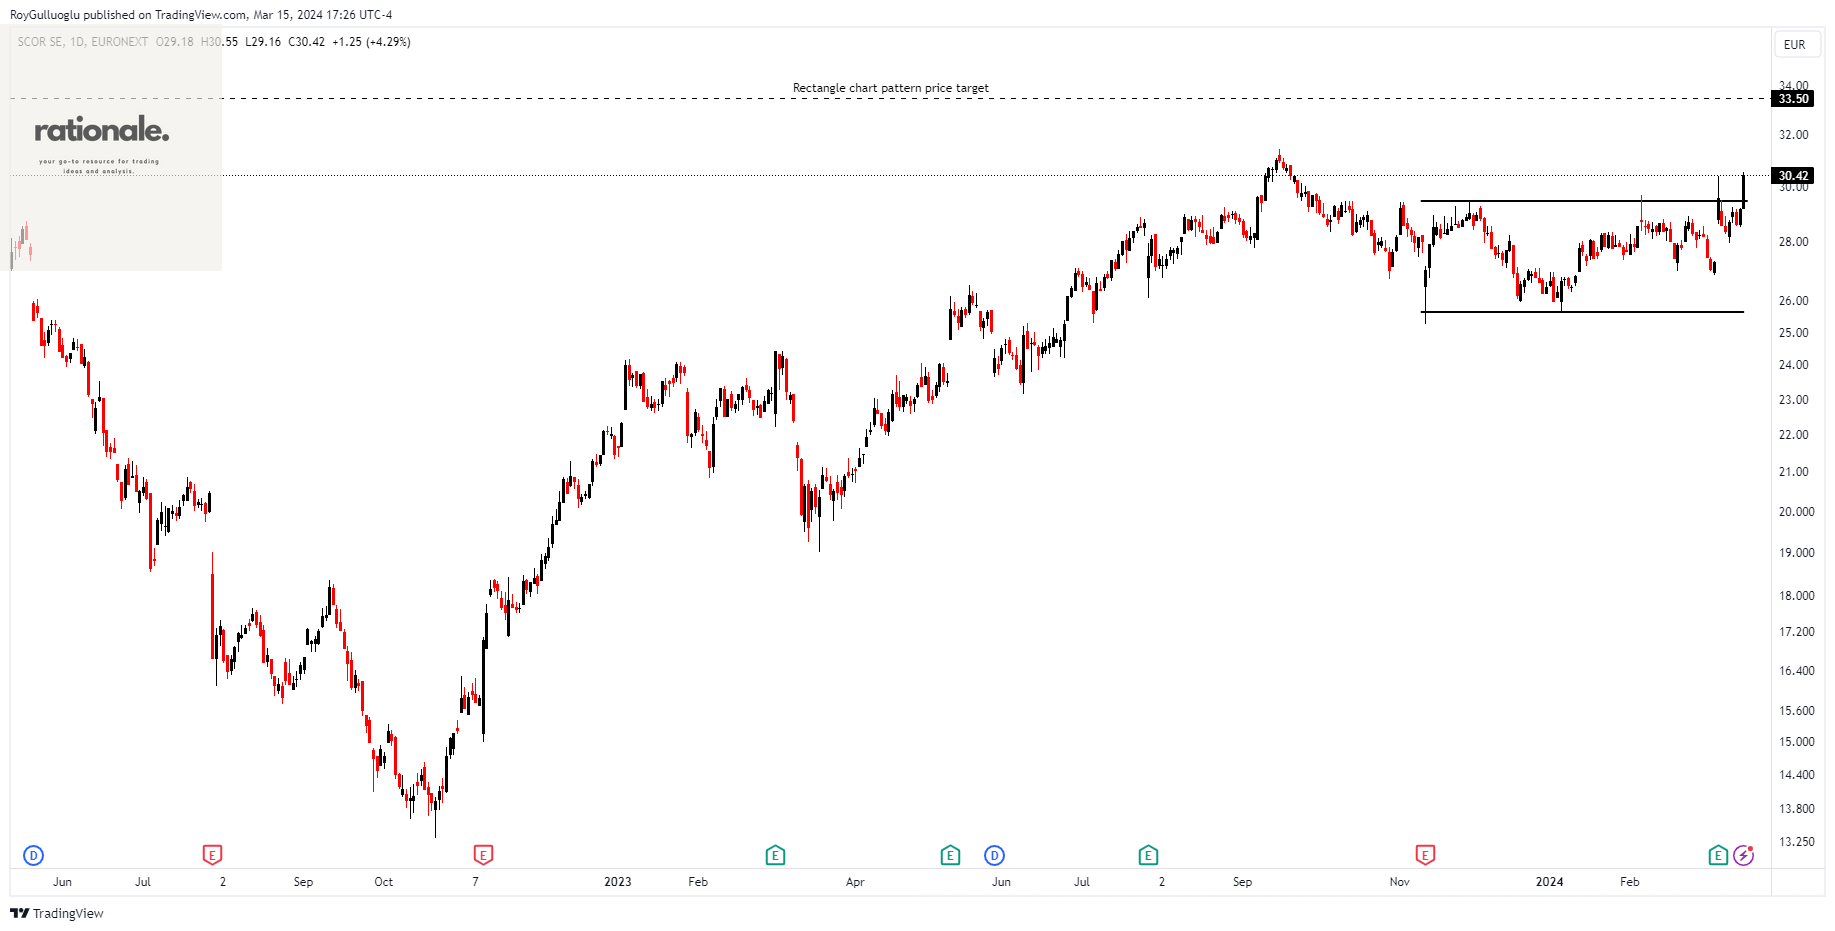
SCOR SE-(SCR/EURONEXT)-Long Idea
SCOR SE, along with its subsidiaries, offers life and non-life reinsurance products across Europe, the Middle East, Africa, the Americas, Latin America, and the Asia Pacific region.
The above daily chart formed an approximately 3-month-long rectangle chart pattern as a bullish reversal after a downtrend.
The boundary at 29.46 levels acted as a resistance within this pattern.
A daily close above 30.35 levels validated the breakout from the 3-month-long rectangle chart pattern.
Based on this chart pattern, the potential price target is 33.50 levels.
SCR, classified under the "financial services" sector, falls under the “Mid Cap - Income” stock category.
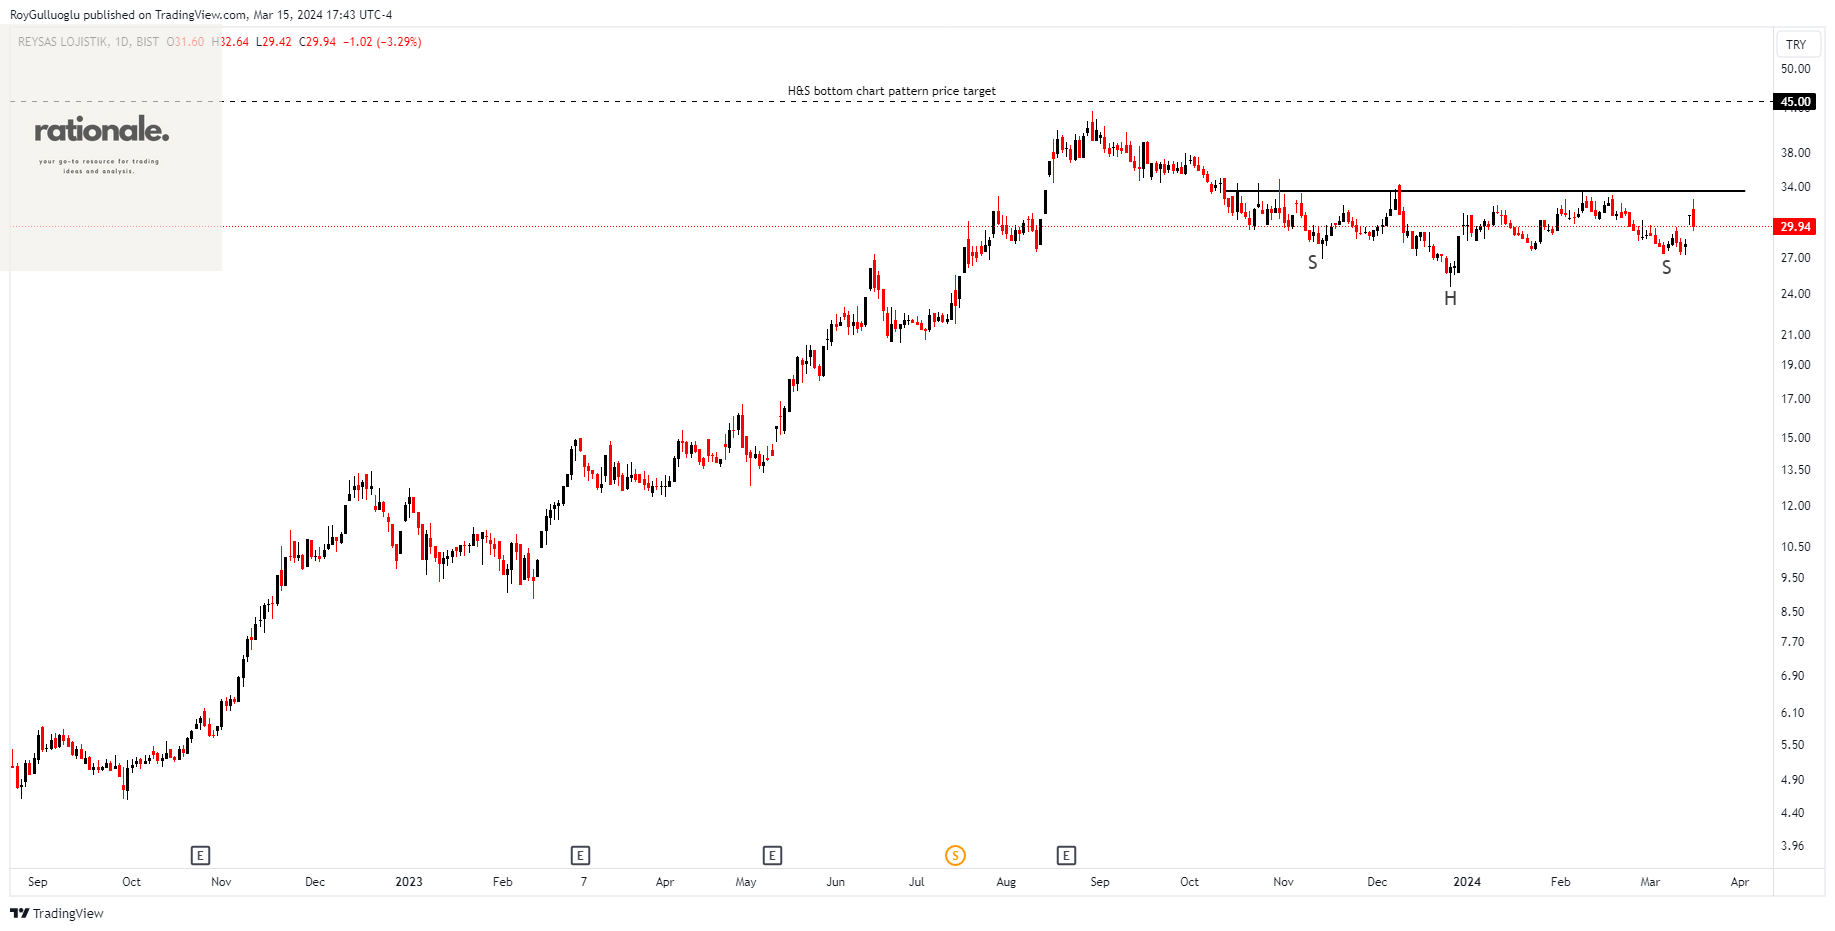
Reysas Tasimacilik ve Lojistik Ticaret A.S.-(RYSAS/BIST)-Long Idea
Reysas Transportation and Logistics Trading Inc. delivers logistic solutions both within Turkey and globally. Their services encompass local transportation and distribution, automotive logistics, warehousing, railway transportation, international services, fuel logistics, and bonded warehousing.
The above daily chart formed an approximately 3-month-long H&S bottom chart pattern as a bullish reversal after a downtrend.
The horizontal boundary at 33.54 levels acts as a resistance within this pattern.
A daily close above 34.54 levels would validate the breakout from the 3-month-long H&S bottom chart pattern.
Based on this chart pattern, the potential price target is 45 levels.
RYSAS, classified under the "industrials" sector, falls under the “Small Cap - Value” stock category.