


Microsoft Corporation-(MSFT/NASDAQ)-Short Idea
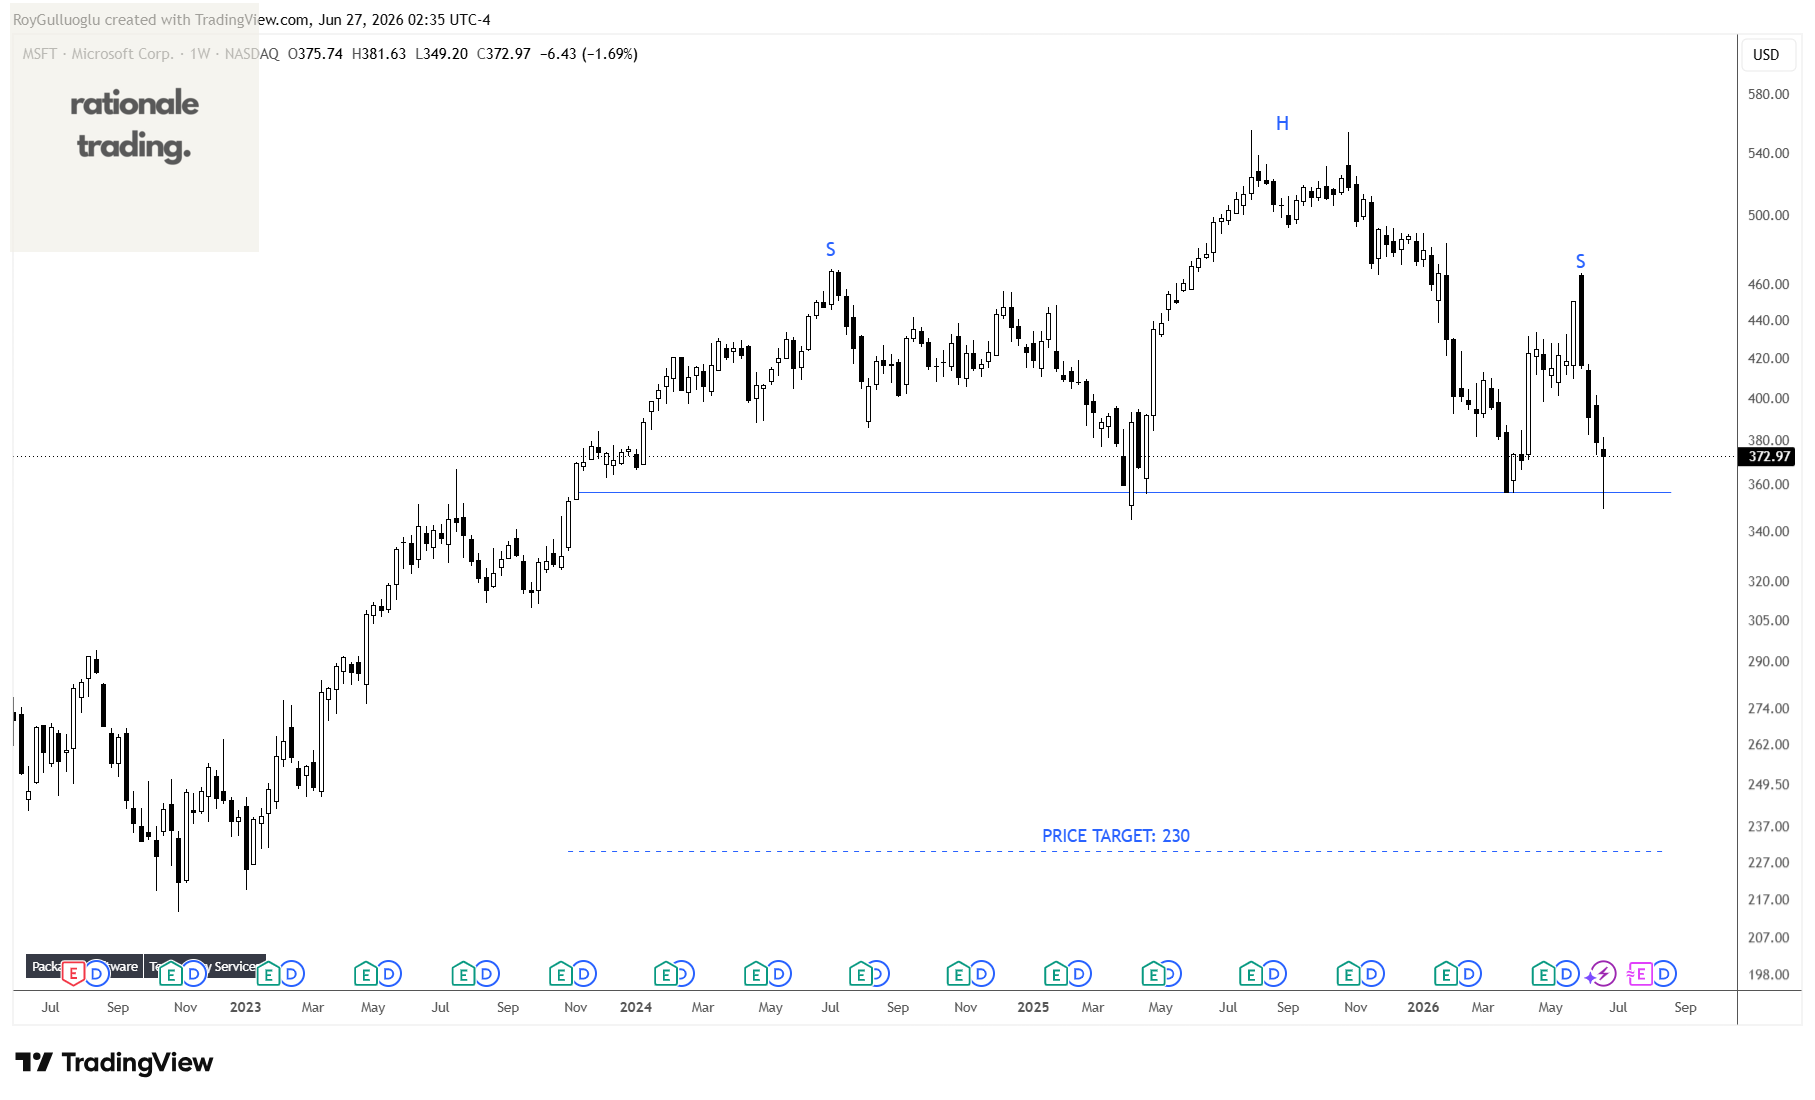
Microsoft Corporation develops and supports software, services, devices, and solutions worldwide.
The above weekly chart formed an approximately 35-month-long H&S top chart pattern as a bearish reversal after an uptrend.
The horizontal boundary at 356.5 levels acts as a support within this pattern.
A daily close below 345.9 levels would validate the breakdown from the 35-month-long H&S top chart pattern.
Based on this chart pattern, the potential price target is 230 levels.
PACS Group, Inc.-(PACS/NYSE)-Long Idea
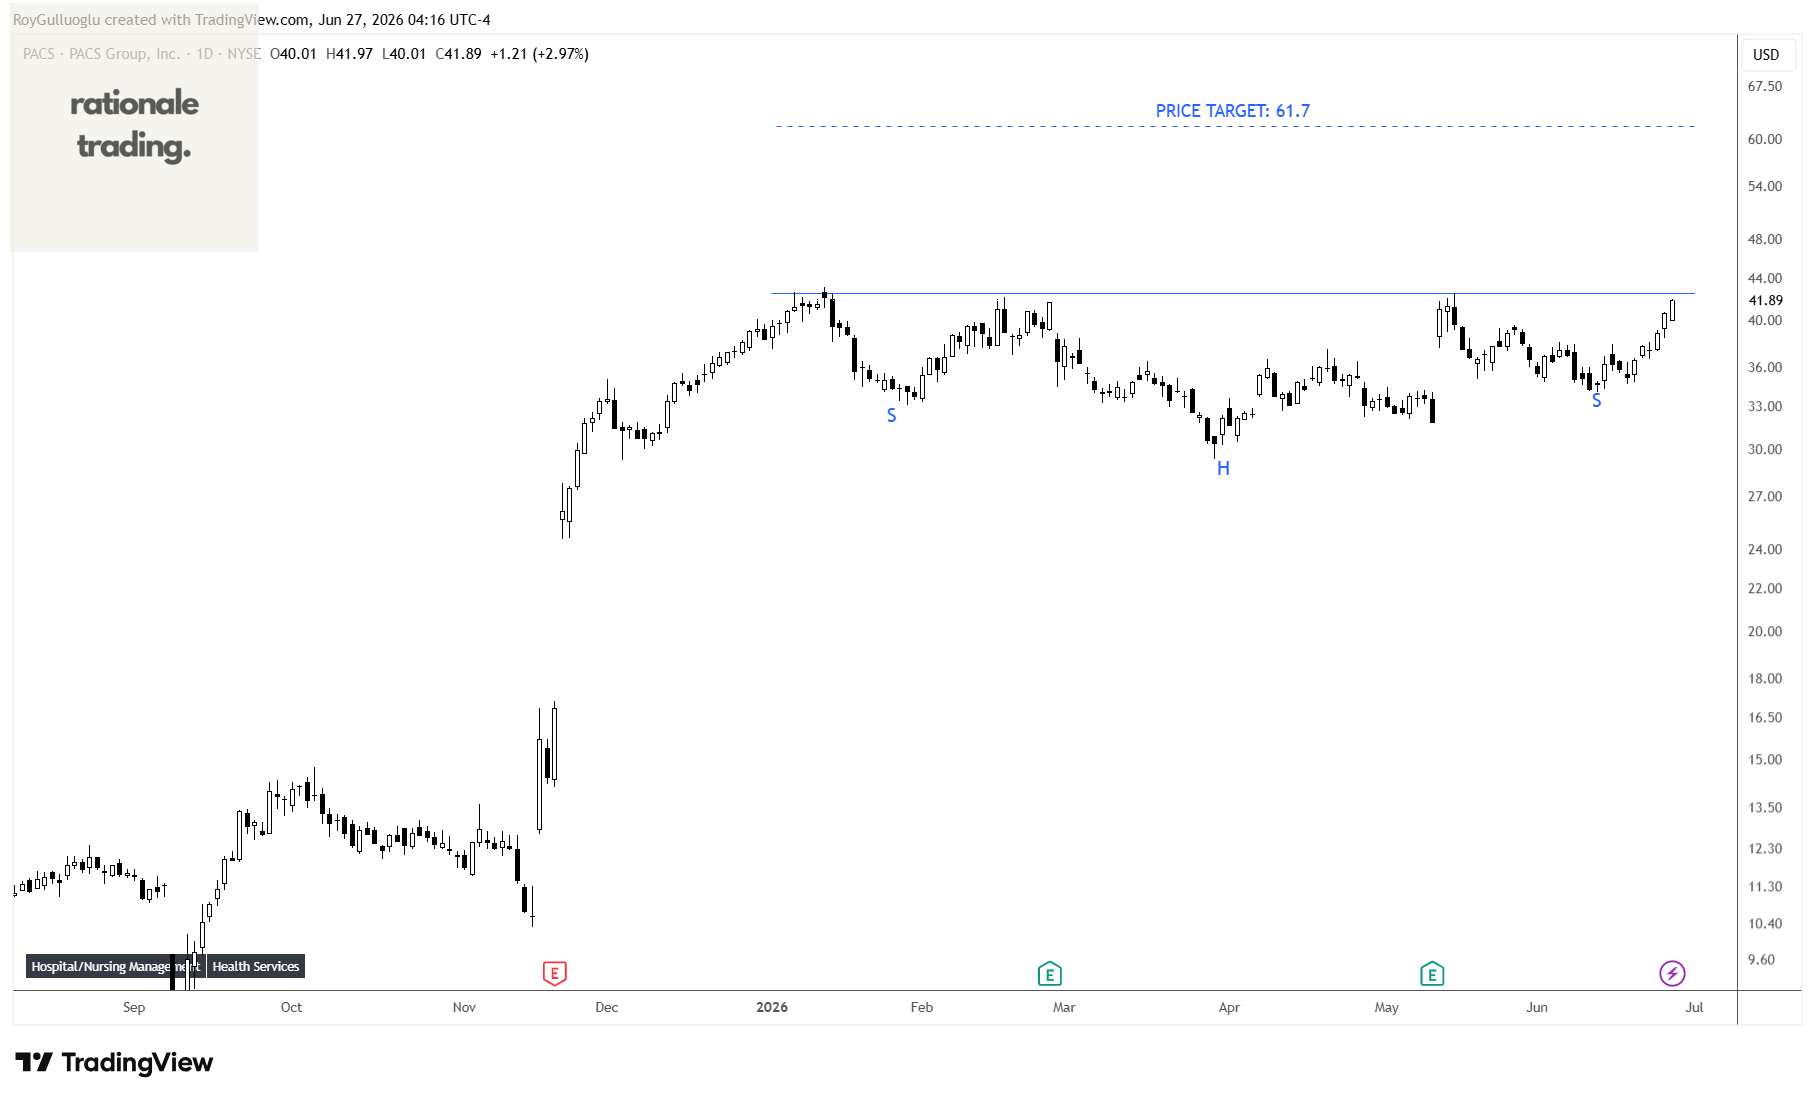
PACS Group, Inc., through its subsidiaries, operates skilled nursing facilities and assisted living facilities in the United States
The above daily chart formed an approximately 4-month-long H&S continuation chart pattern as a bullish continuation after an uptrend.
The horizontal boundary at 42.53 levels acts as a resistance within this pattern.
A daily close above 43.8 levels would validate the breakout from the 4-month-long H&S continuation chart pattern.
Based on this chart pattern, the potential price target is 61.7 levels.
Parex Resources Inc.-(PXT/TSX)-Short Idea
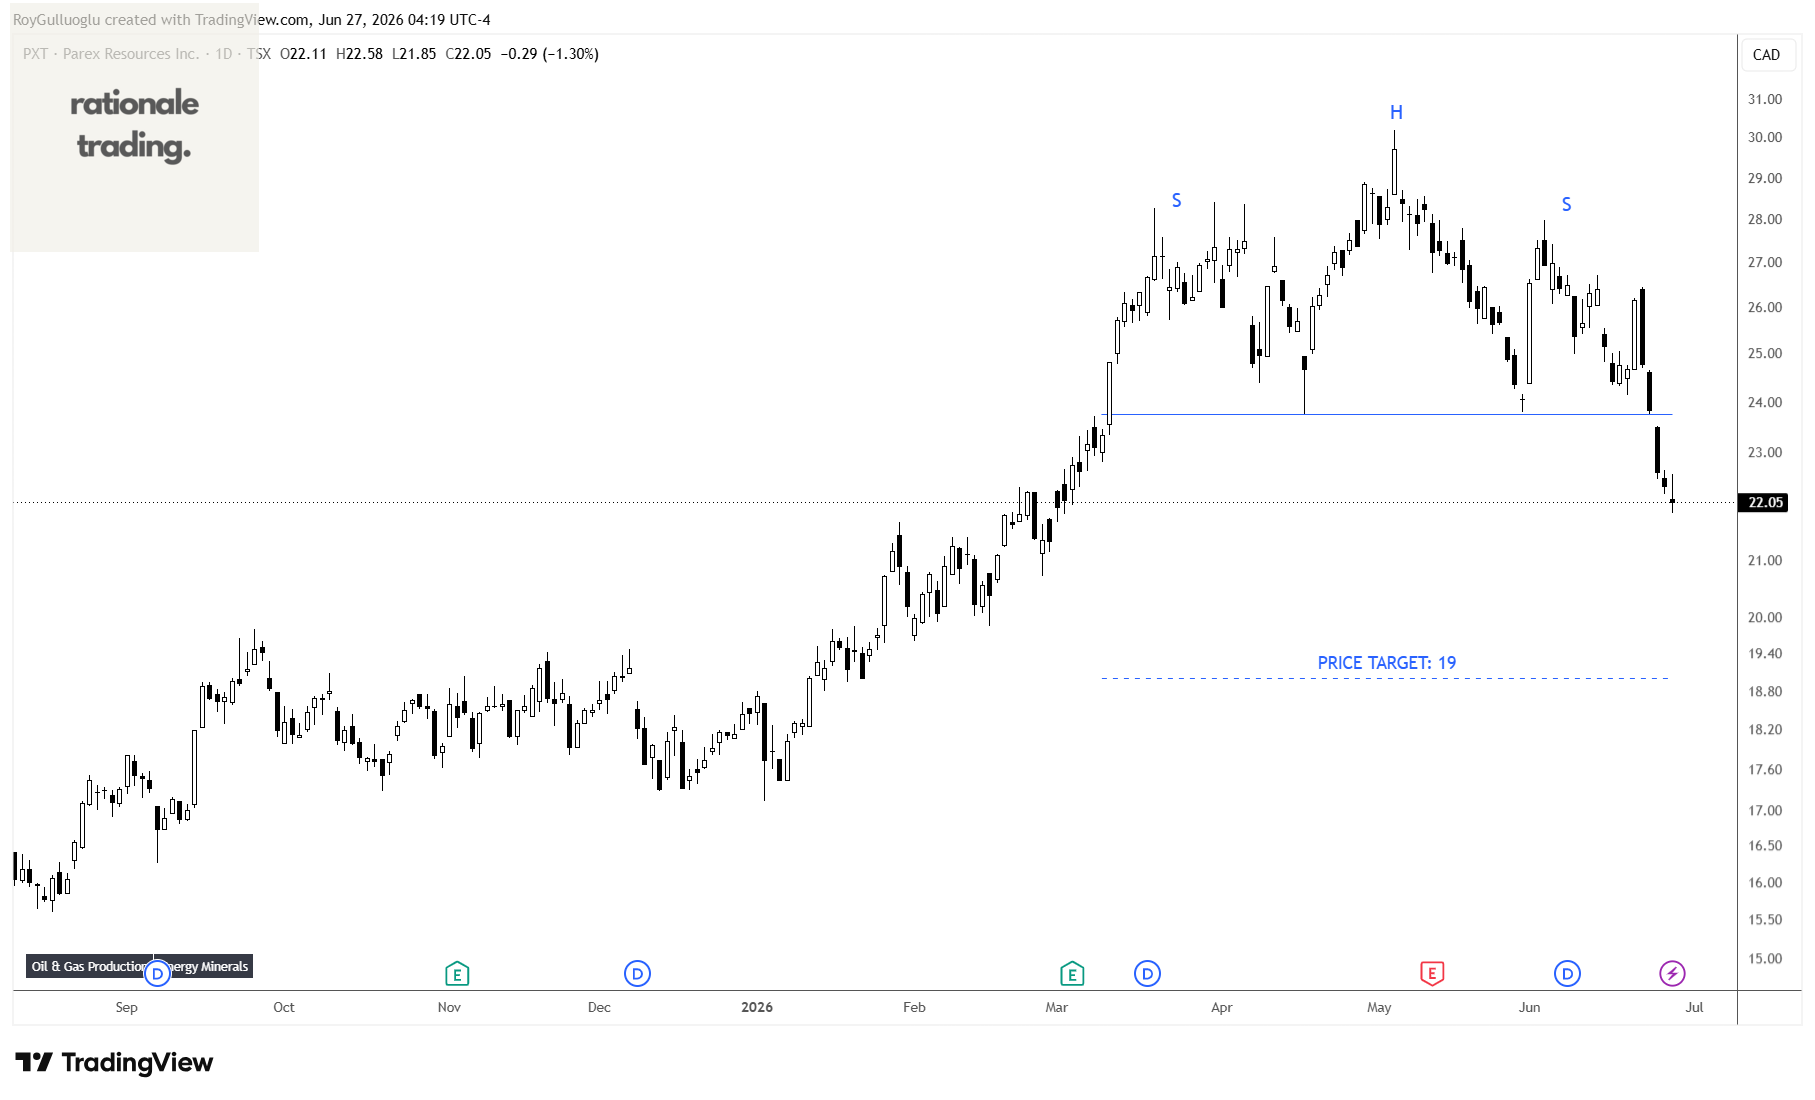
Parex Resources Inc. engages in the exploration, development, production, and marketing of oil and natural gas in Colombia.
The above daily chart formed an approximately 3-month-long H&S top chart pattern as a bearish reversal after an uptrend.
The horizontal boundary at 23.75 acted as a support within this pattern.
A daily close below 23 levels validated the breakdown from the 3-month-long H&S top chart pattern.
Based on this chart pattern, the potential price target is 19 levels.
Fortis Inc.-(FTS/TSX)-Long Idea
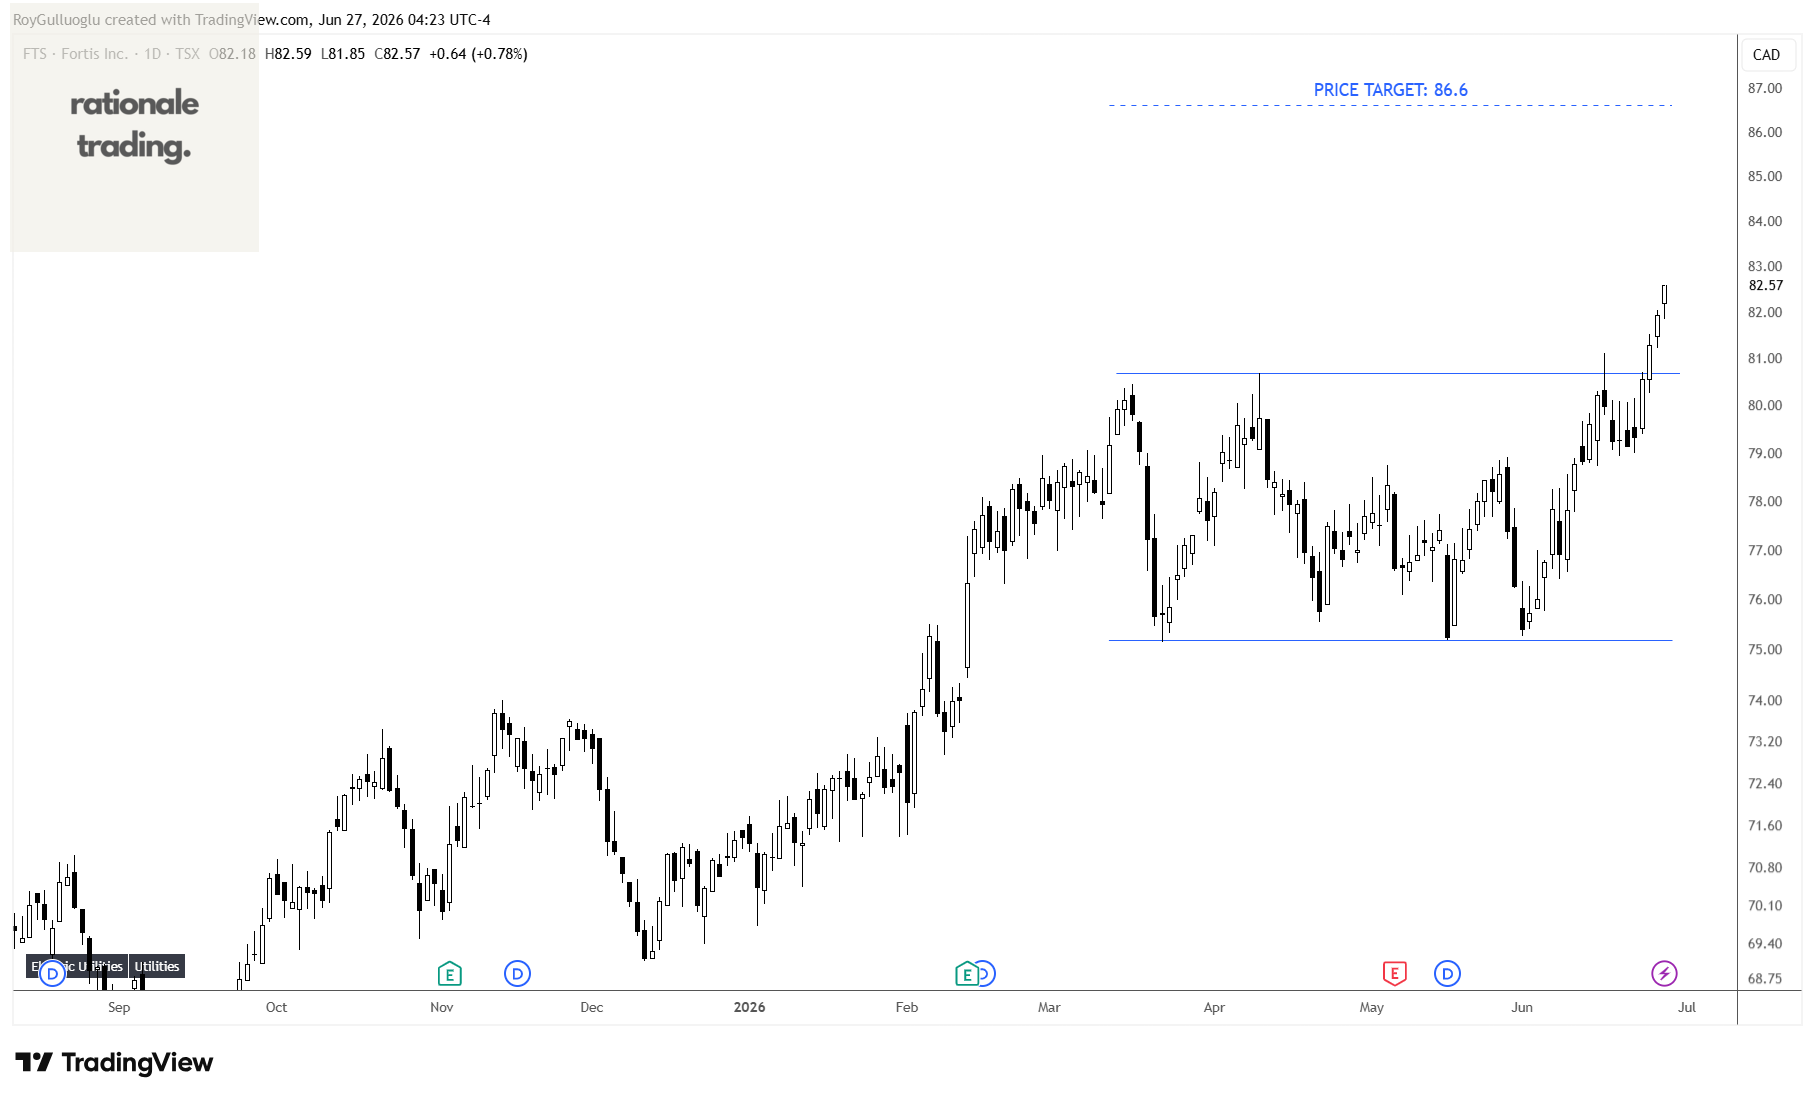
Fortis Inc. operates as an electric and gas utility company in Canada, the United States, and the Caribbean countries.
The above daily chart formed an approximately 2-month-long rectangle chart pattern as a bullish continuation after an uptrend.
Within this pattern, the horizontal boundary at 80.7 levels acted as a resistance.
A daily close above 81.5 levels validated the breakout from the 2-month-long rectangle chart pattern .
Based on this chart pattern, the potential price target is 86.6 levels.
Iyogin Holdings,Inc.-(5830/TSE)-Long Idea
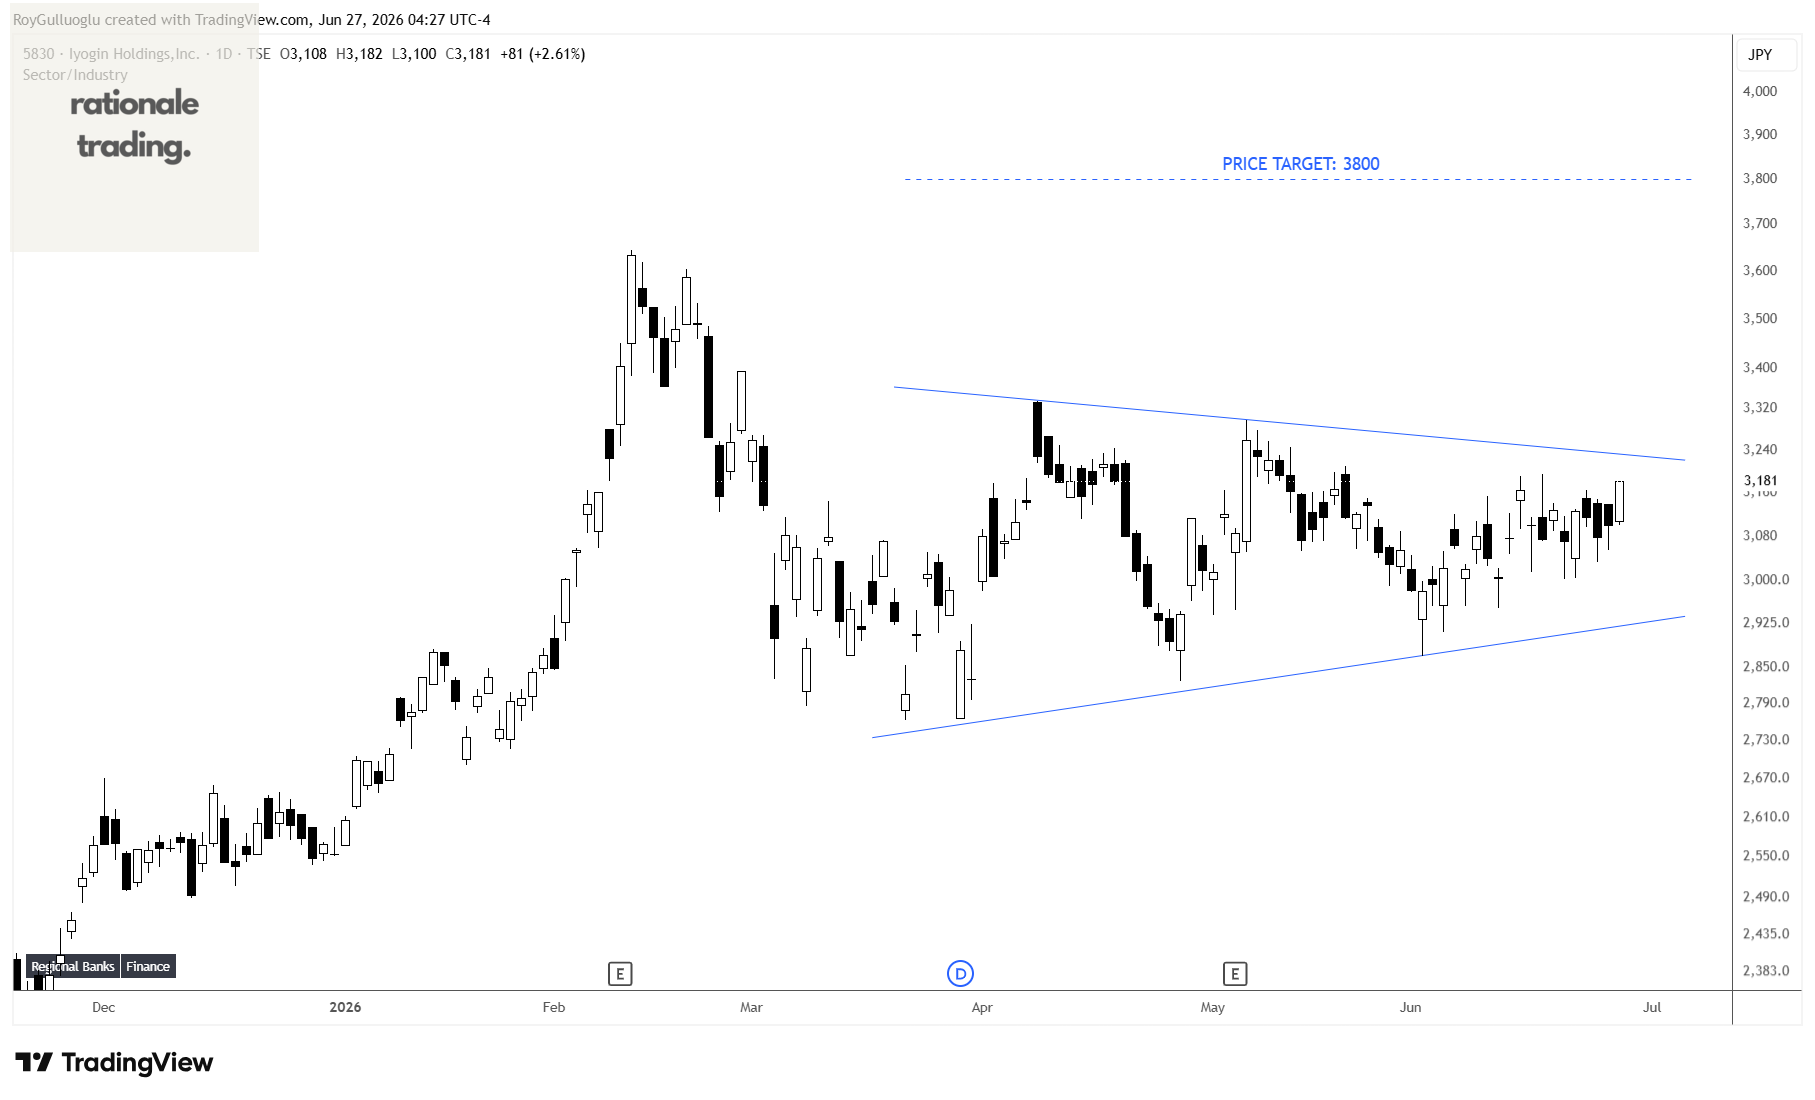
Iyogin Holdings,Inc., together with its subsidiaries, provides banking and financial services.
The above daily chart formed an approximately 2-month-long symmetrical triangle chart pattern as a bullish reversal after a downtrend.
A daily close above 3320 levels would validate the breakout from the 2-month-long symmetrical triangle chart pattern.
Based on this chart pattern, the potential price target is 3800 levels.