


Academy Sports and Outdoors, Inc.-(ASO/NASDAQ)-Long Idea
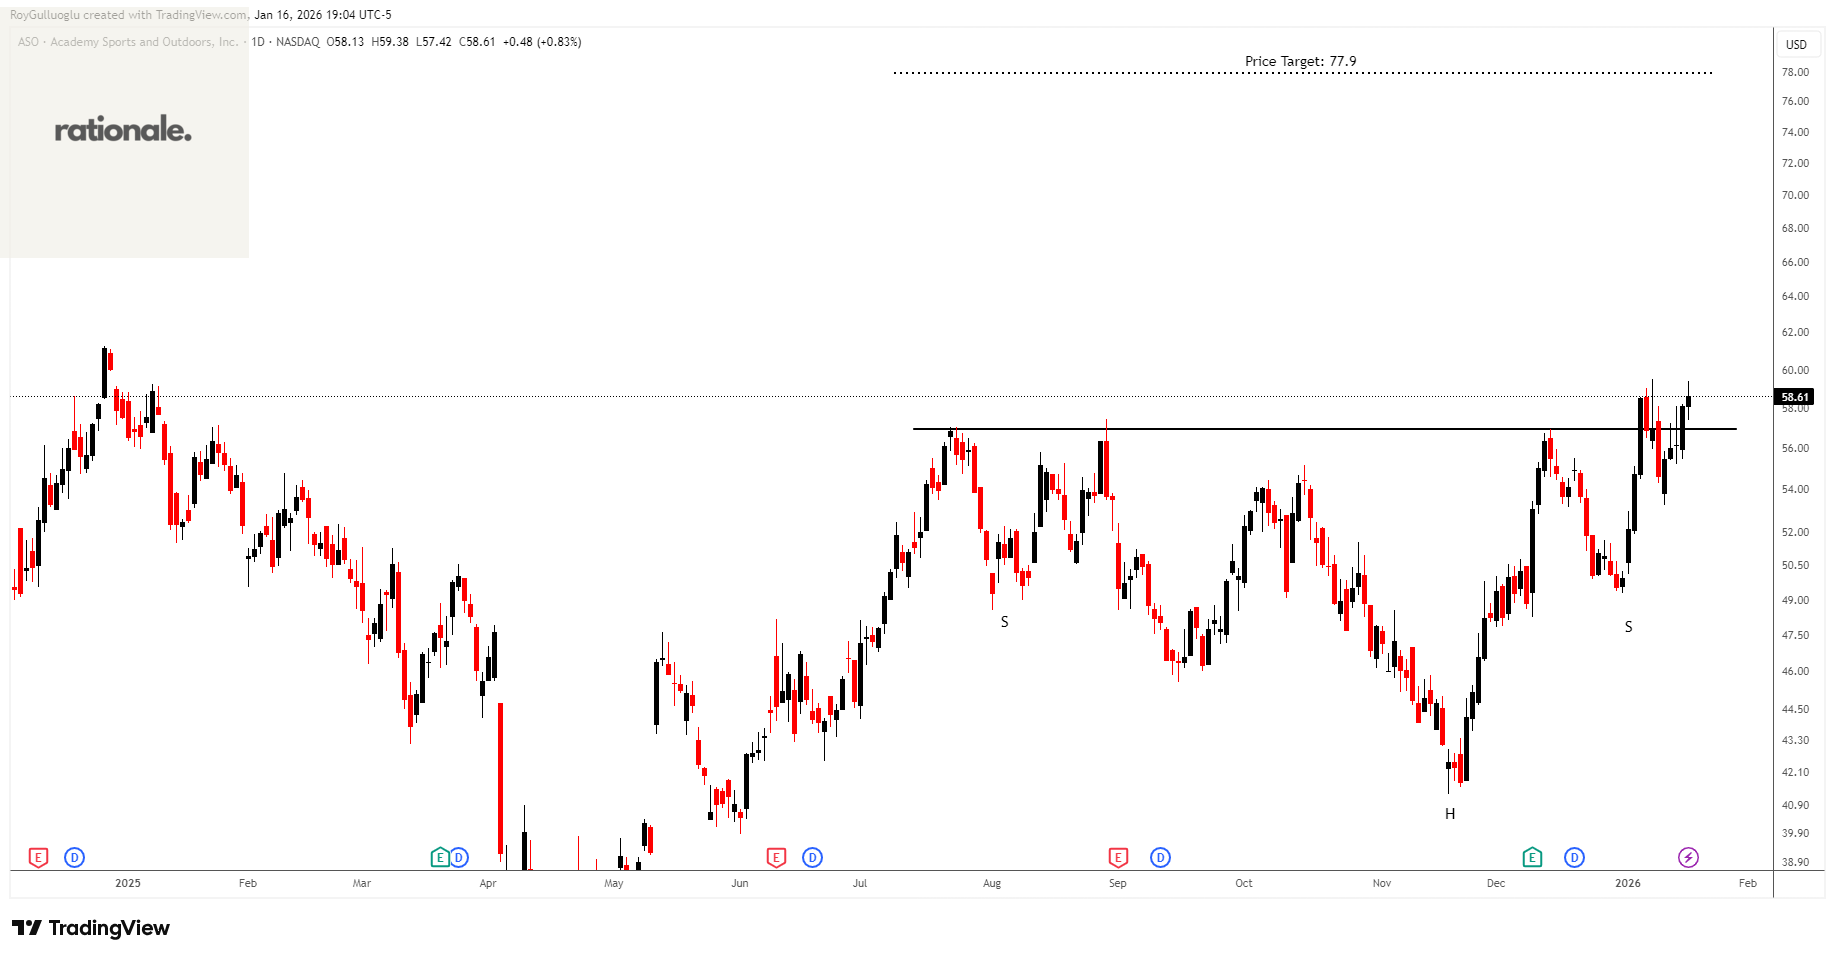
Academy Sports and Outdoors, Inc., through its subsidiaries, operates as a sporting goods and outdoor recreational retailer in the United States.
The above daily chart formed an approximately 4-month-long H&S bottom chart pattern as a bullish reversal after a downtrend.
The horizontal boundary at 56.95 levels acts as a support within this pattern.
A daily close above 58.66 levels would validate the breakdown from the 4-month-long H&S bottom chart pattern.
Based on this chart pattern, the potential price target is 77.9 levels.
Sprinklr, Inc.-(CXM/NASDAQ)-Short Idea
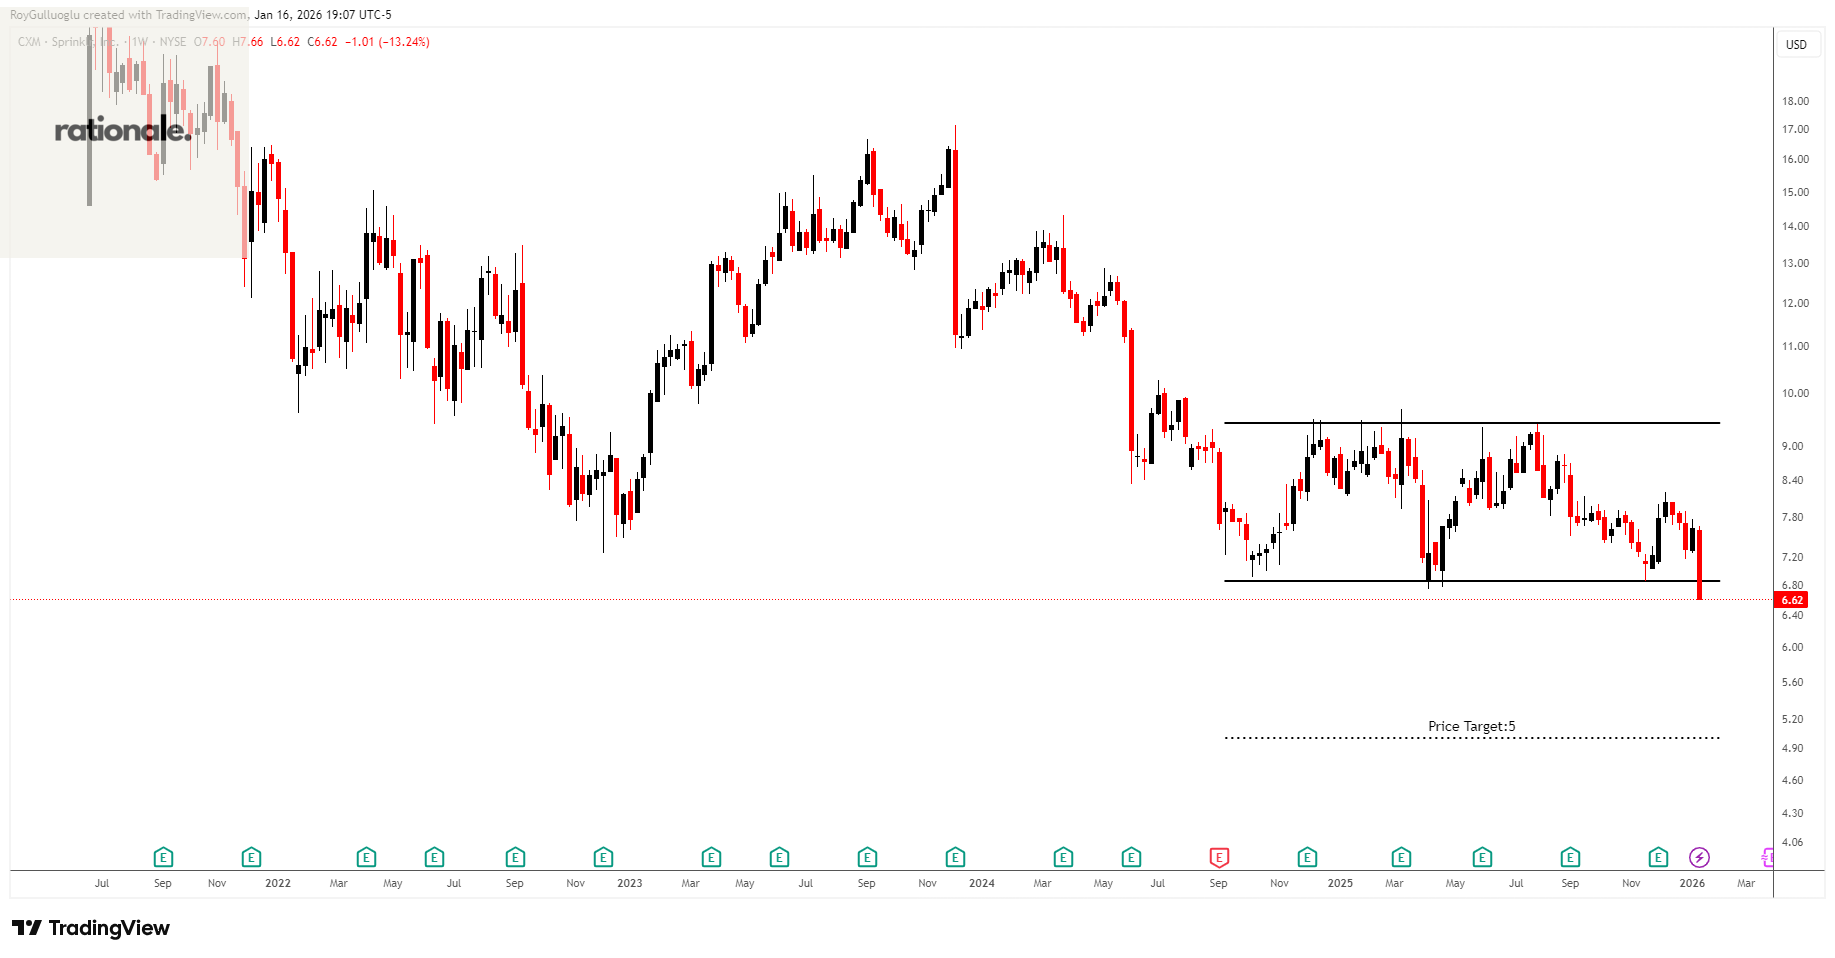
Sprinklr, Inc. provides enterprise cloud software products worldwide.
The above weekly chart formed an approximately 16-month-long rectangle chart pattern as a bearish contuniation after an uptrend.
The horizontal boundary at 6.86 levels acted as a resistance within this pattern.
A daily close below 6.66 levels validated the breakout from the 16-month-long rectangle chart pattern.
Based on this chart pattern, the potential price target is 5 levels.
Koç Holding A.S.-(KCHOL/BIST)-Long Idea
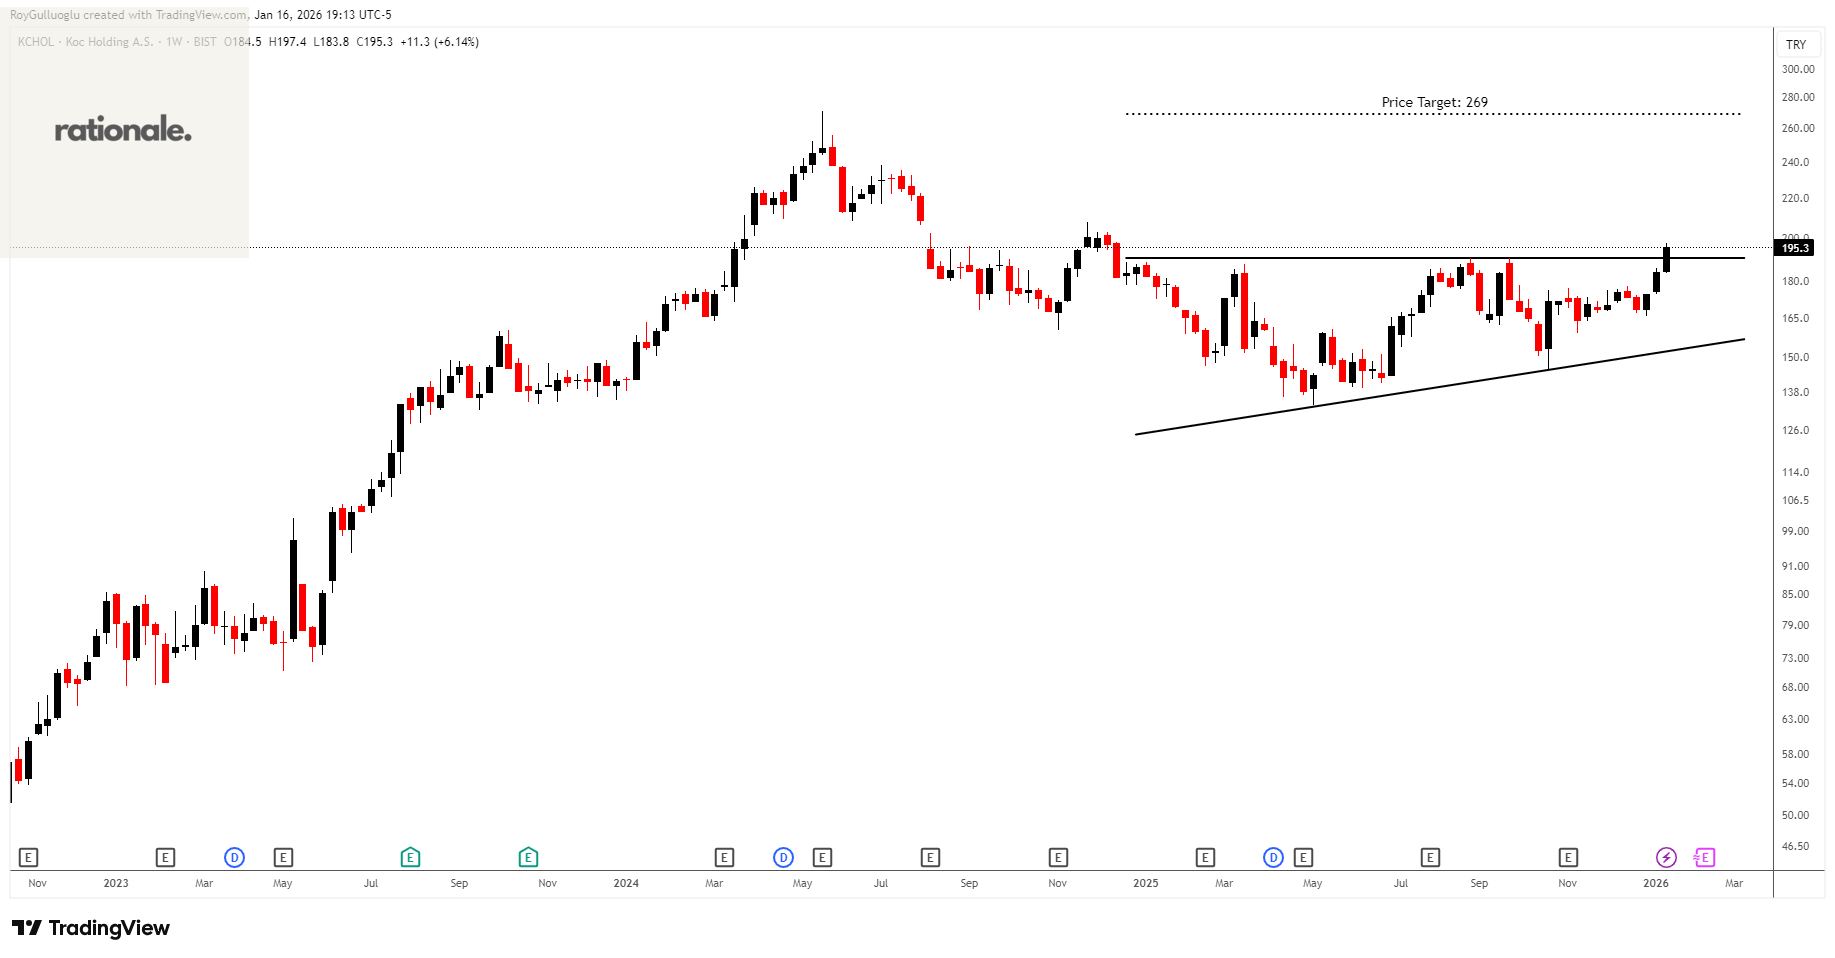
Koç Holding A.S., through its subsidiaries, engages in the energy, automotive, consumer durables, finance, and other businesses in Turkey and internationally.
The above weekly chart formed an approximately 14-month-long ascending triangle chart pattern as a bullish reversal after a downtrend.
The horizontal boundary at 190.5 levels acts as a resistance within this pattern.
A daily close above 196.2 levels would validate the breakout from the 14-month-long ascending triangle chart pattern.
Based on this chart pattern, the potential price target is 269 levels.
Migros Ticaret A.S.-(MGROS/BIST)-Long Idea
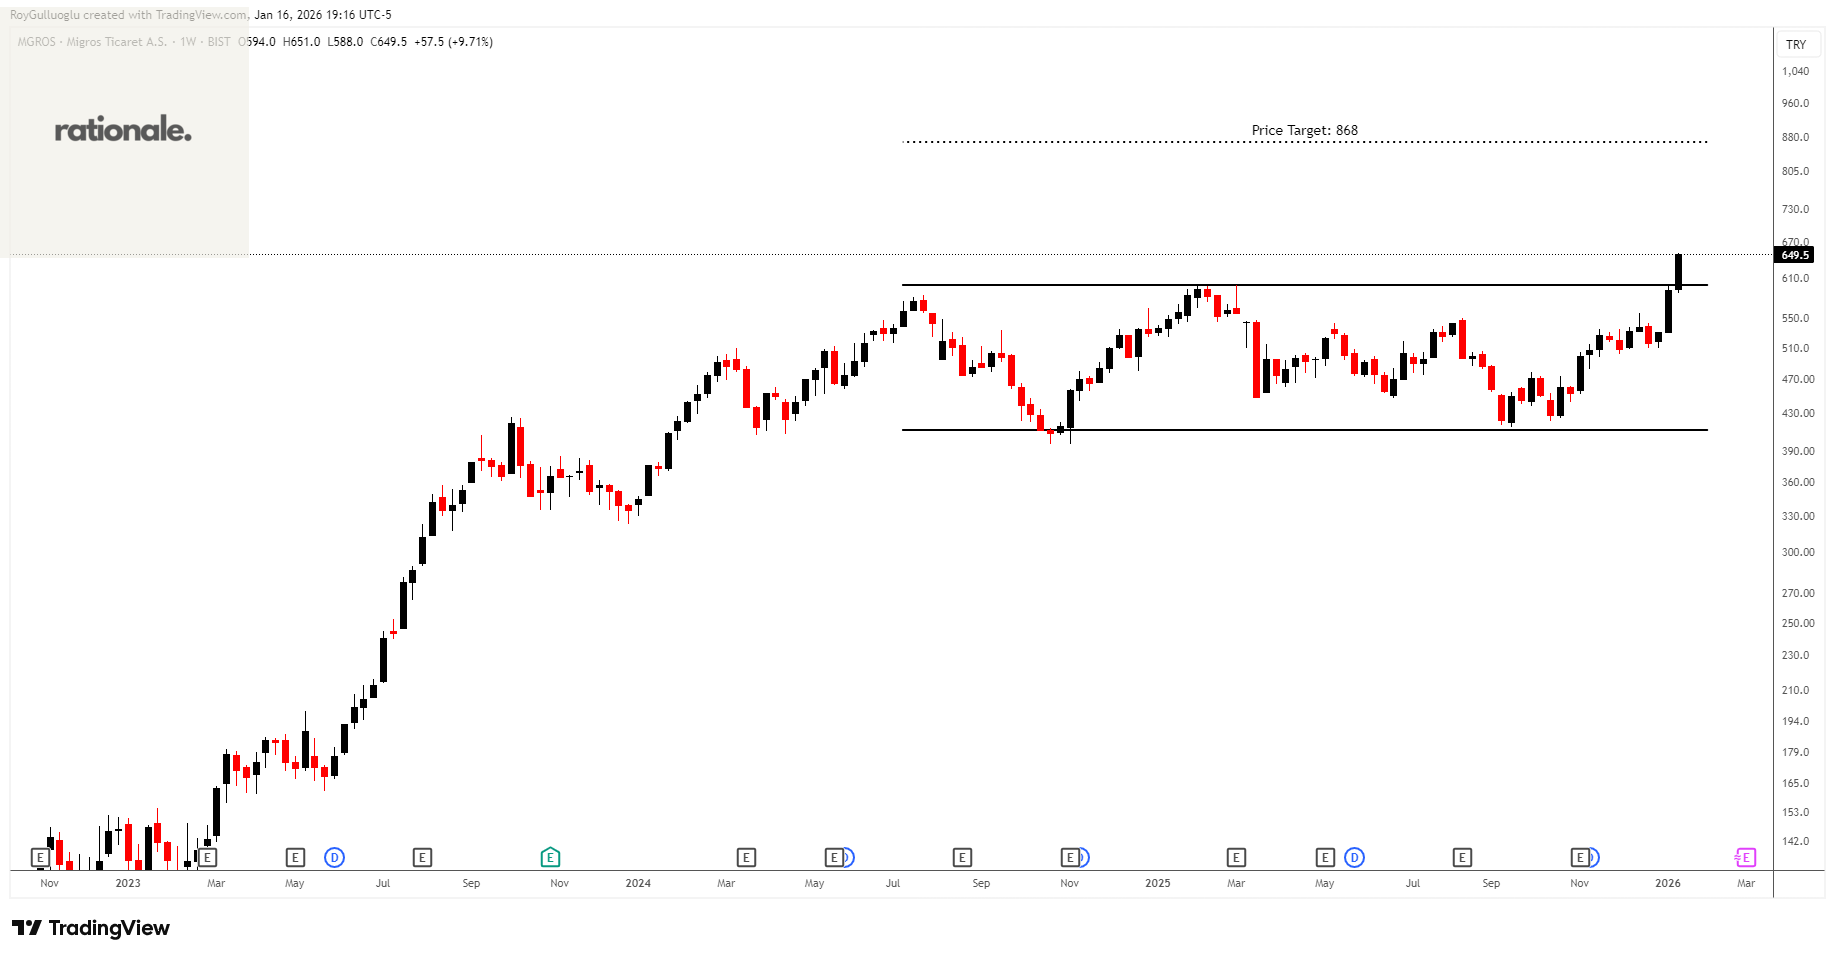
Migros Ticaret A.S. engages in the retail sale of food and beverages, consumer, and durables goods in Turkey. It operates stores under the Migros and Macrocenter names.
The above weekly chart formed an approximately 19-month-long rectangle chart pattern as a bullish reversal after a downtrend.
The horizontal boundary at 599 levels acted as a resistance within this pattern.
A daily close above 617 levels validated the breakout from the 19-month-long rectangle chart pattern.
Based on this chart pattern, the potential price target is 868 levels.
Alarko Holding A.S. -(ALARK/BIST)-Long Idea
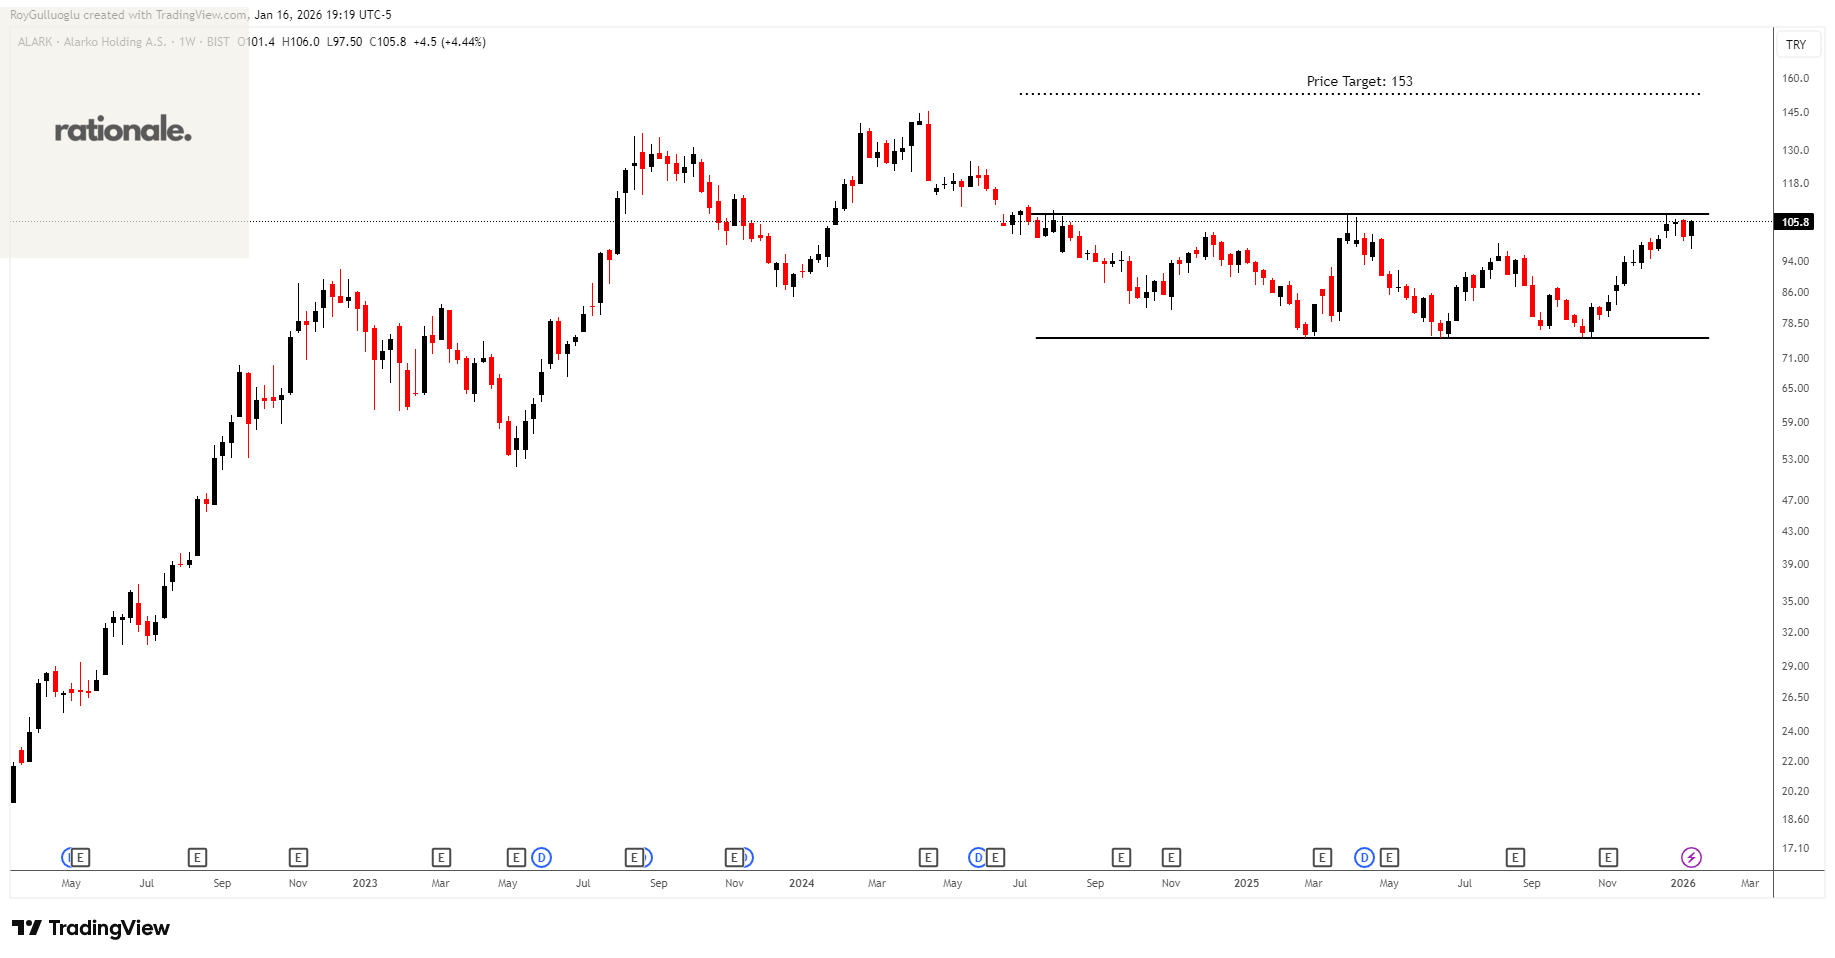
Alarko Holding A.S., together with its subsidiaries, engages in contracting, energy, industry and trade, tourism, land development, investment, and agriculture businesses in Turkey.
The above weekly chart formed an approximately 19-month-long rectangle chart pattern as a bullish reversal after a downtrend.
The horizontal boundary at 107.8 levels acts as a resistance within this pattern.
A daily close above 111 levels would validate the breakout from the 19-month-long rectangle chart pattern.
Based on this chart pattern, the potential price target is 153 levels.
Teşekkürler Roy