


New setups
TICKERS: INTC(NASDAQ), MTG(NYSE), COO(NASDAQ), ITW(NYSE), ERF(NYSE), KSS(NYSE), GTES(NYSE), ISCTR(BIST), MILS3(BOVESPA), FNTN(XETR), 6855(HK), 300624(SZSE), IDFC(NSE)
Intel Corporation-(INTC/NASDAQ)-Long/Short Idea
Intel Corporation engages in the global design, development, manufacturing, marketing, and sale of computing and associated products and services. The company is structured into segments such as Client Computing Group, Data Center and AI, Network and Edge, Mobileye, and Intel Foundry Services.
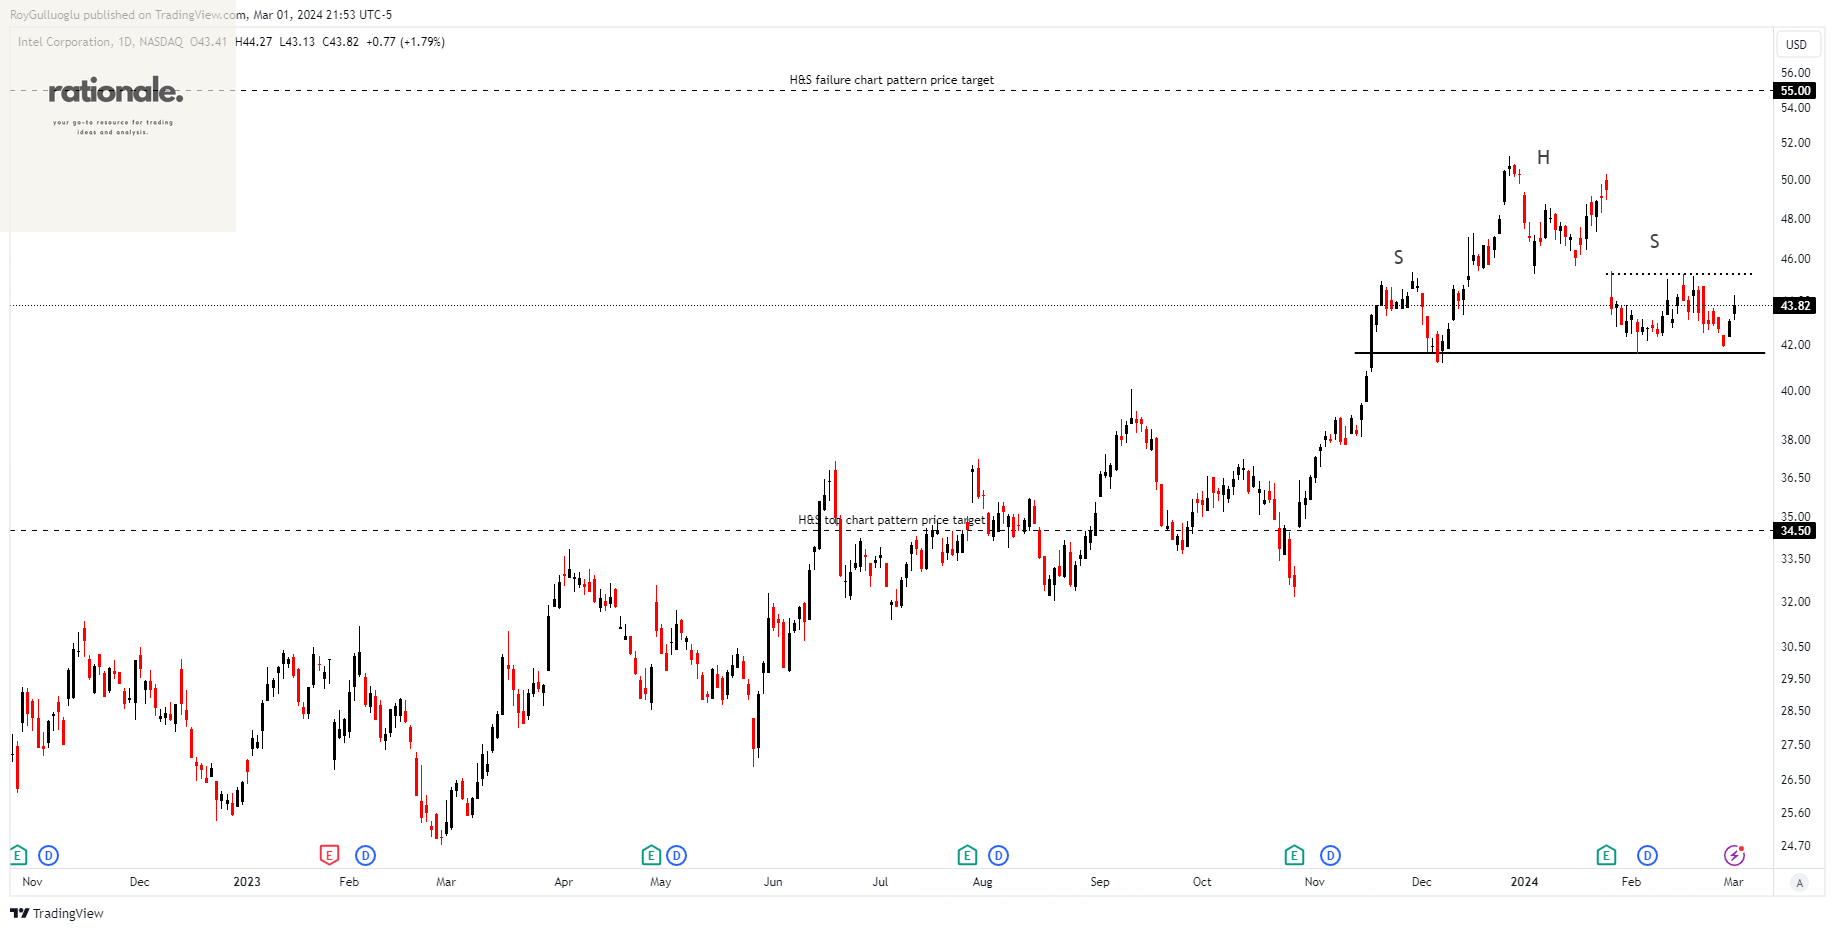
The above daily chart formed an approximately 3-month-long H&S top failure chart pattern as a bullish continuation after an uptrend.
The horizontal boundary at 45.27 levels acts as a resistance within this pattern.
A daily close above 46.62 levels would validate the breakout from the 3-month-long H&S top failure chart pattern.
Based on this chart pattern, the potential price target is 55 levels.
Also, the daily chart might act as an H&S top bearish reversal chart pattern after an uptrend, if we see a breakdown below 40.37 levels. A daily close below the 200-day moving average would be another prerequisite for being bearish on this trade idea.
Based on this chart pattern, the potential price target is 34.5 levels.
INTC, classified under the "technology" sector, falls under the “Large Cap - Growth” stock category.
MGIC Investment Corporation-(MTG/NYSE)-Long Idea
MGIC Investment Corporation and its subsidiaries offer private mortgage insurance, along with additional solutions for managing mortgage credit risk and related services to lenders and government-sponsored entities. Their services are provided across the United States, the District of Columbia, Puerto Rico, and Guam.
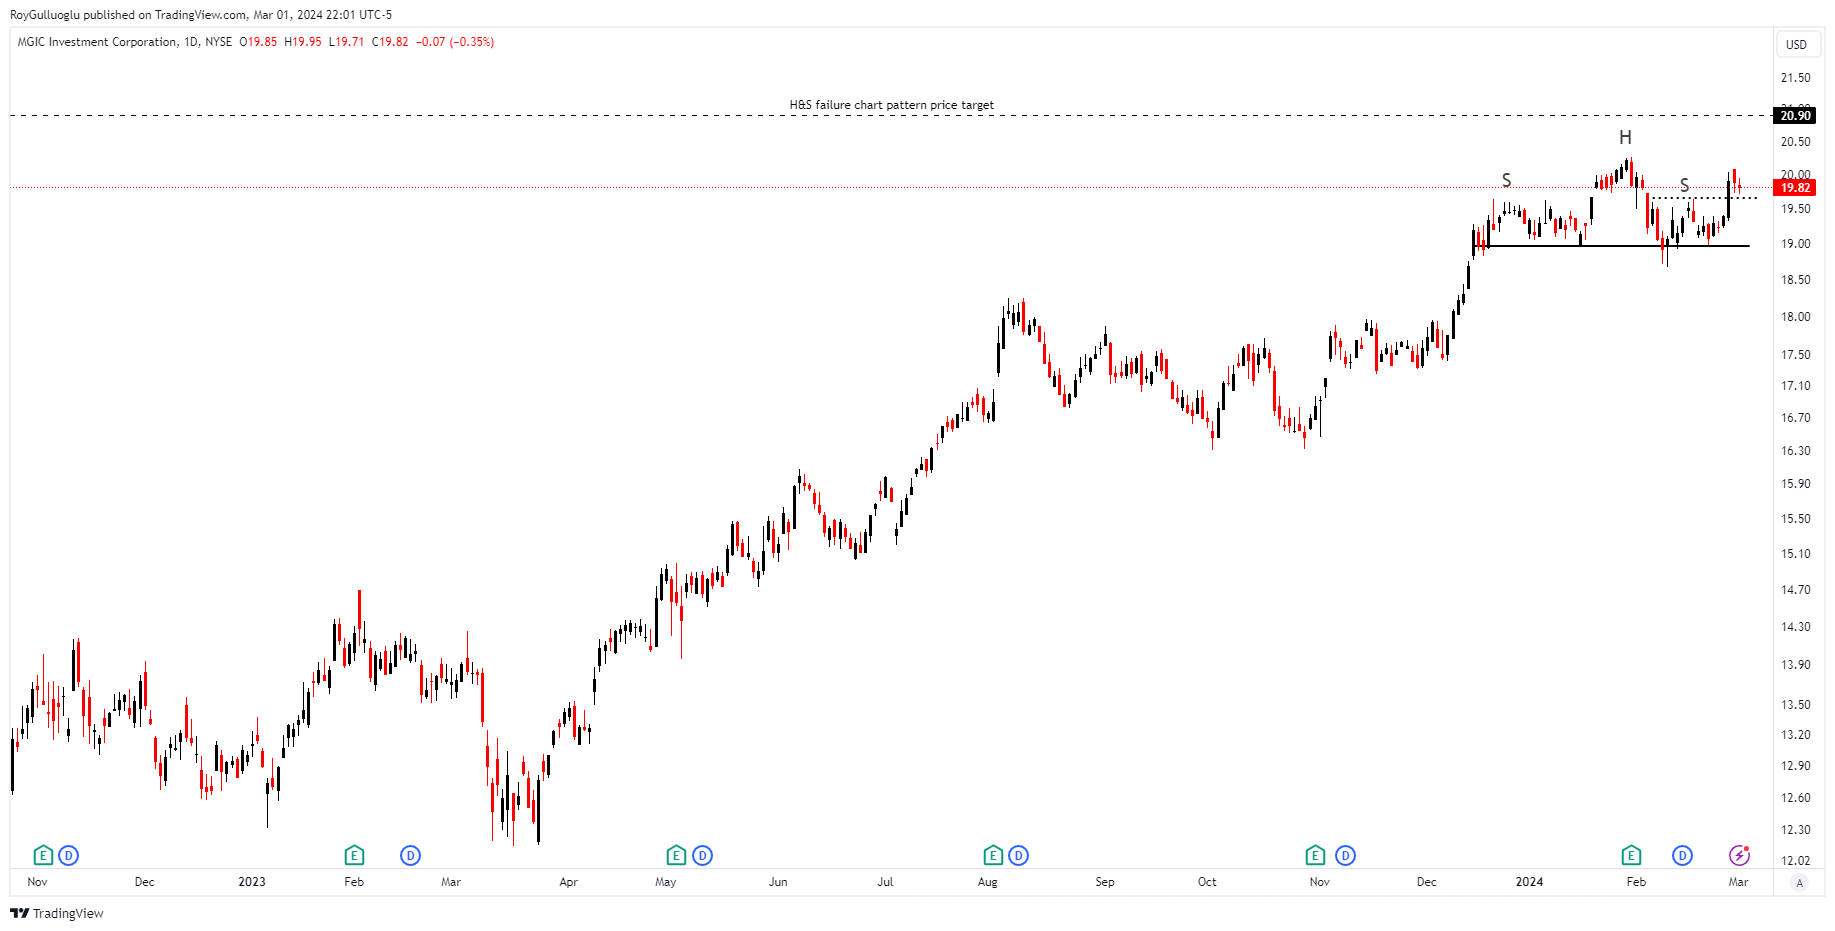
The above daily chart formed an approximately 2-month-long H&S top failure chart pattern as a bullish continuation after an uptrend.
The horizontal boundary at 19.65 levels acts as a resistance within this pattern.
A daily close above 20.24 levels would validate the breakout from the 2-month-long H&S top failure chart pattern.
Based on this chart pattern, the potential price target is 20.9 levels.
MTG, classified under the "financial services" sector, falls under the “Mid Cap - Income” stock category.
The Cooper Companies, Inc.-(COO/NASDAQ)-Long Idea
The Cooper Companies, Inc. and its subsidiaries focus on the development, manufacturing, and marketing of contact lenses for wearers.
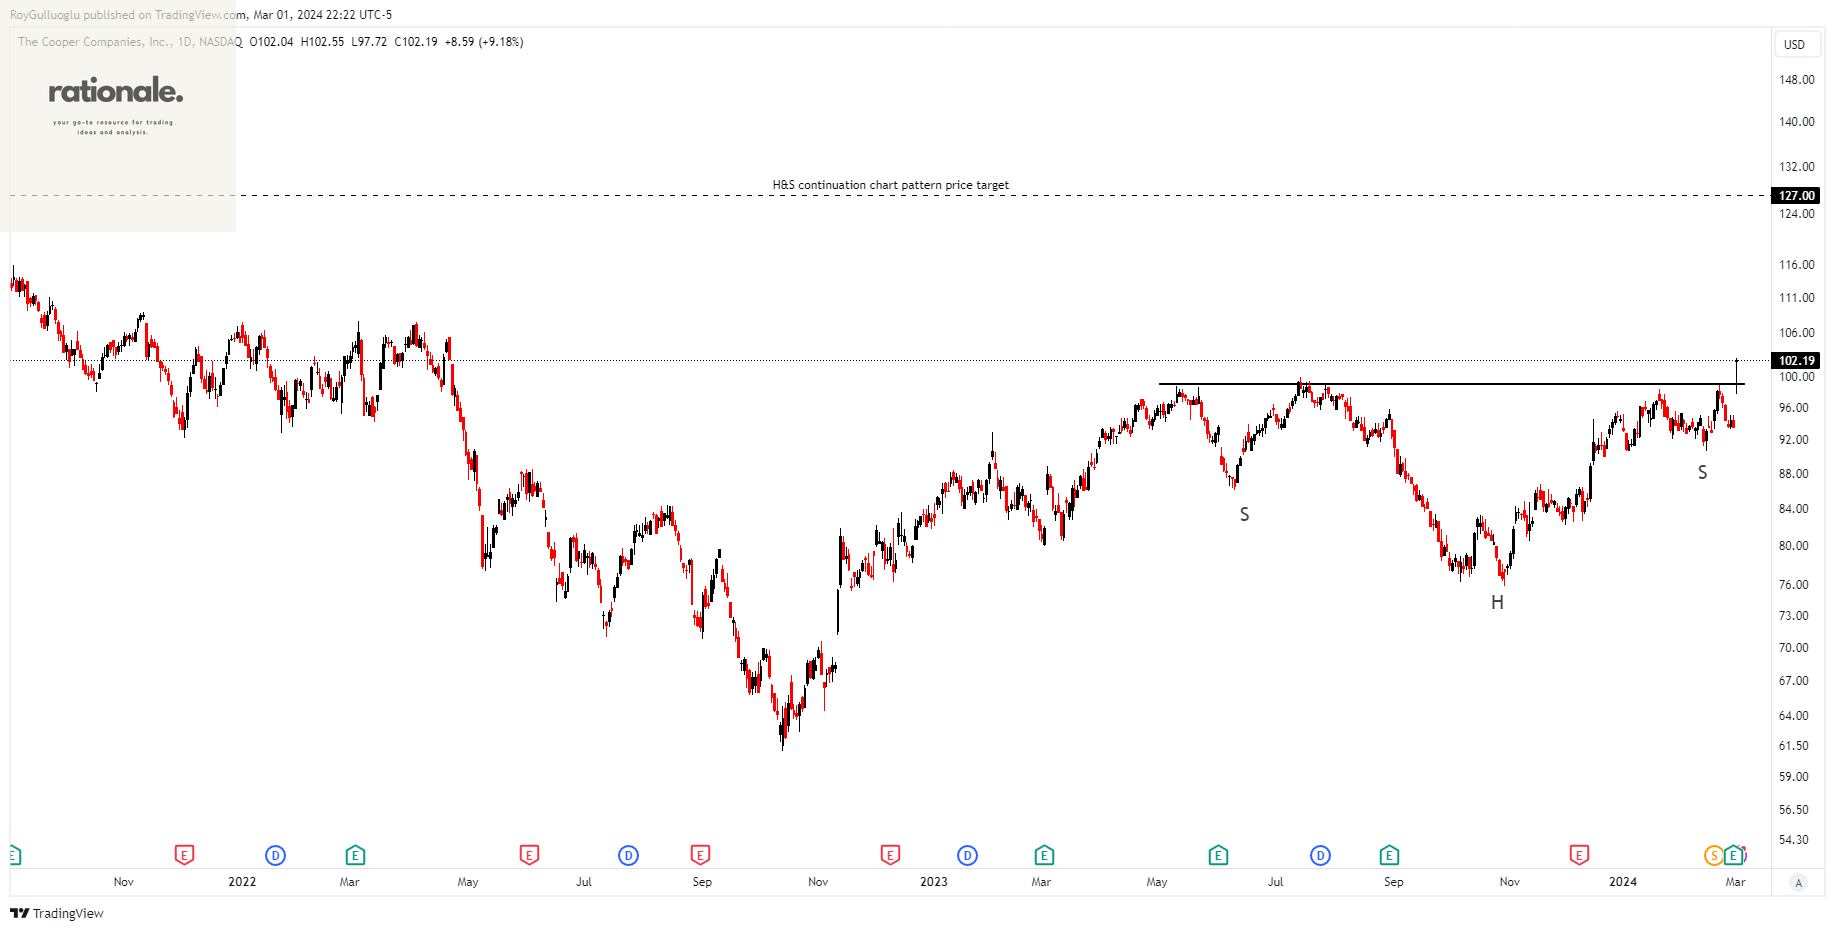
The above daily chart formed an approximately 7-month-long H&S continuation chart pattern as a bullish continuation after an uptrend.
Within this pattern, the horizontal boundary at 99 levels acted as a resistance.
A daily close above 101.97 levels validated the breakout from the 7-month-long H&S continuation chart pattern.
Based on this chart pattern, the potential price target is 127 levels.
COO, classified under the "healthcare" sector, falls under the “Large Cap - Value” stock category.
Illinois Tool Works Inc.-(ITW/NYSE) - Long Idea
Illinois Tool Works Inc. manufactures and sells industrial products and equipment in the United States and internationally.
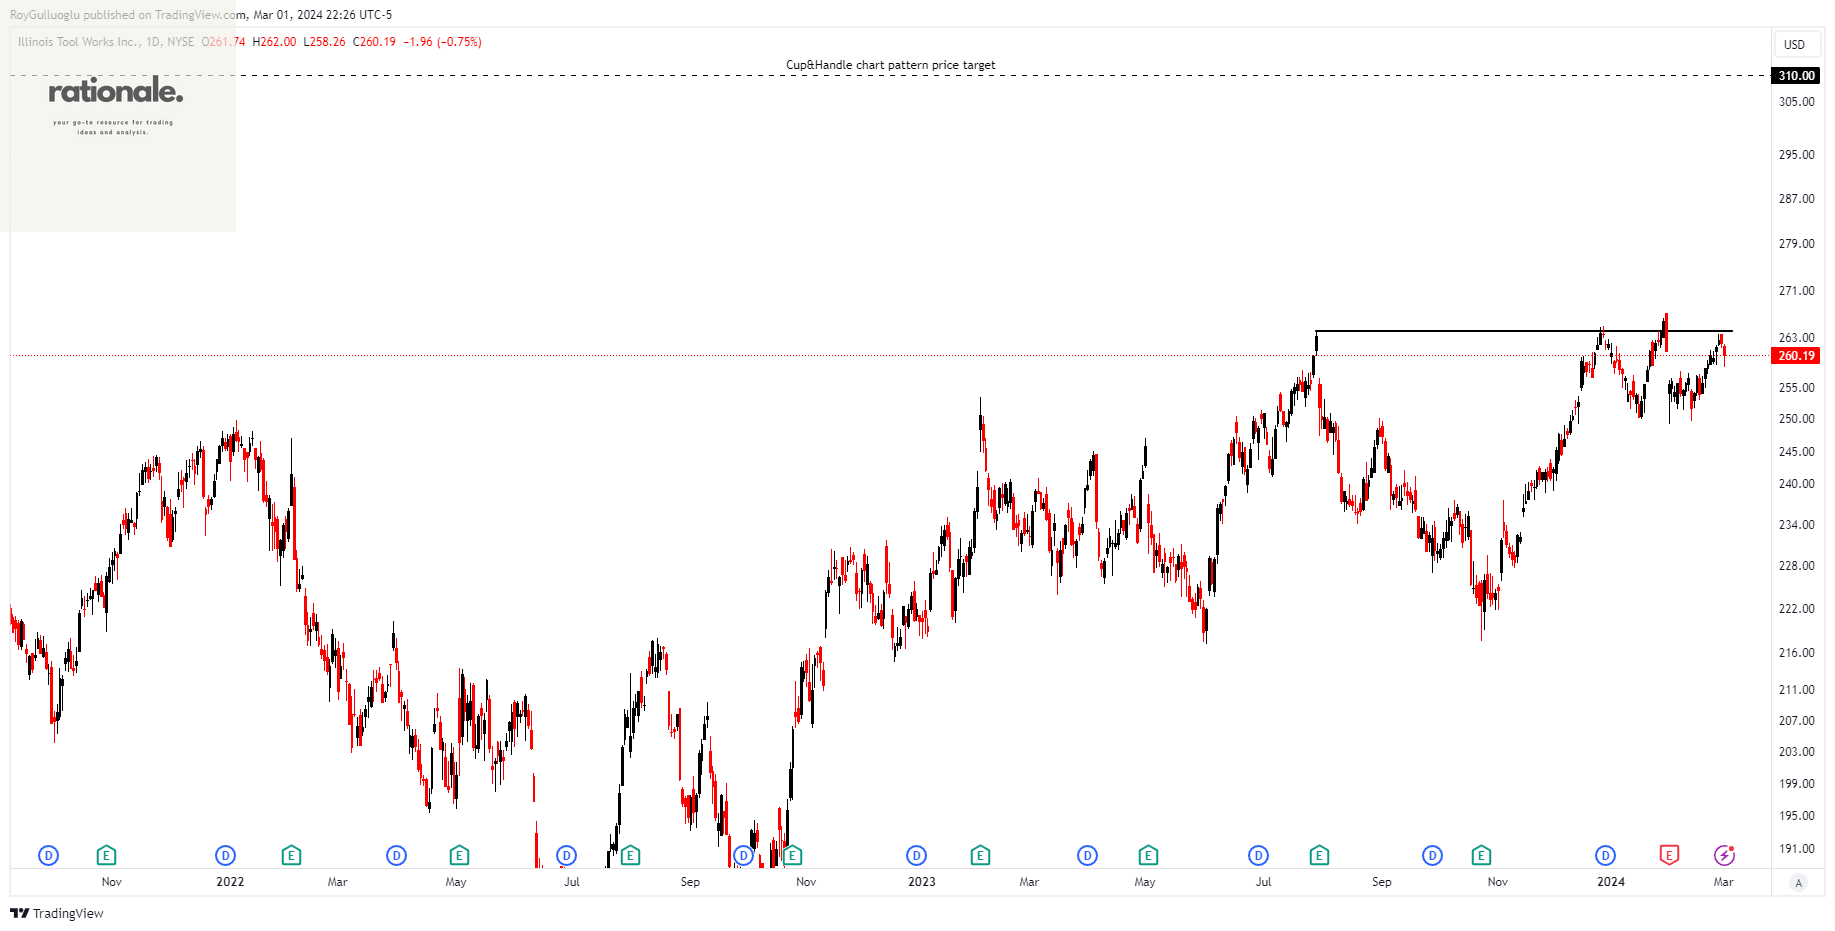
The above daily chart formed an approximately 5-month-long Cup & Handle chart pattern as a bullish continuation after an uptrend
The boundary at 264.19 levels acts as a resistance within this pattern.
A daily close above 272.11 levels would validate the breakout from the 5-month-long Cup & Handle chart pattern.
Based on this chart pattern, the potential price target is 310 levels.
ITW, classified under the "industrials" sector, falls under the “Large Cap - Value” stock category.
Enerplus Corporation-(ERF/NYSE)-Long Idea
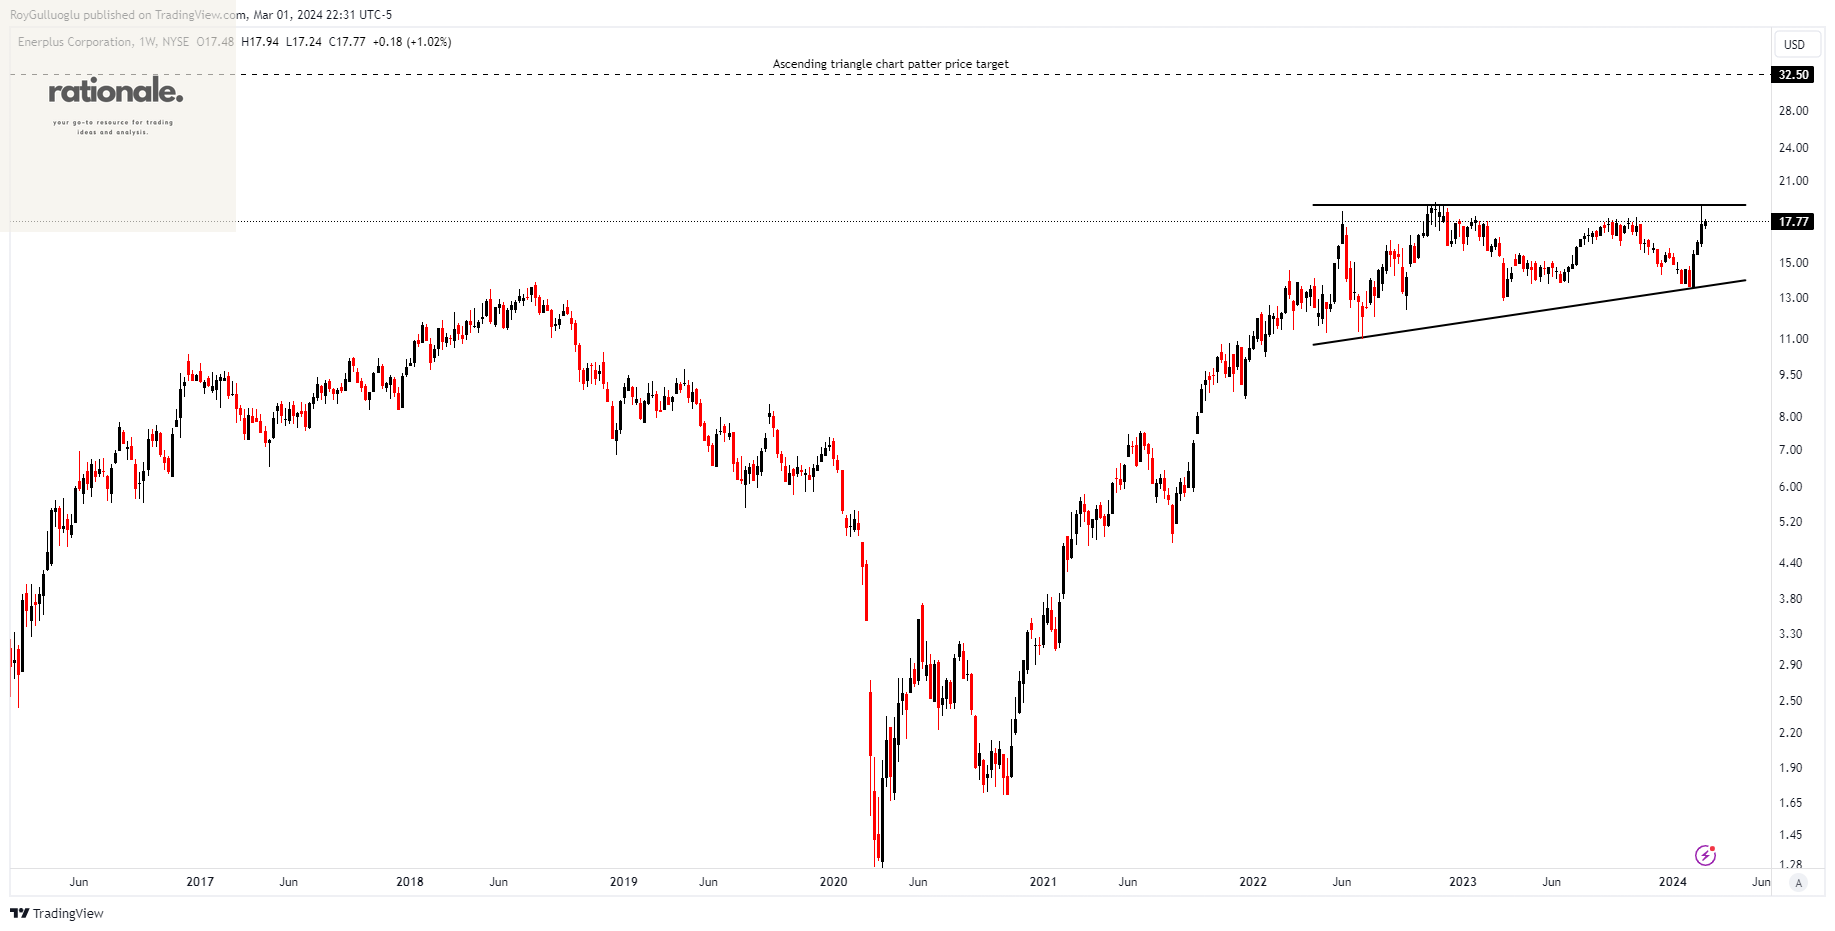
Enerplus Corporation, together with subsidiaries, acquires, develops, and explores crude oil and natural gas in the United States.
The above weekly chart formed an approximately 22-month-long ascending triangle chart pattern as a bullish continuation after an uptrend.
The horizontal boundary at 19 levels acts as a resistance within this pattern.
A daily close above 19.57 levels would validate the breakout from the 22-month-long ascending triangle chart pattern.
Based on this chart pattern, the potential price target is 32.5 levels.
ERF, classified under the "energy" sector, falls under the “Mid Cap - Income” stock category.
Kohls Corporation-(KSS/NYSE)-Long Idea
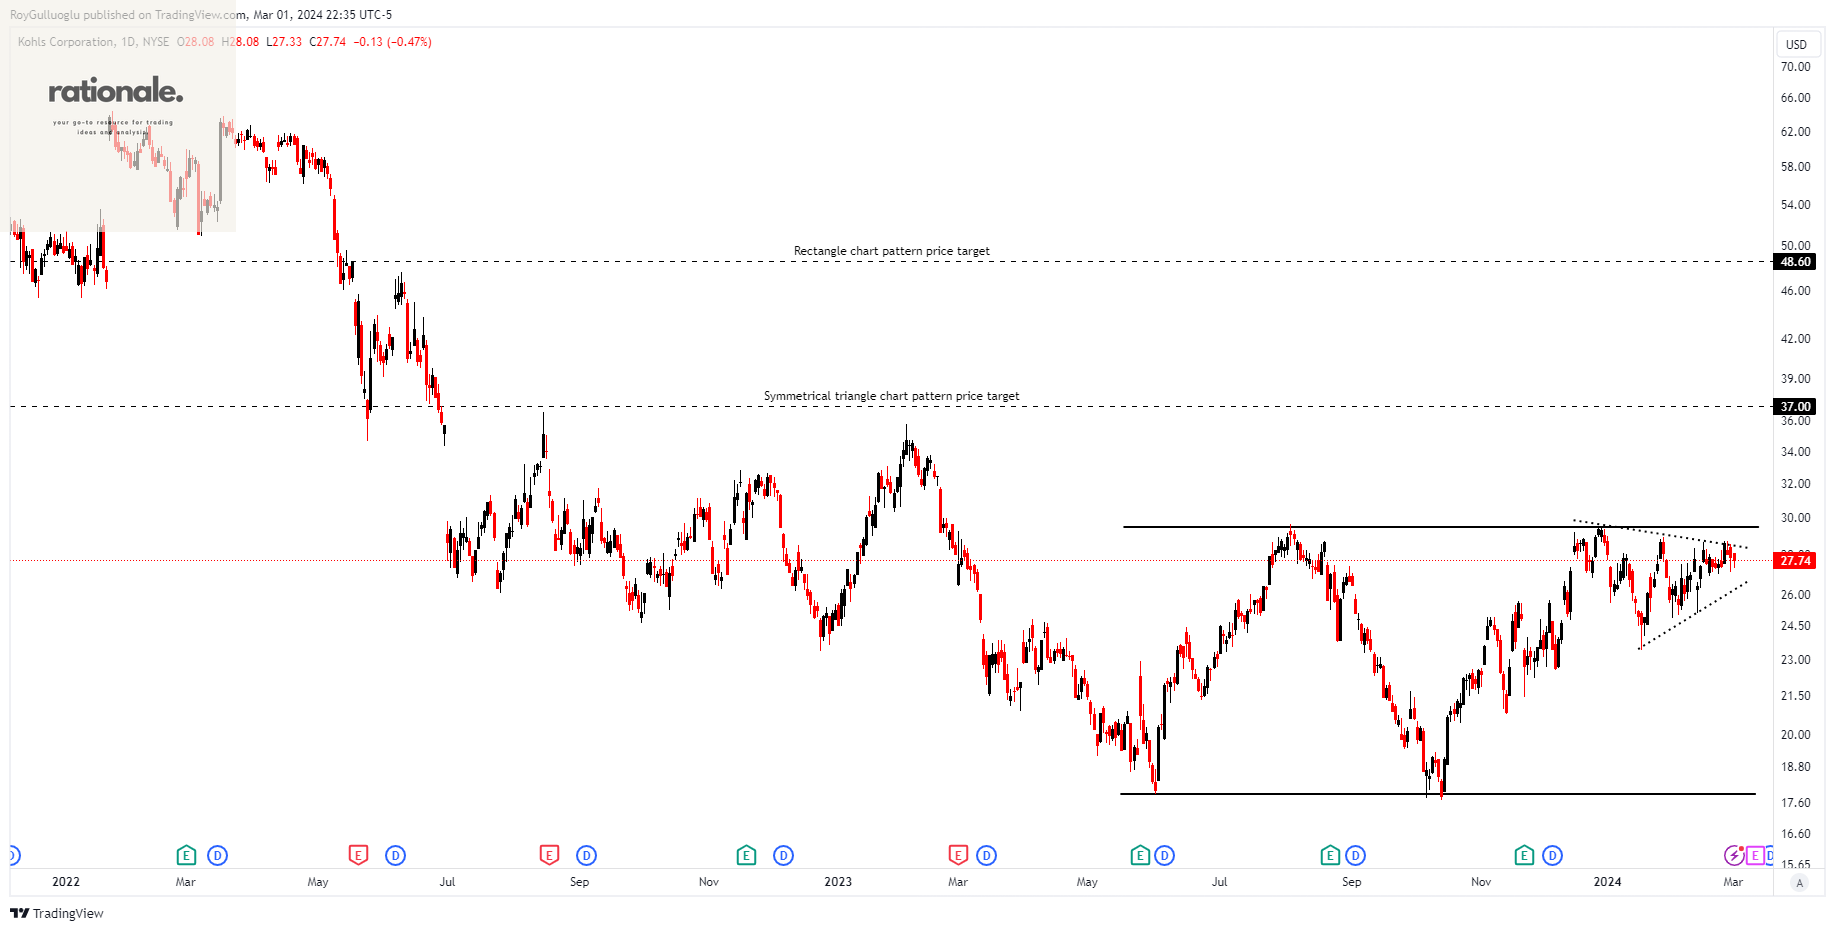
Kohl's Corporation functions as an omnichannel retailer within the United States, providing a range of branded apparel, footwear, accessories, beauty, and home products through both its physical stores and online platforms.
The above daily chart formed approximately a 6-month-long and 2-month-long intertwined rectangle and symmetrical triangle chart patterns as a bullish reversal after a downtrend.
Within this pattern, the horizontal boundary at 29.5 levels acts as a resistance.
A daily close above 30.38 levels would validate the breakout from a 6-month-long rectangle chart pattern.
Based on this chart pattern, the potential price target is 48.6 levels.
Also, a daily close above 29.5 levels would confirm the breakout from the 2
month-long symmetrical triangle chart pattern.
Based on this chart pattern, the potential price target is 37 levels.
KSS, classified under the "consumer cyclicals" sector, falls under the “Mid Cap - Growth” stock category.
Gates Industrials Corporation plc-(GTES/NYSE)-Long Idea
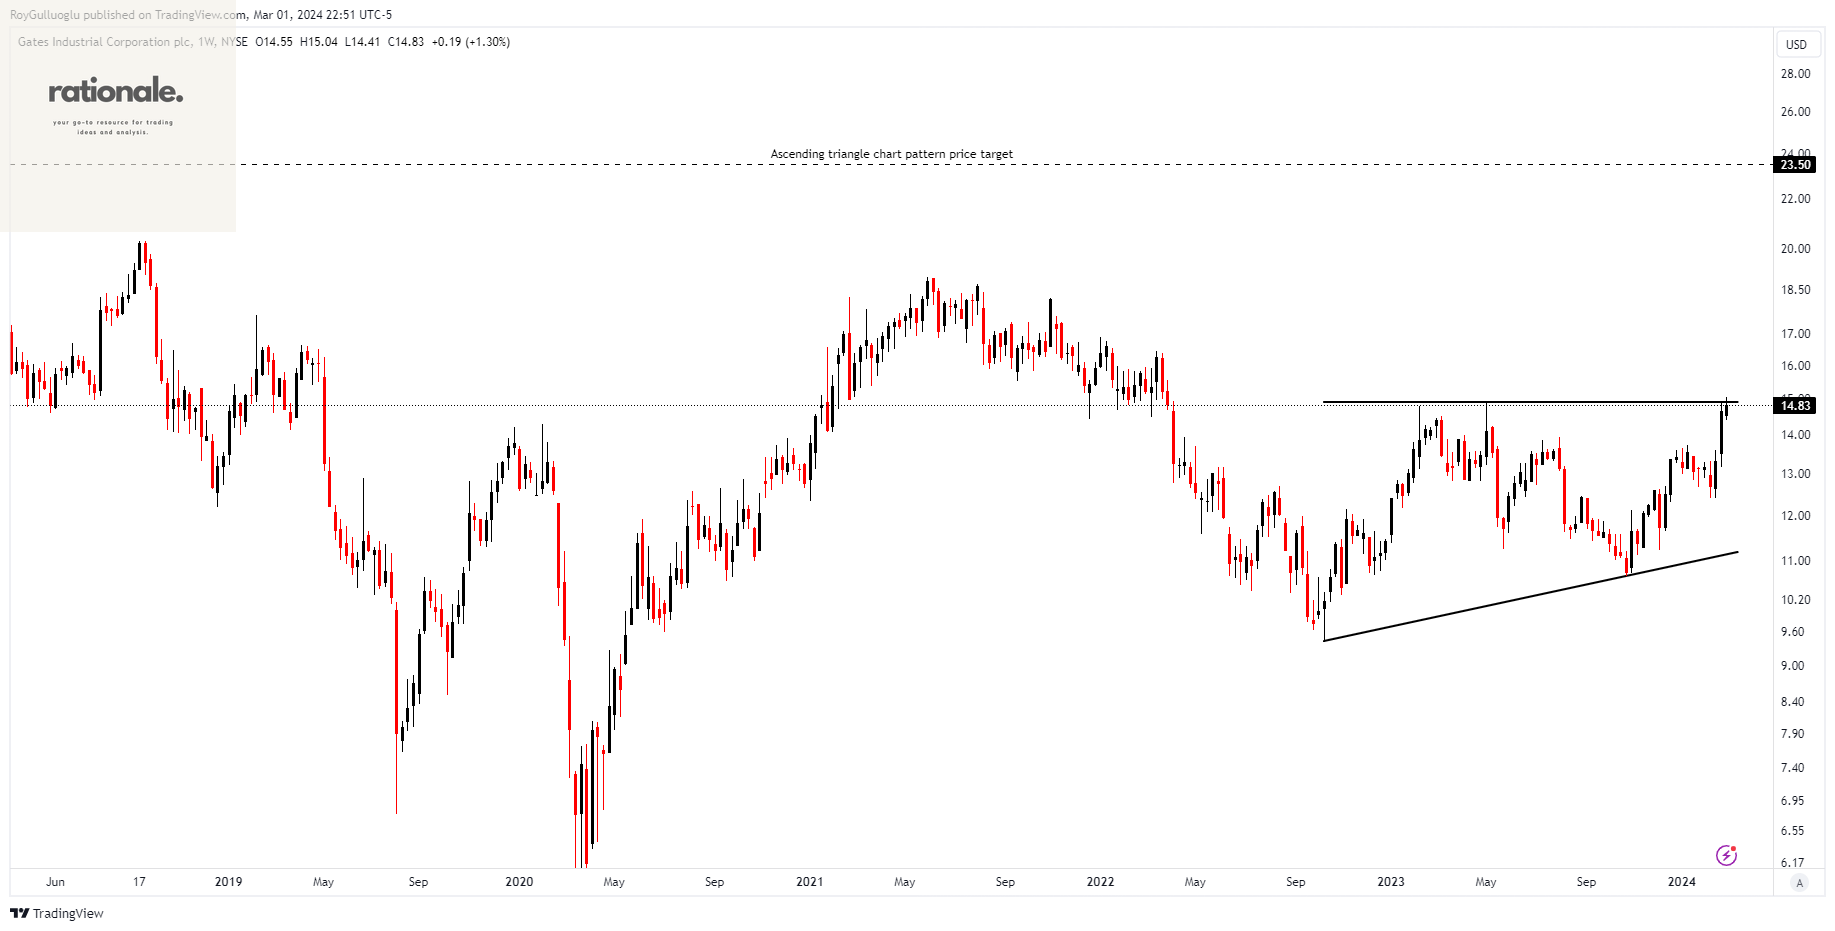
Gates Industrial Corporation plc produces and markets engineered solutions for power transmission and fluid power on a global scale. The company is divided into two segments: Power Transmission and Fluid Power.
The above weekly chart formed an approximately 17-month-long ascending triangle chart pattern as a bullish reversal after a downtrend.
The horizontal boundary at 14.9 levels acts as a resistance within this pattern.
A daily close above 15.35 levels would validate the breakout from the 17-month-long ascending triangle chart pattern.
Based on this chart pattern, the potential price target is 23.5 levels.
GTES, classified under the "industrials" sector, falls under the “Mid Cap - Value” stock category.
IS BANKASI(C)-(ISCTR/BIST)-Long Idea
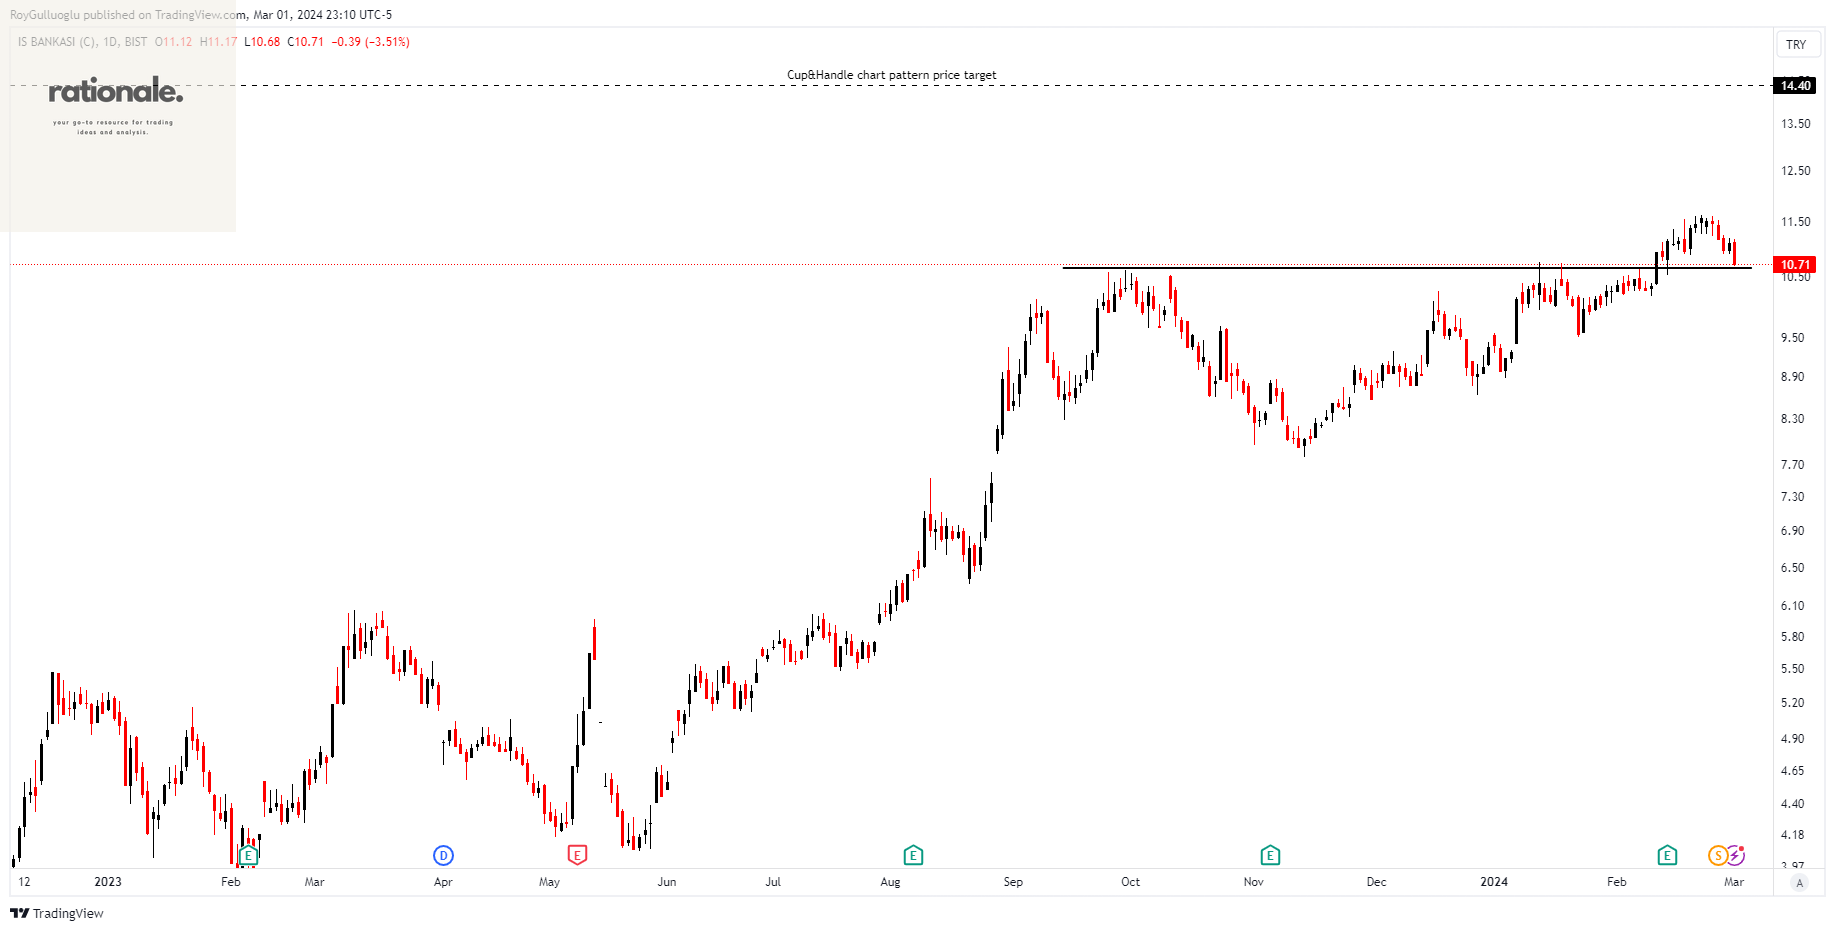
Türkiye İş Bankası A.Ş. delivers a diverse range of banking products and services within Turkey. The company provides personal, car, home, cash, and non-cash loans, along with debit and credit cards. Additionally, it offers a variety of deposit and investment products, including mutual funds, gold, term deposits, non-term deposits, debt instruments, equities, warrants, Eurobonds, and services related to the futures and options market.
The above daily chart formed an approximately 3-month-long Cup & Handle chart pattern as a bullish continuation after an uptrend.
The horizontal boundary at 10.71 levels acted as a resistance within this pattern.
A daily close above 11.03 levels validated the breakout from the 3-month-long Cup & Handle chart pattern. The price pulled back to the resistance level.
Based on this chart pattern, the potential price target is 14.40 levels.
ISCTR, classified under the "financial services" sector, falls under the “Mid Cap - Income” stock category.
MILLS ON NM-(MILS3/BMFBOVESPA)-Long Idea
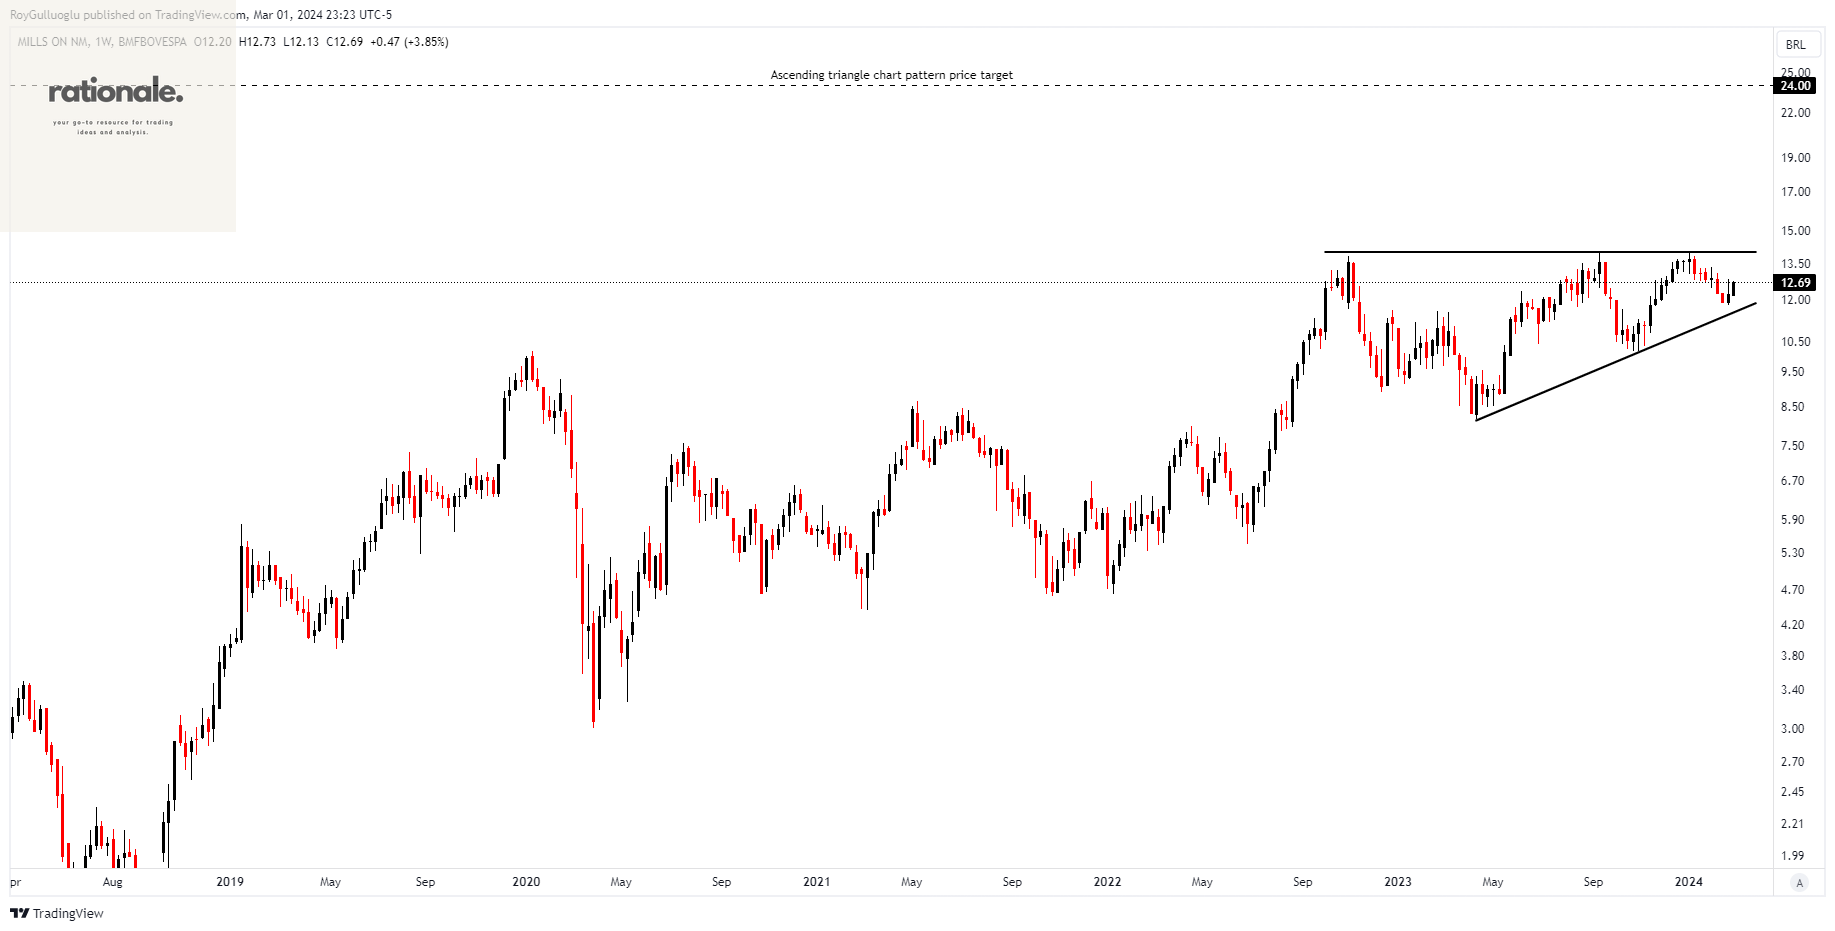
Mills Locação, Serviços e Logística S.A. functions as a machinery and equipment rental company in Brazil. The company is involved in the rental, sale, import, and export of steel and aluminum tubular structures, shoring, access equipment for construction projects, and reusable concrete formworks. Mills also engages in the development of associated engineering projects and offers supervisory and optional assembly services.
The above weekly chart formed an approximately 15-month-long ascending triangle chart pattern as a bullish continuation after an uptrend.
The horizontal boundary at 14 levels acts as a resistance within this pattern.
A daily close above 14.42 levels would validate the breakout from the 15-month-long ascending triangle chart pattern.
Based on this chart pattern, the potential price target is 24 levels.
MILS3, classified under the "industrials" sector.
Freenet AG-(FNTN/XETR)-Long Idea
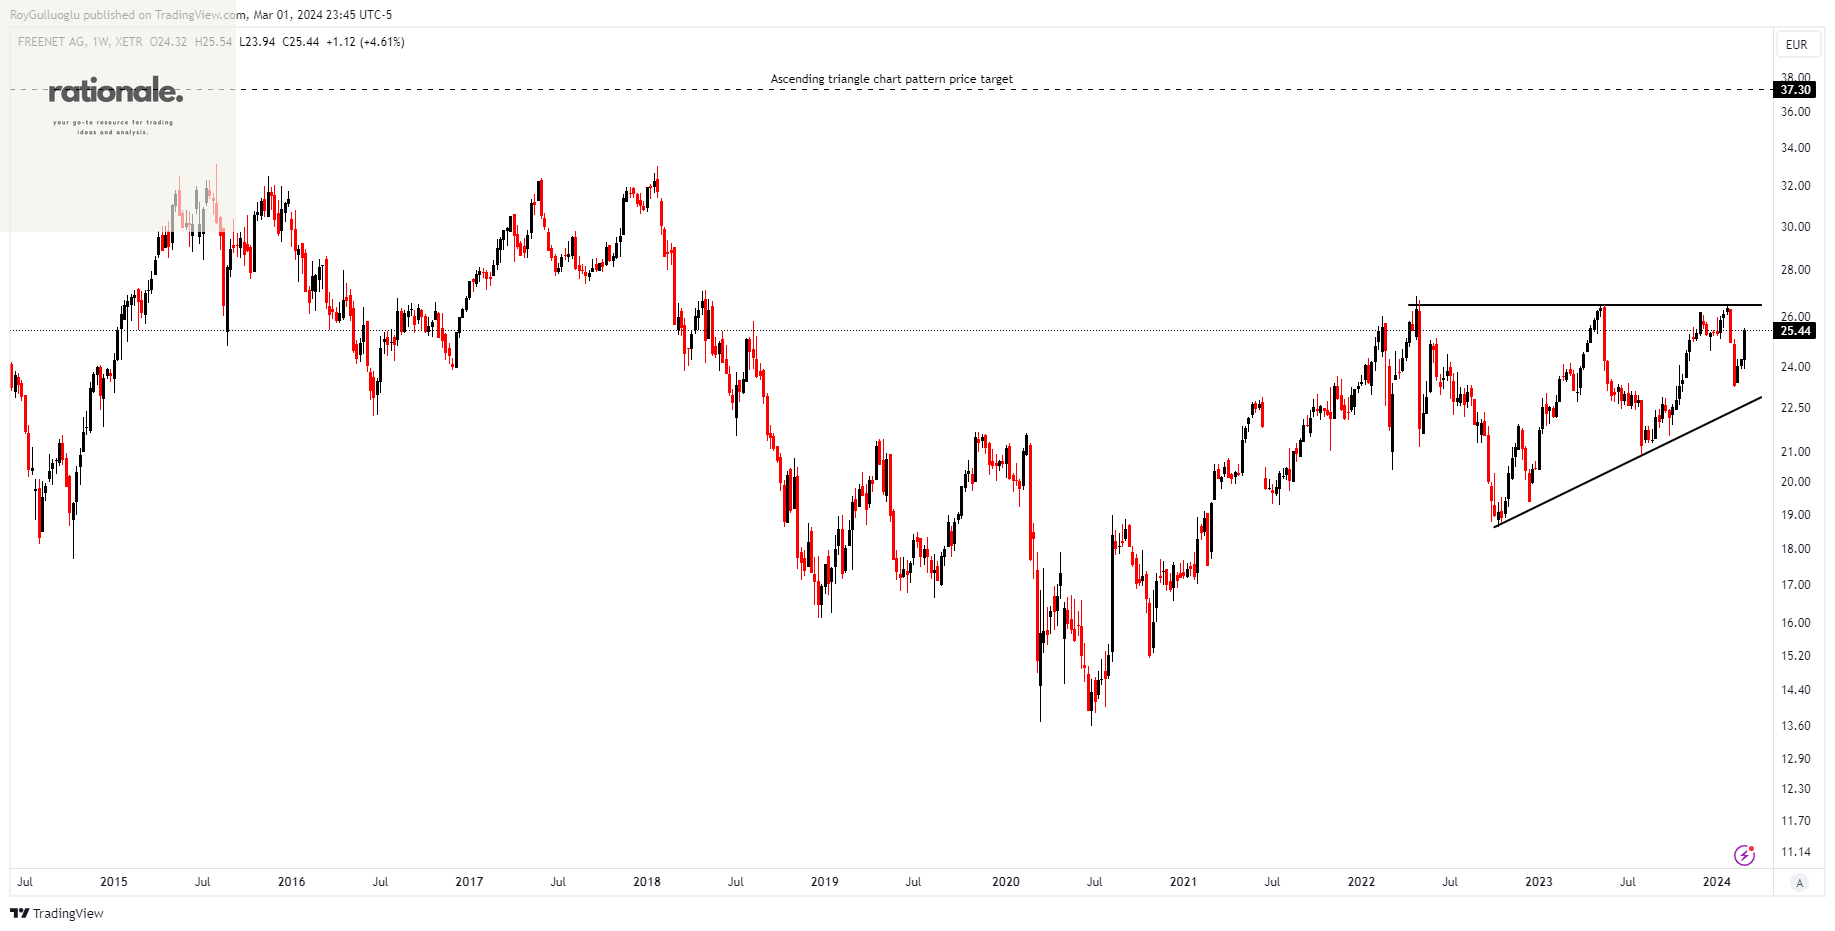
Freenet AG delivers telecommunications, radio and multimedia, mobile communications, mobile Internet, and digital lifestyle services within Germany.
The above daily chart formed an approximately 22-month-long ascending triangle chart pattern as a bullish continuation after an uptrend.
The horizontal boundary at 26.46 levels acts as a resistance within this pattern.
A daily close above 27.25 levels would validate the breakout from the 22-month-long ascending triangle chart pattern.
Based on this chart pattern, the potential price target is 37.3 levels.
FNTN, classified under the "communication services" sector, falls under the “Mid Cap - Growth” stock category.
Ascentage Pharma Group International-(6855/HKEX)-Long Idea
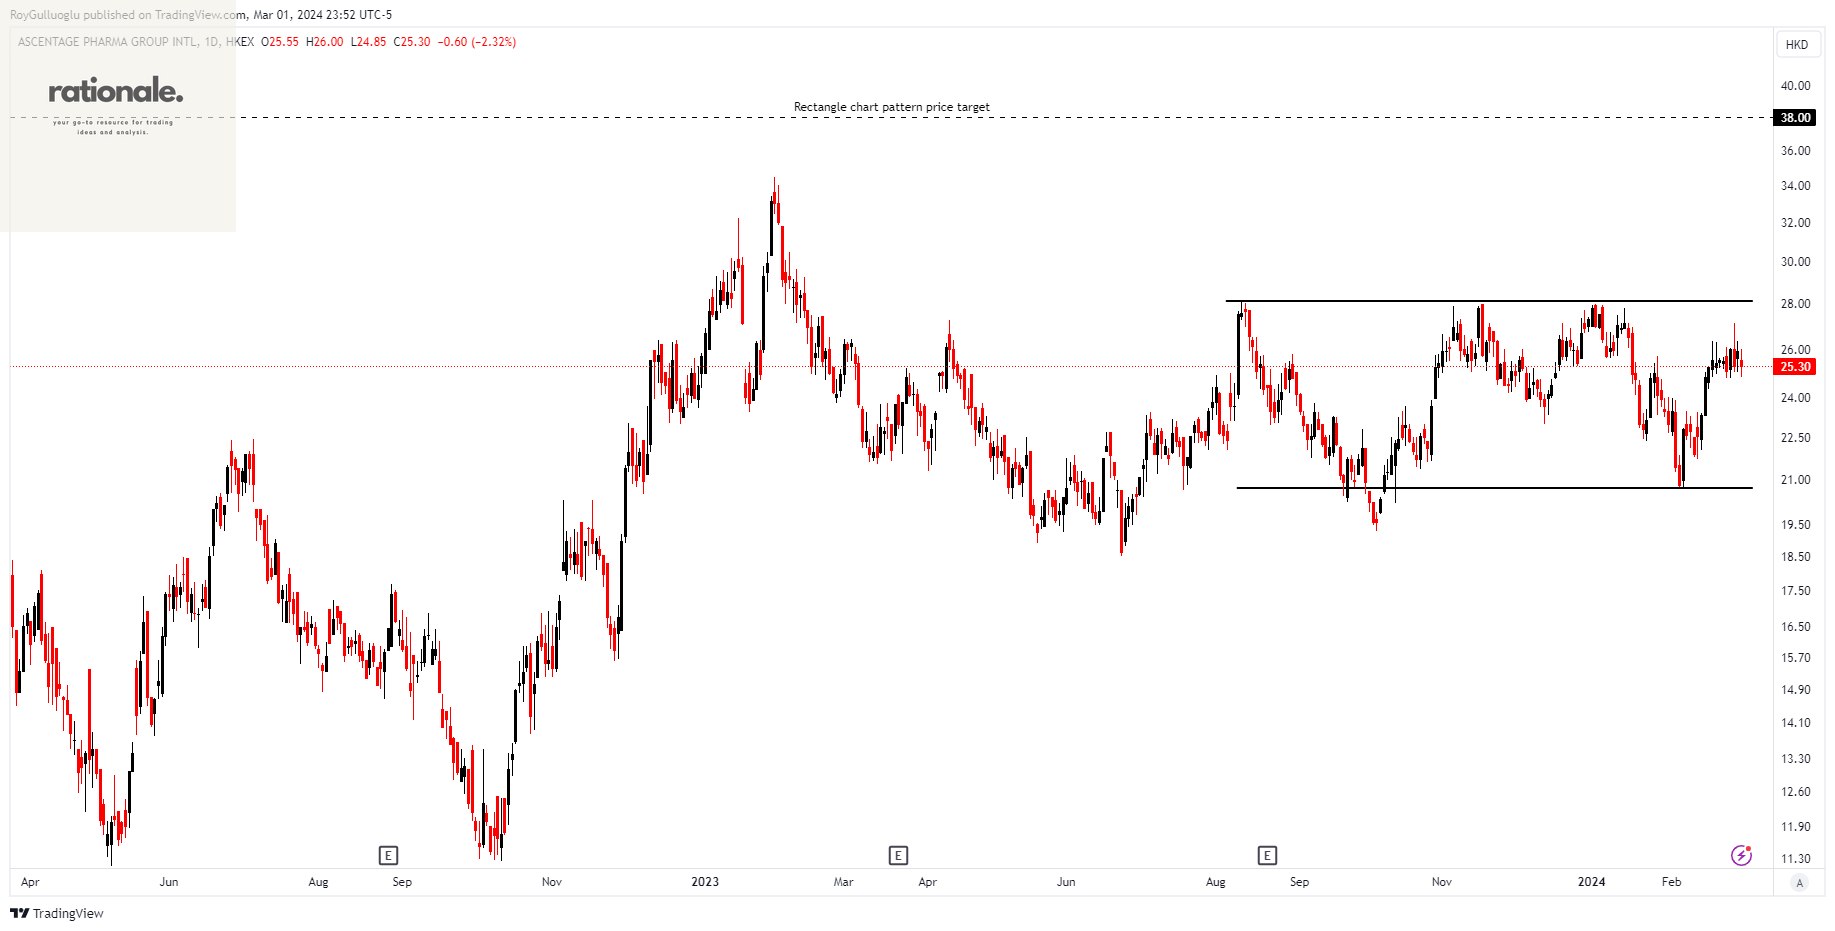
Ascentage Pharma Group International, a clinical-stage biotechnology company, is dedicated to the development of therapies for cancers, chronic hepatitis B virus (HBV), and age-related diseases in both the United States and Mainland China.
The above daily chart formed an approximately 4-month-long rectangle chart pattern as a bullish reversal after a downtrend.
The horizontal boundary at 28.15 levels acts as a resistance within this pattern.
A daily close above 29 levels would validate the breakout from the 4-month-long rectangle chart pattern.
Based on this chart pattern, the potential price target is 38 levels.
6855, classified under the "healthcare" sector, falls under the “Small Cap - Value” stock category.
Wondershare Technology Group Co-(300624/SZSE)-Long Idea
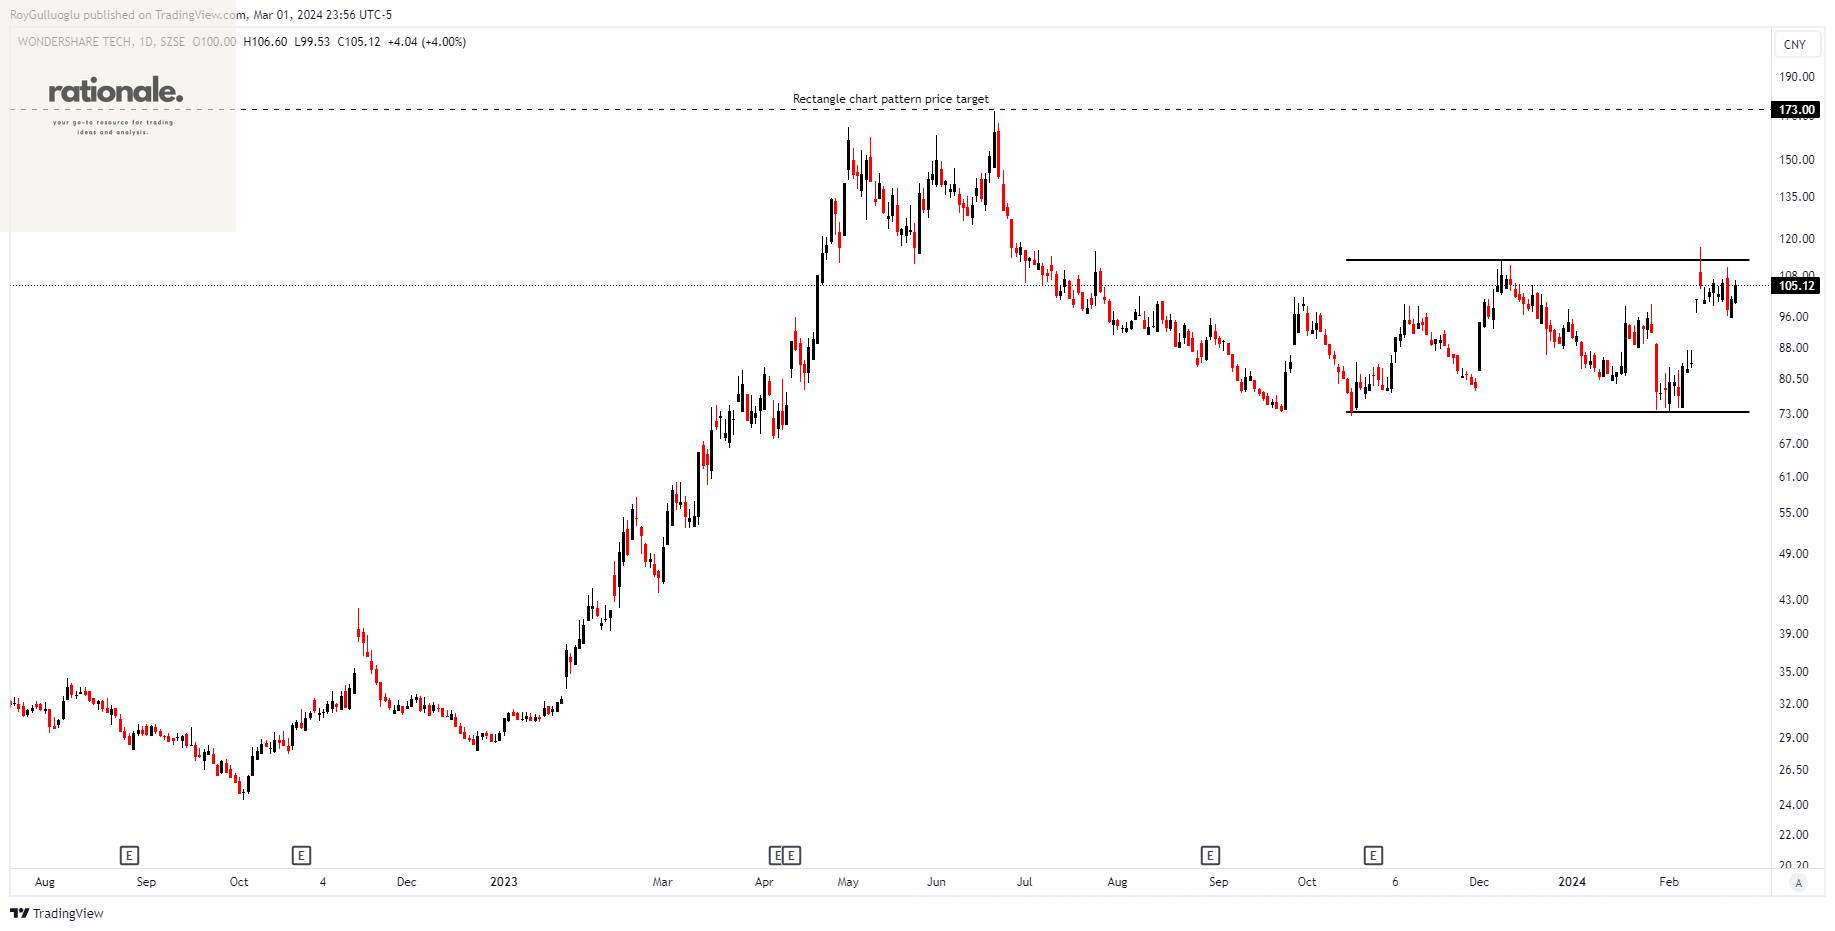
Wondershare Technology Group Co., Ltd. develops application software products in China and internationally.
The above daily chart formed an approximately 3-month-long rectangle chart pattern as a bullish reversal after a downtrend.
The horizontal boundary at 112.7 levels acts as a resistance within this pattern.
A daily close above 116 levels would validate the breakout from the 3-month-long rectangle chart pattern.
Based on this chart pattern, the potential price target is 173 levels.
300624, classified under the "technology" sector, falls under the “Small Cap - Growth” stock category.
IDFC LTD-(IDFC/NSE)-Short Idea
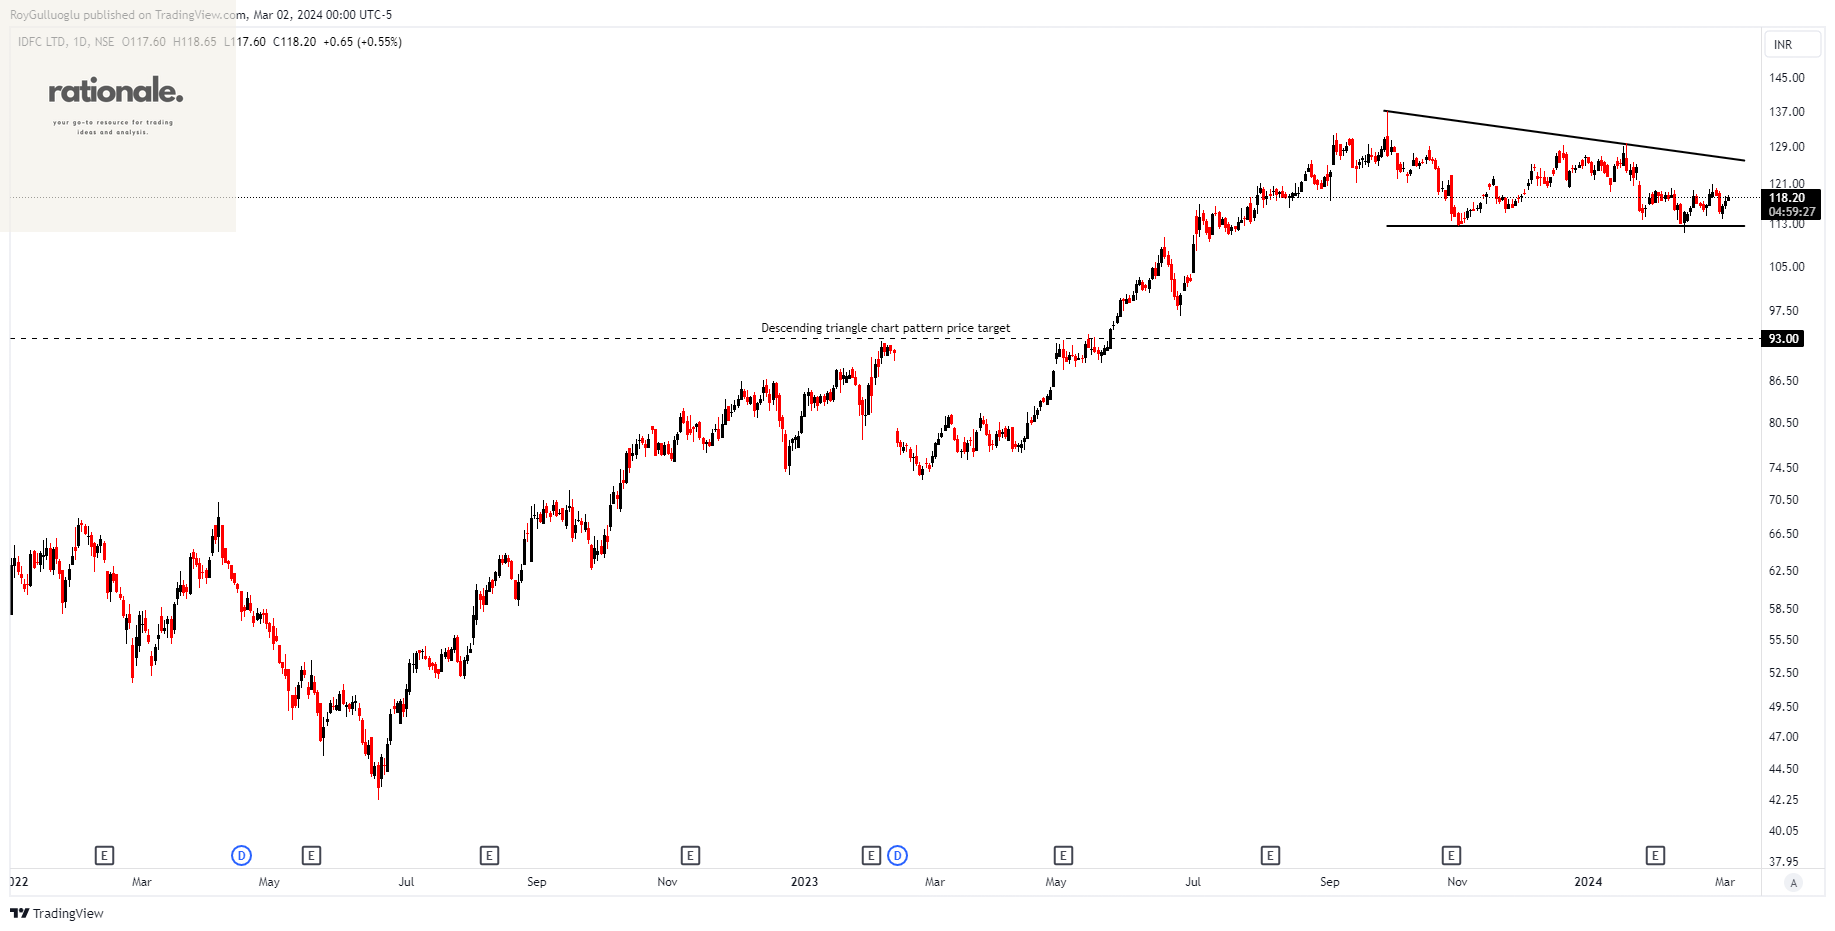
IDFC Limited, along with its subsidiaries, functions as a non-banking financial investment company in India. The company, via its subsidiary IDFC Financial Holding Company Limited, has investments in IDFC FIRST Bank.
The above daily chart formed an approximately 3-month-long descending triangle chart pattern as a bearish reversal after an uptrend.
The horizontal boundary at 112.55 levels acts as a support within this pattern.
A daily close below 109.18 levels would validate the breakdown from the 3-month-long descending triangle chart pattern.
Based on this chart pattern, the potential price target is 93 levels.
IDFC, classified under the "financial services" sector, falls under the “Small Cap - Income” stock category.
THNX