


Rhythm Pharmaceuticals, Inc.-(RYTM/NASDAQ)-Long Idea
Rhythm Pharmaceuticals, Inc., a commercial-stage biopharmaceutical company, focuses on the rare neuroendocrine diseases in the United States and internationally.
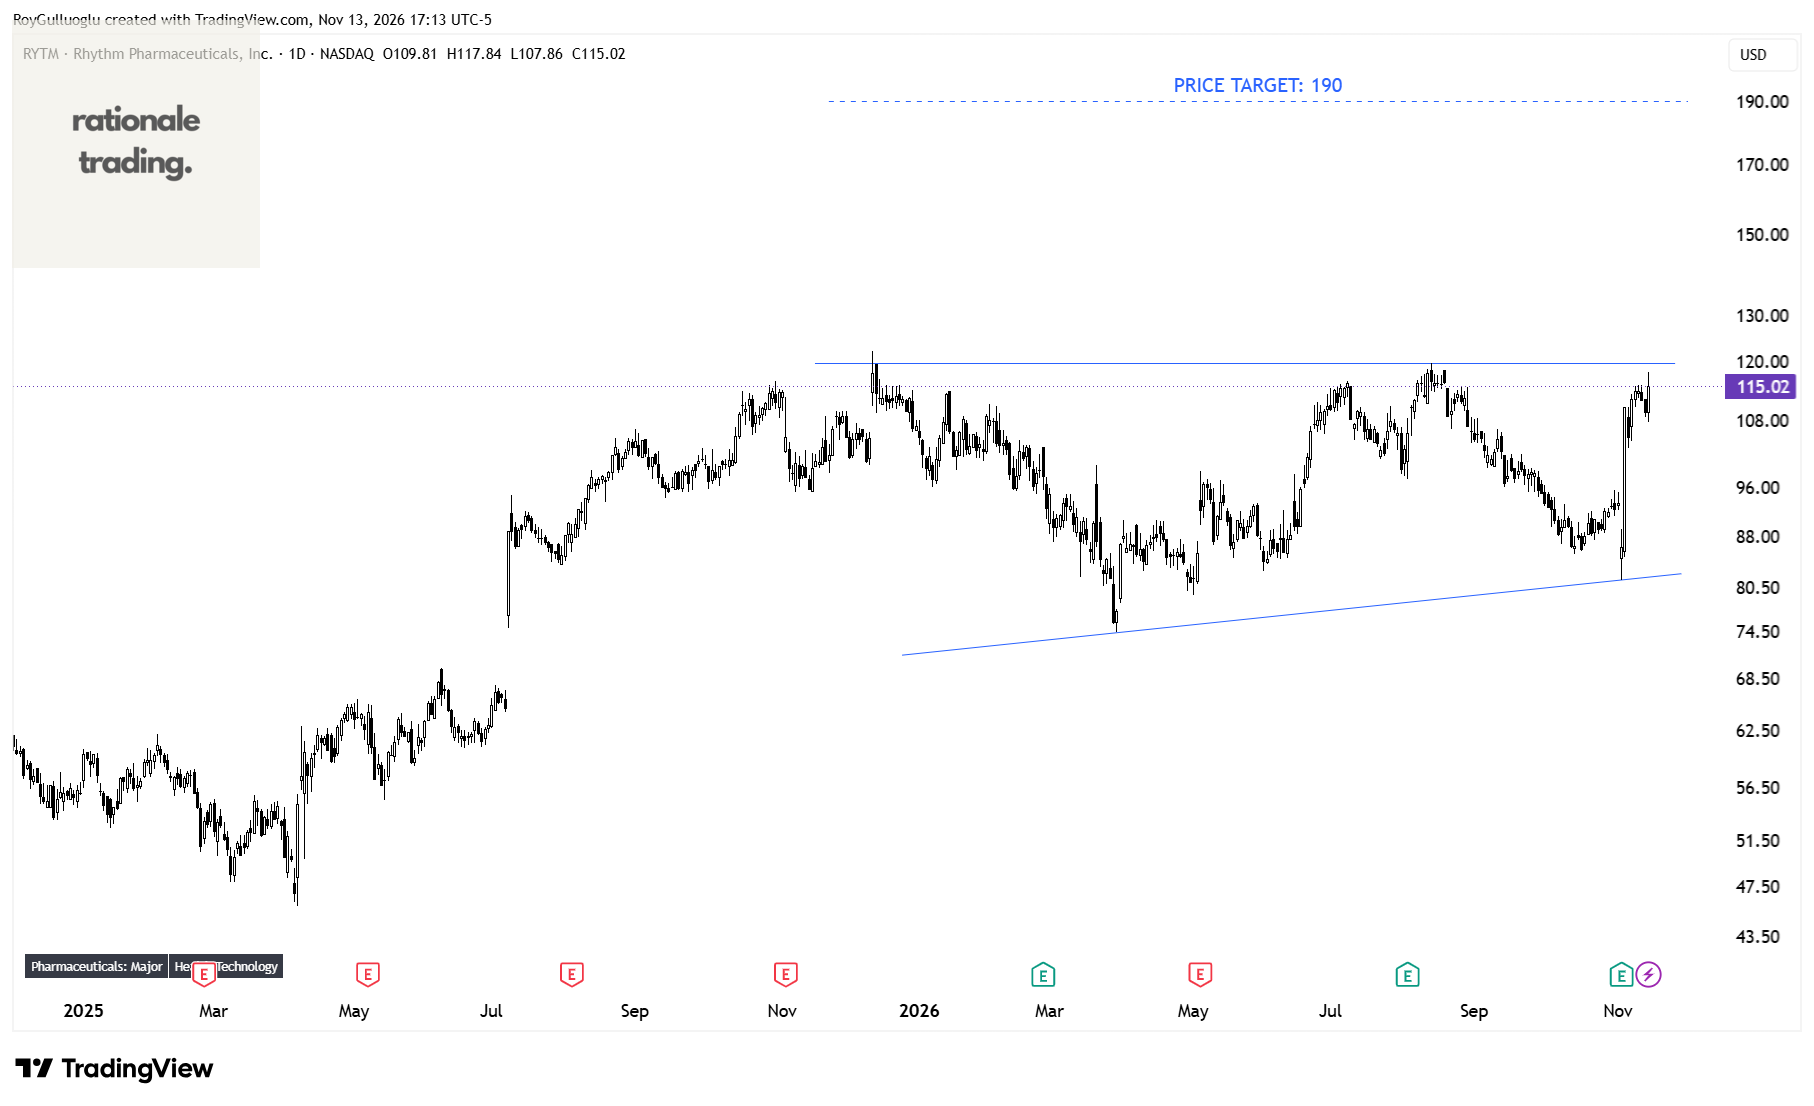
The above daily chart formed an approximately 8-month-long ascending triangle chart pattern as a bullish continuation after an uptrend.
Within this pattern, the horizontal boundary at 119.75 levels acts as a resistance.
A daily close above 123.3 levels would validate the breakout from the 8-month-long ascending triangle chart pattern.
Based on this chart pattern, the potential price target is 190 levels.
Ferguson Enterprises Inc.-(FERG/NYSE)-Long Idea
Ferguson Enterprises Inc. distributes essential water and air solutions to specialized professional in the United States and Canada.
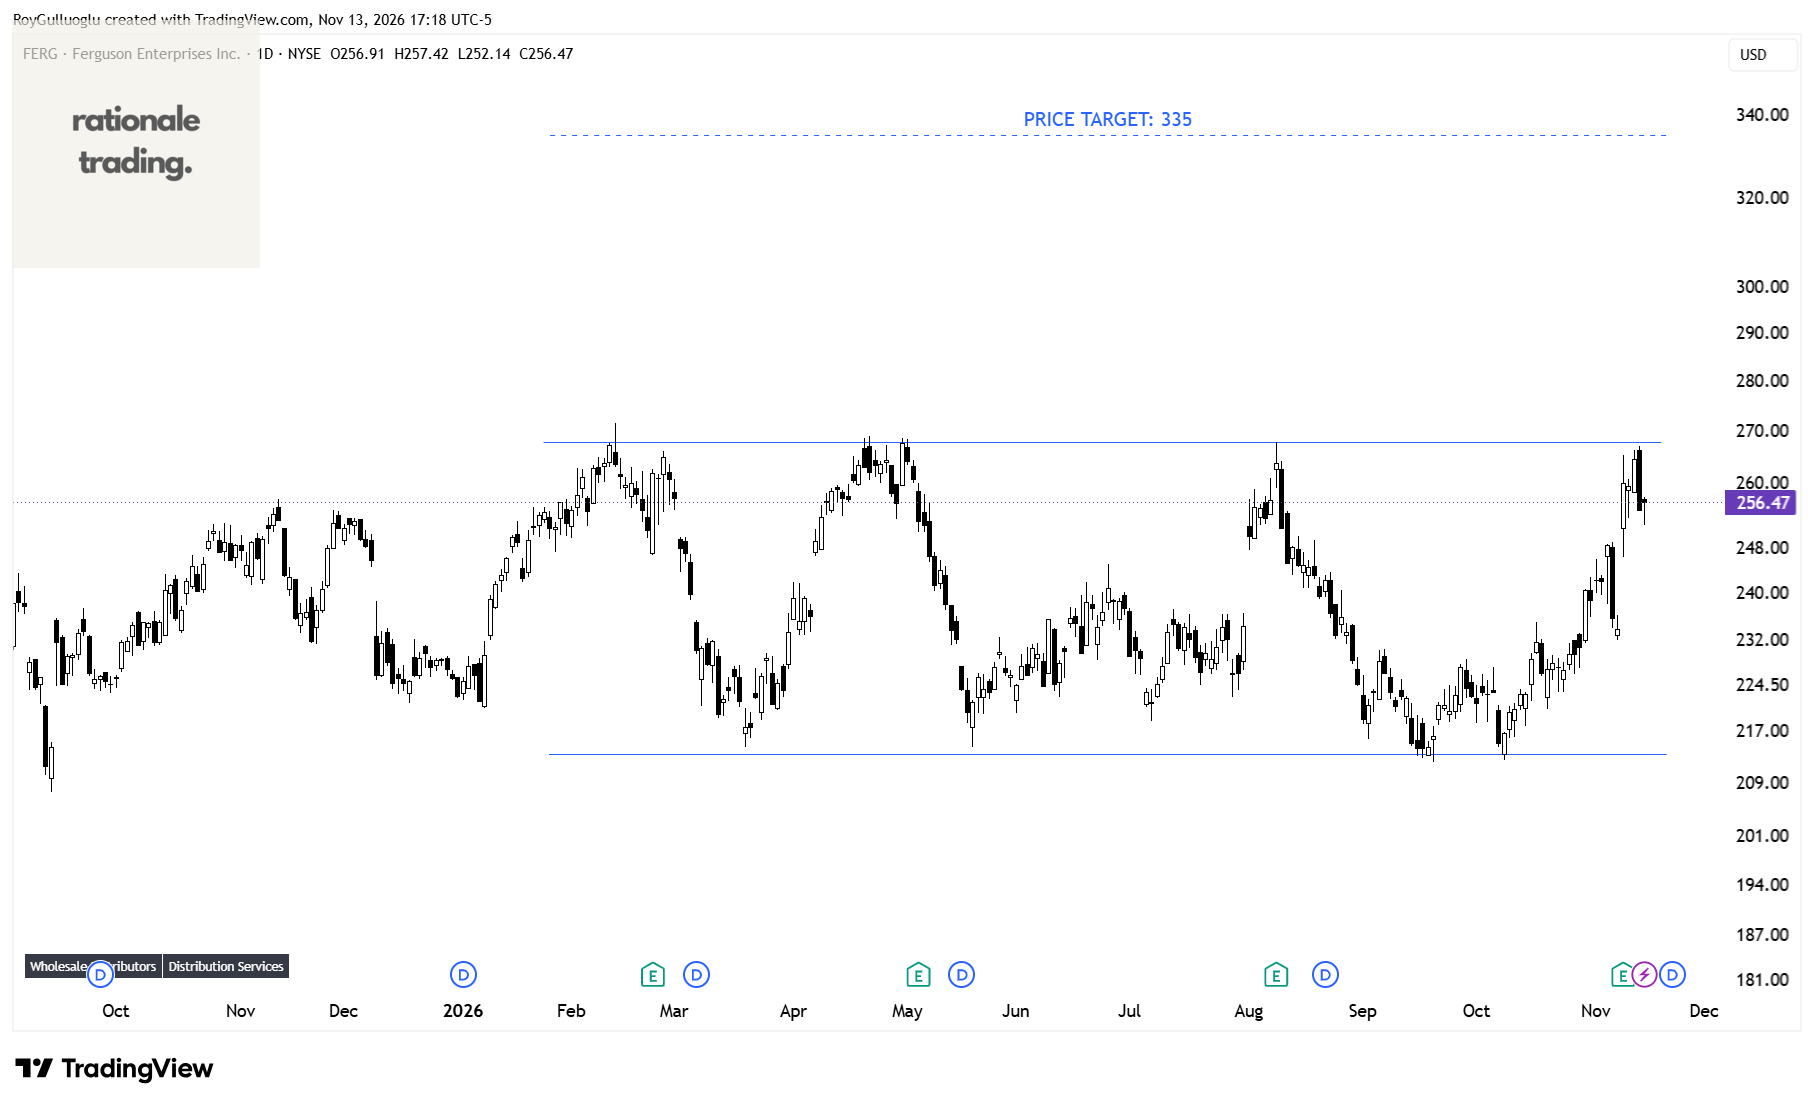
The above daily chart formed an approximately 6-month-long rectangle chart pattern as a bullish continuation after an uptrend.
Within this pattern, the horizontal boundary at 267.8 levels acts as a resistance.
A daily close above 275.8 levels would validate the breakout from the 6-month-long rectangle chart pattern.
Based on this chart pattern, the potential price target is 335 levels.
American Water Works Company, Inc.-(AWK/NYSE)-Long Idea
American Water Works Company, Inc., through its subsidiaries, provides water and wastewater services in the United States.
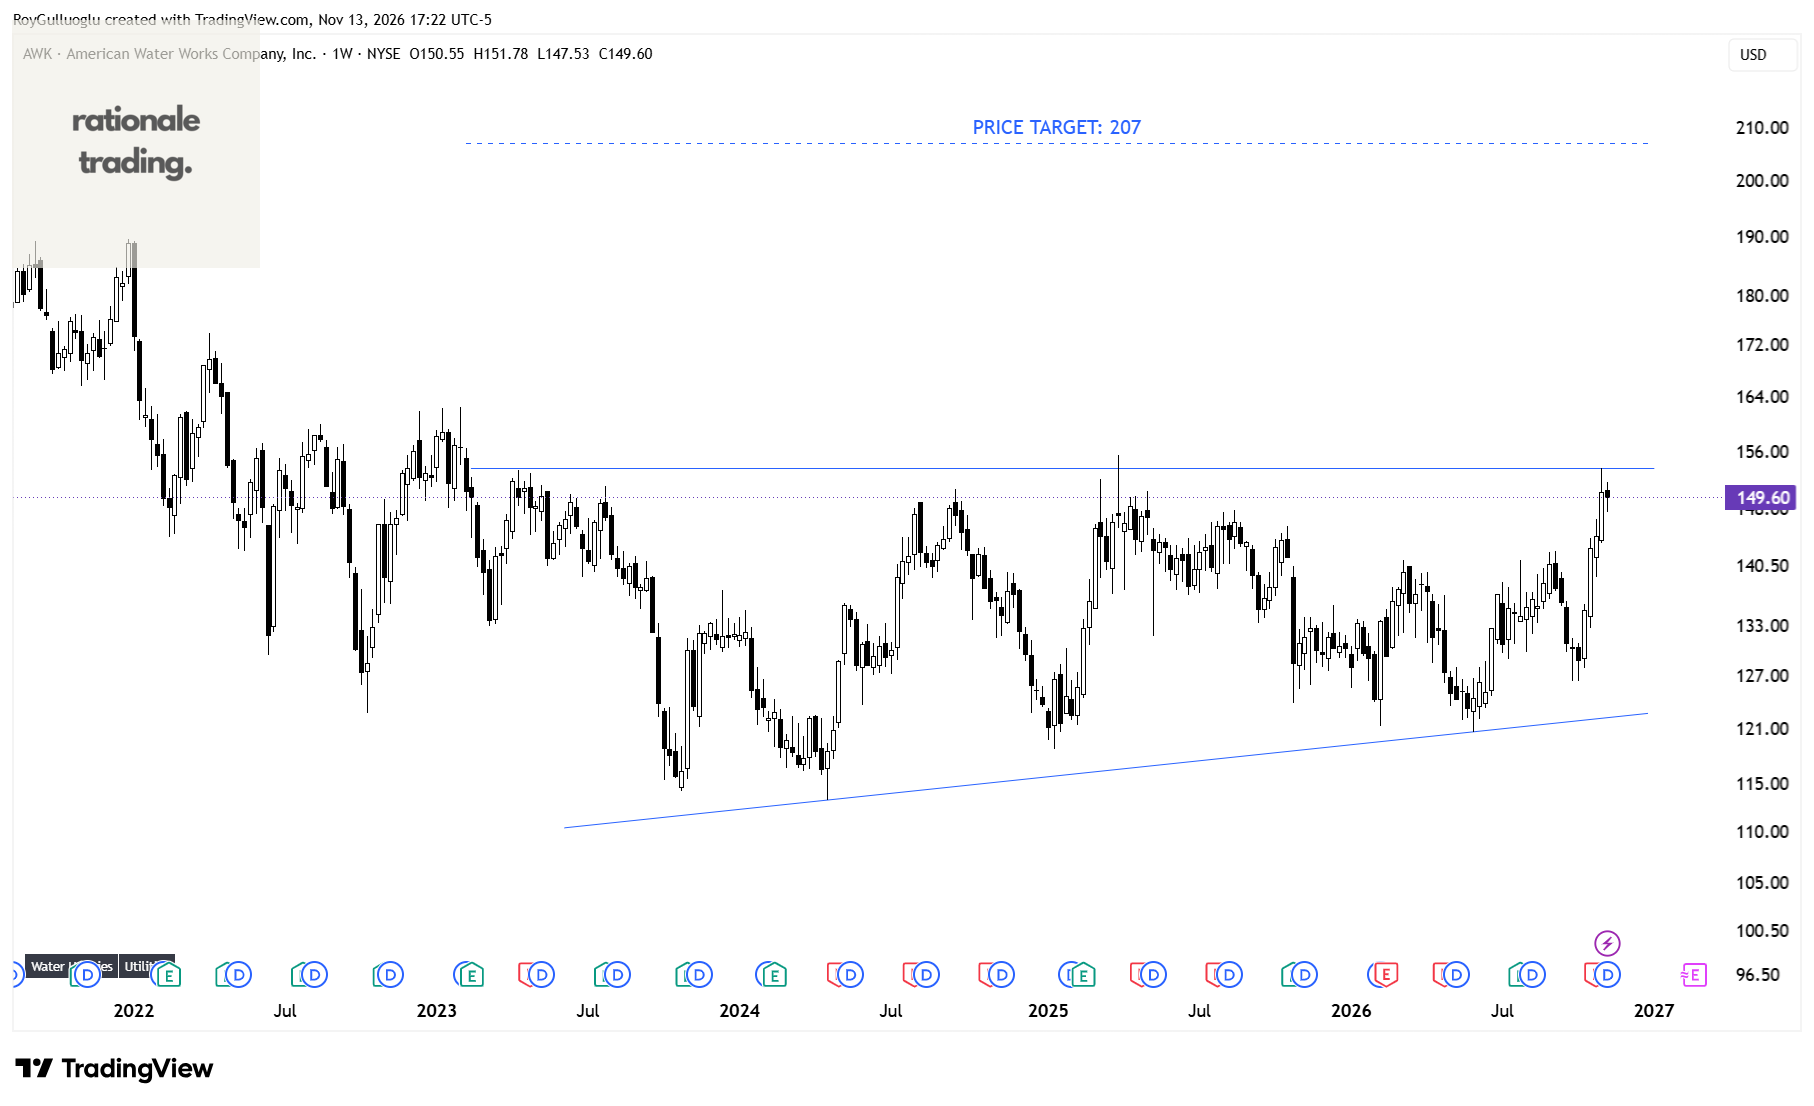
The above weekly chart formed an approximately 45-month-long ascending triangle chart pattern as a bullish reversal after a downtrend.
Within this pattern, the horizontal boundary at 153.69 levels acts as a resistance.
A daily close above 158.3 levels would validate the breakout from the 45-month-long ascending triangle chart pattern.
Based on this chart pattern, the potential price target is 207 levels.
Elanco Animal Health Incorporated-(ELAN/NYSE)-Long Idea
Elanco Animal Health Incorporated, an animal health company, innovates, develops, manufactures, and markets products for pets and farm animals worldwide.
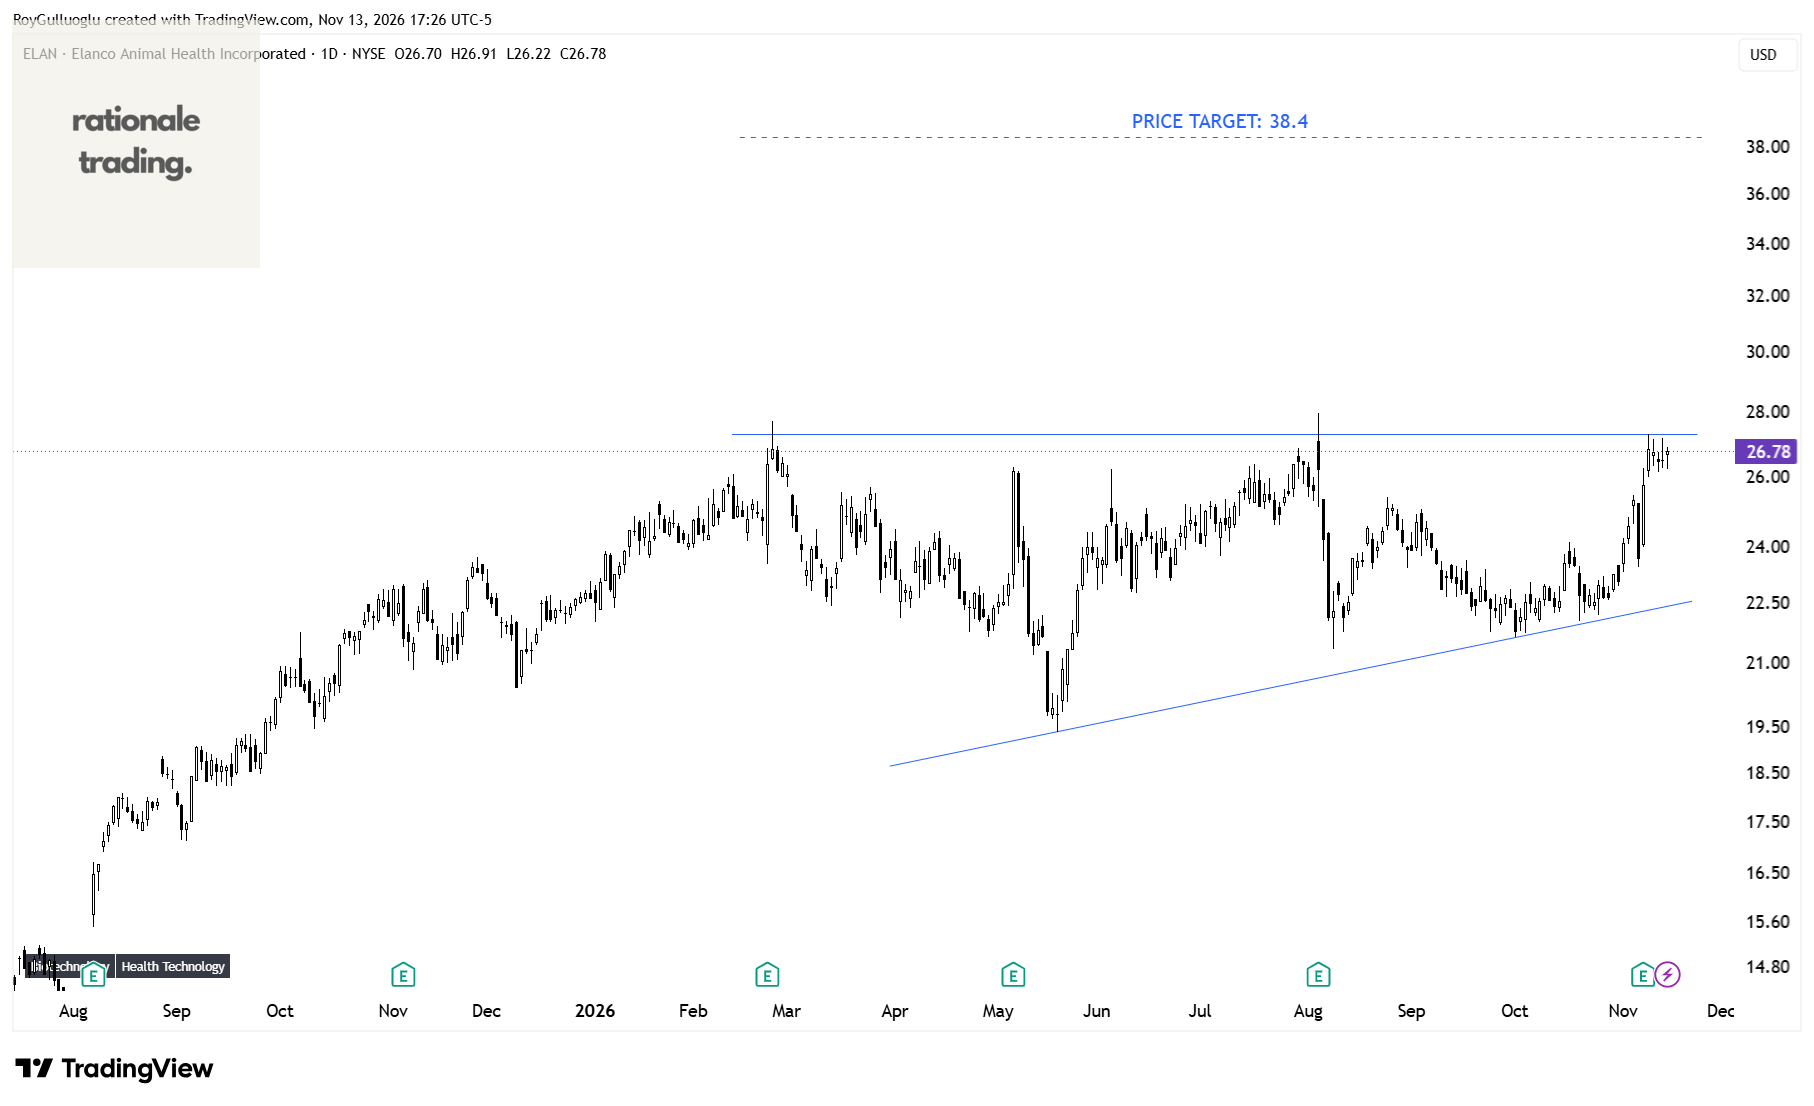
The above daily chart formed an approximately 6-month-long ascending triangle chart pattern as a bullish continuation after an uptrend.
Within this pattern, the horizontal boundary at 27.29 levels acts as a resistance.
A daily close above 28.1 levels would validate the breakout from the 6-month-long ascending triangle chart pattern.
Based on this chart pattern, the potential price target is 38.4 levels.
Edgewise Therapeutics, Inc.-(EWTX/NASDAQ)-Long Idea
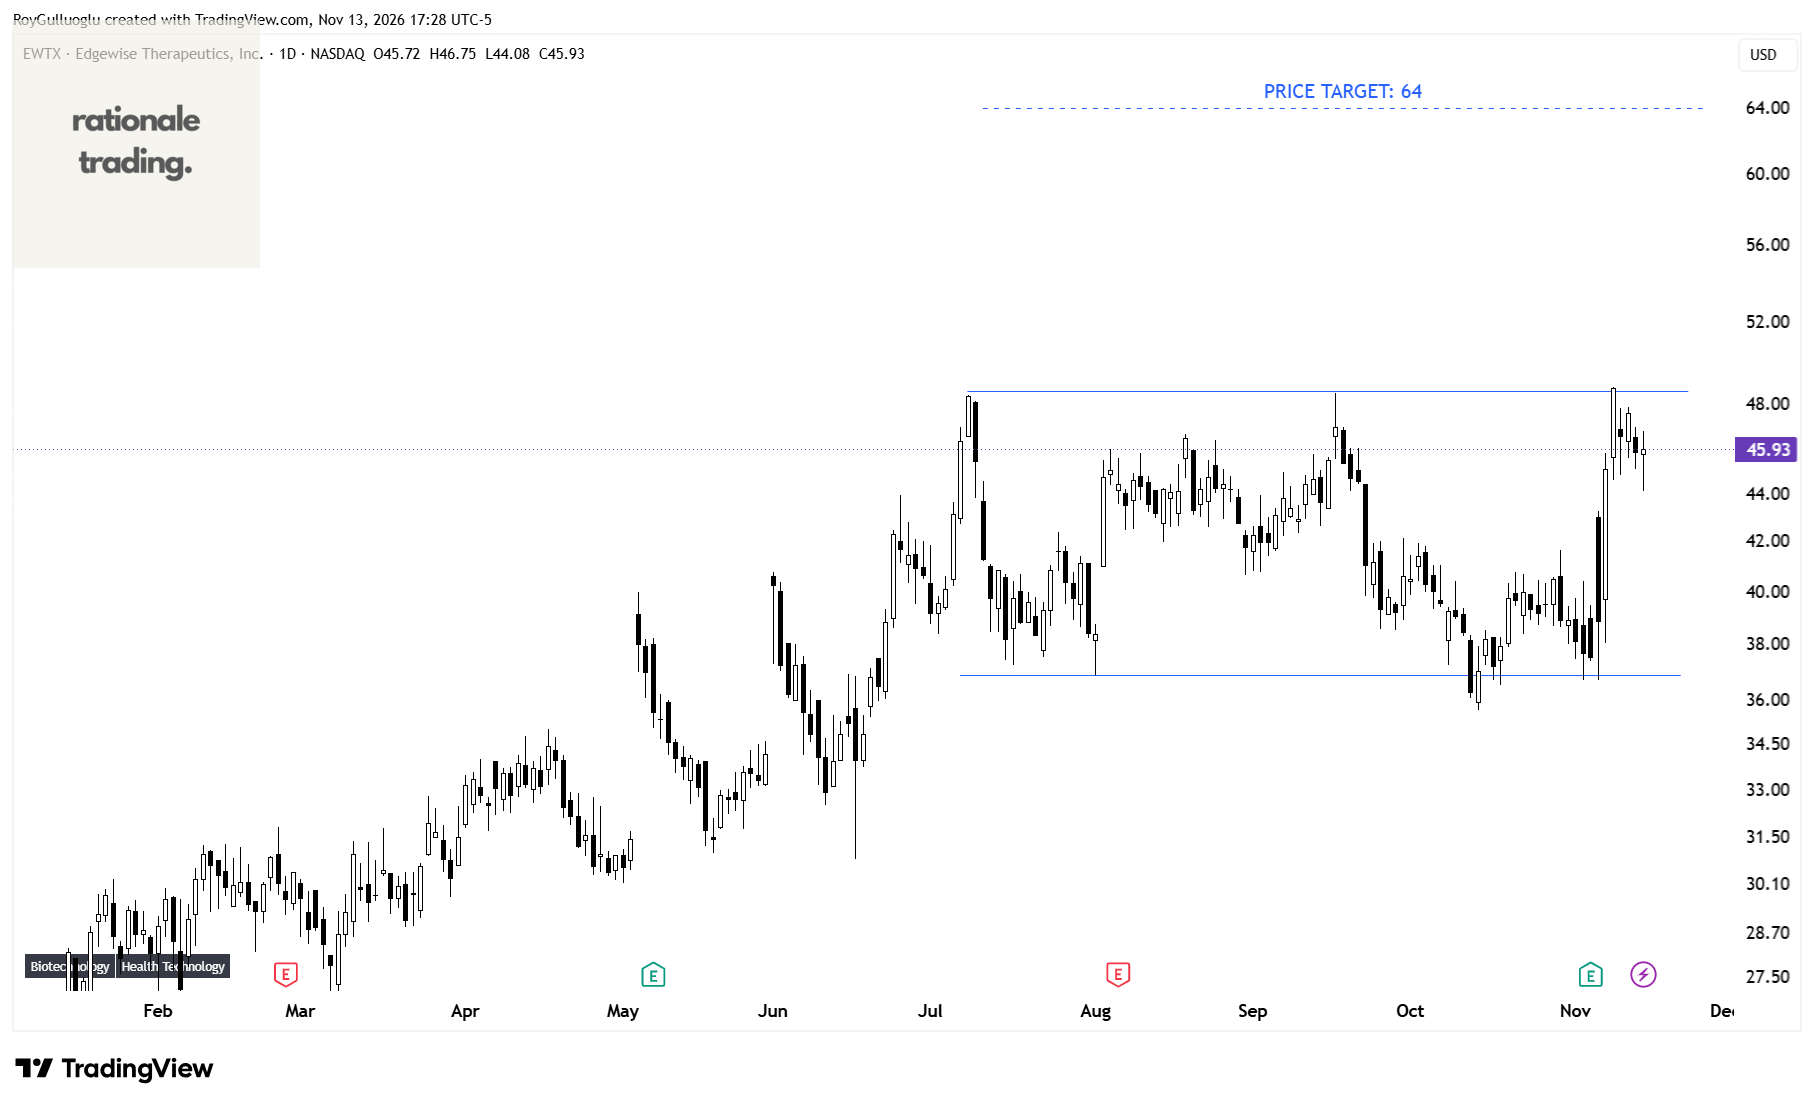
Edgewise Therapeutics, Inc., a biopharmaceutical company, discovers, develops, and commercializes therapies for the treatment of muscle disorders.
The above daily chart formed an approximately 3-month-long rectangle chart pattern as a bullish continuation after an uptrend.
Within this pattern, the horizontal boundary at 48.58 levels acts as a resistance.
A daily close above 50 levels would validate the breakout from the 3-month-long rectangle chart pattern.
Based on this chart pattern, the potential price target is 64 levels.
Infosys Limited-(INFY/NSE)-Long Idea
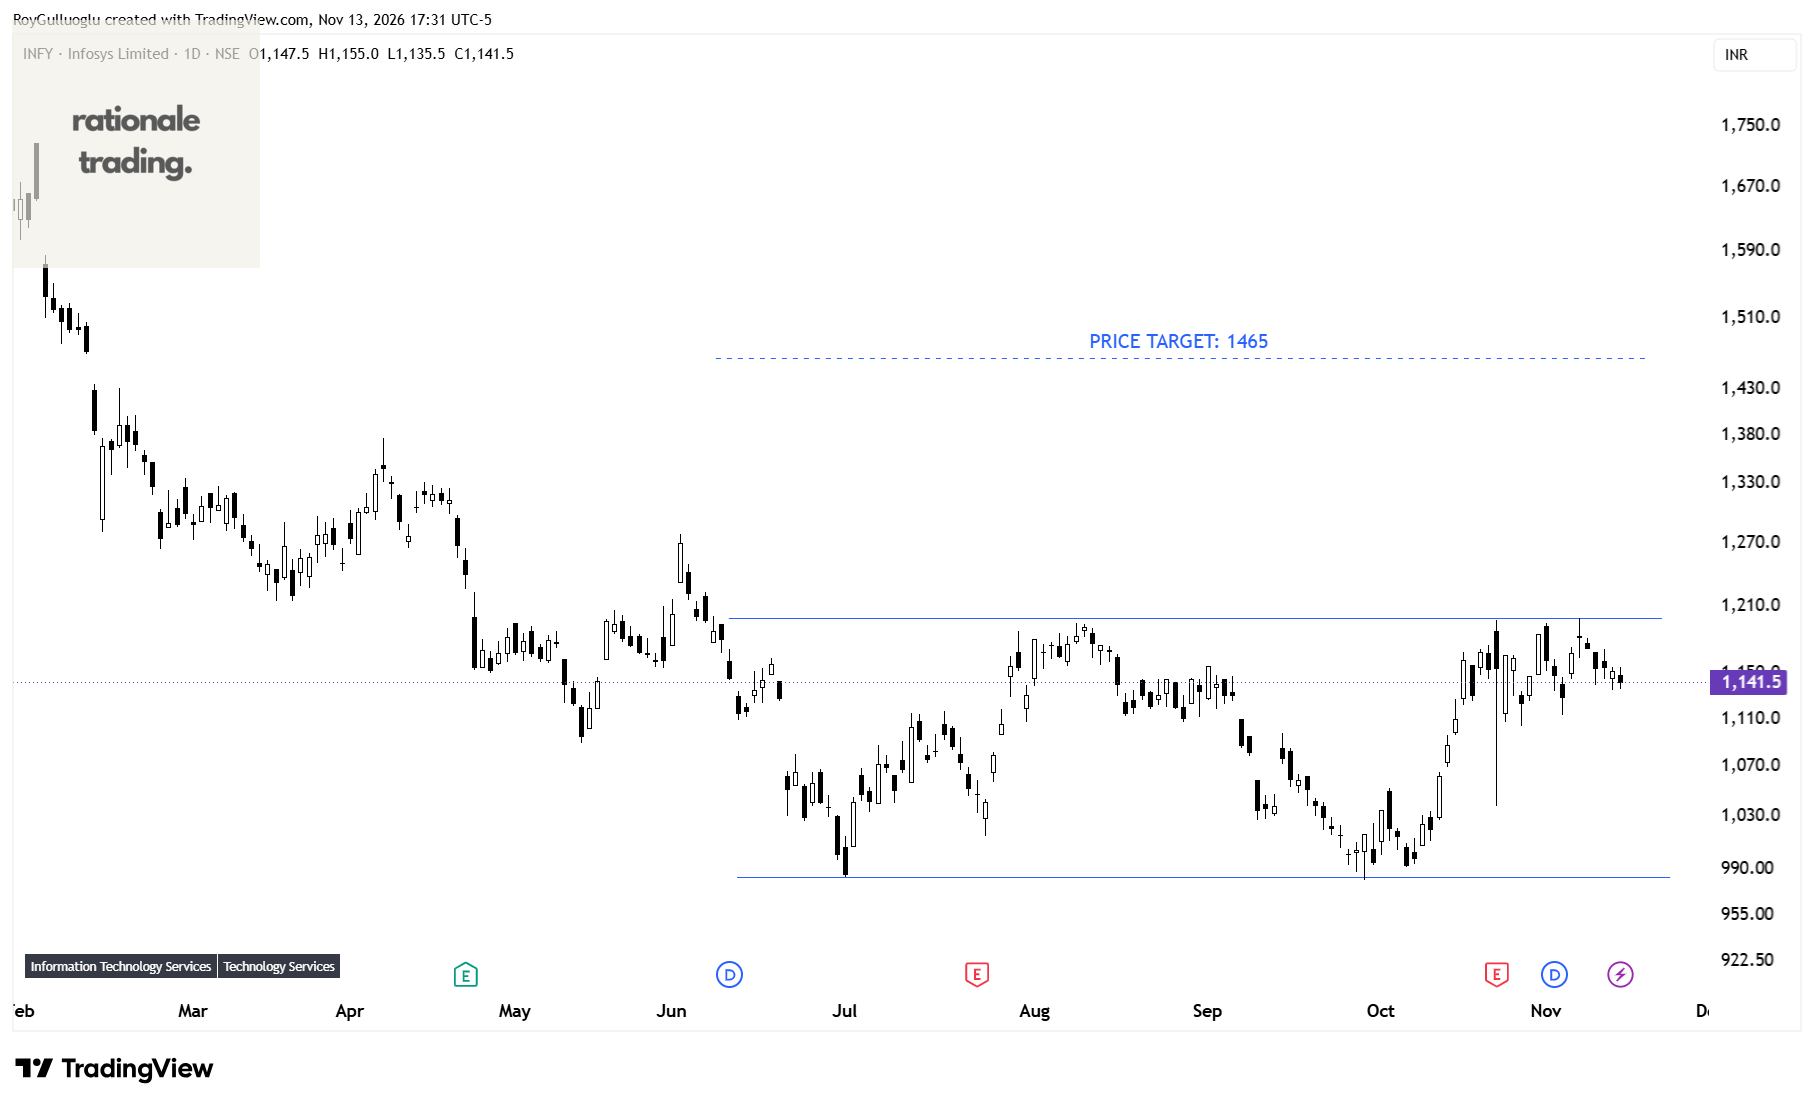
Infosys Limited provides consulting, technology, outsourcing, and digital services worldwide.
The above daily chart formed an approximately 3-month-long rectangle chart pattern as a bullish reversal after a downtrend.
Within this pattern, the horizontal boundary at 1198.8 levels acts as a resistance.
A daily close above 1234.7 levels would validate the breakout from the 3-month-long rectangle chart pattern.
Based on this chart pattern, the potential price target is 1465 levels.
Tesekkurler.