

Trade Ideas Equities
CDNS(NASDAQ), ADI(NASDAQ), FN(NASDAQ), AMKR(NASDAQ), ASTS(NASDAQ), SPSC(NASDAQ), KRONT(BIST), TAVHL(BIST), YKBNK(BIST)

Cadence Design Systems, Inc.-(CDNS/NASDAQ)-Long Idea
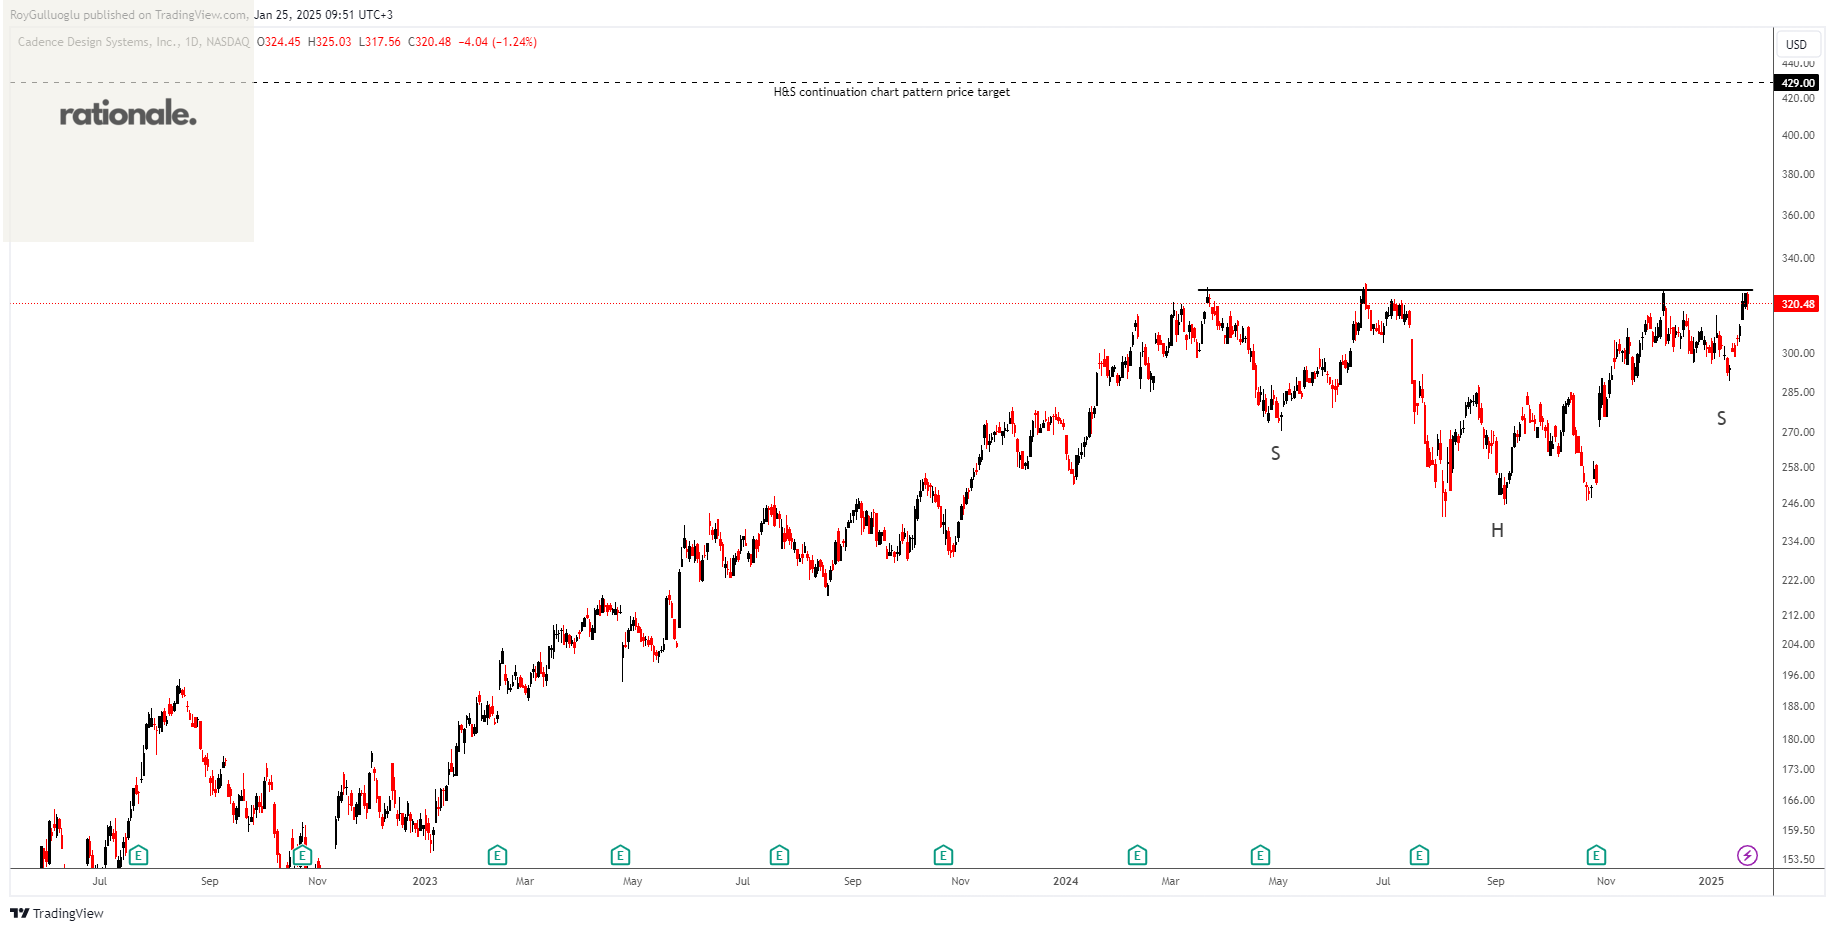
Cadence Design Systems, Inc. provides software, hardware, services, and reusable integrated circuit (IC) design blocks worldwide.
The above daily chart formed an approximately 7-month-long H&S continuation chart pattern as a bullish continuation after an uptrend.
The horizontal boundary at 326.19 levels acts as a resistance within this pattern.
A daily close above 335.98 levels would validate the breakout from the 7-month-long H&S continuation chart pattern.
Based on this chart pattern, the potential price target is 429 levels.
CDNS, classified under the "technology" sector, falls under the “Large Cap - Growth” stock category.
Analog Devices, Inc.-(ADI/NASDAQ)-Long/Short Idea
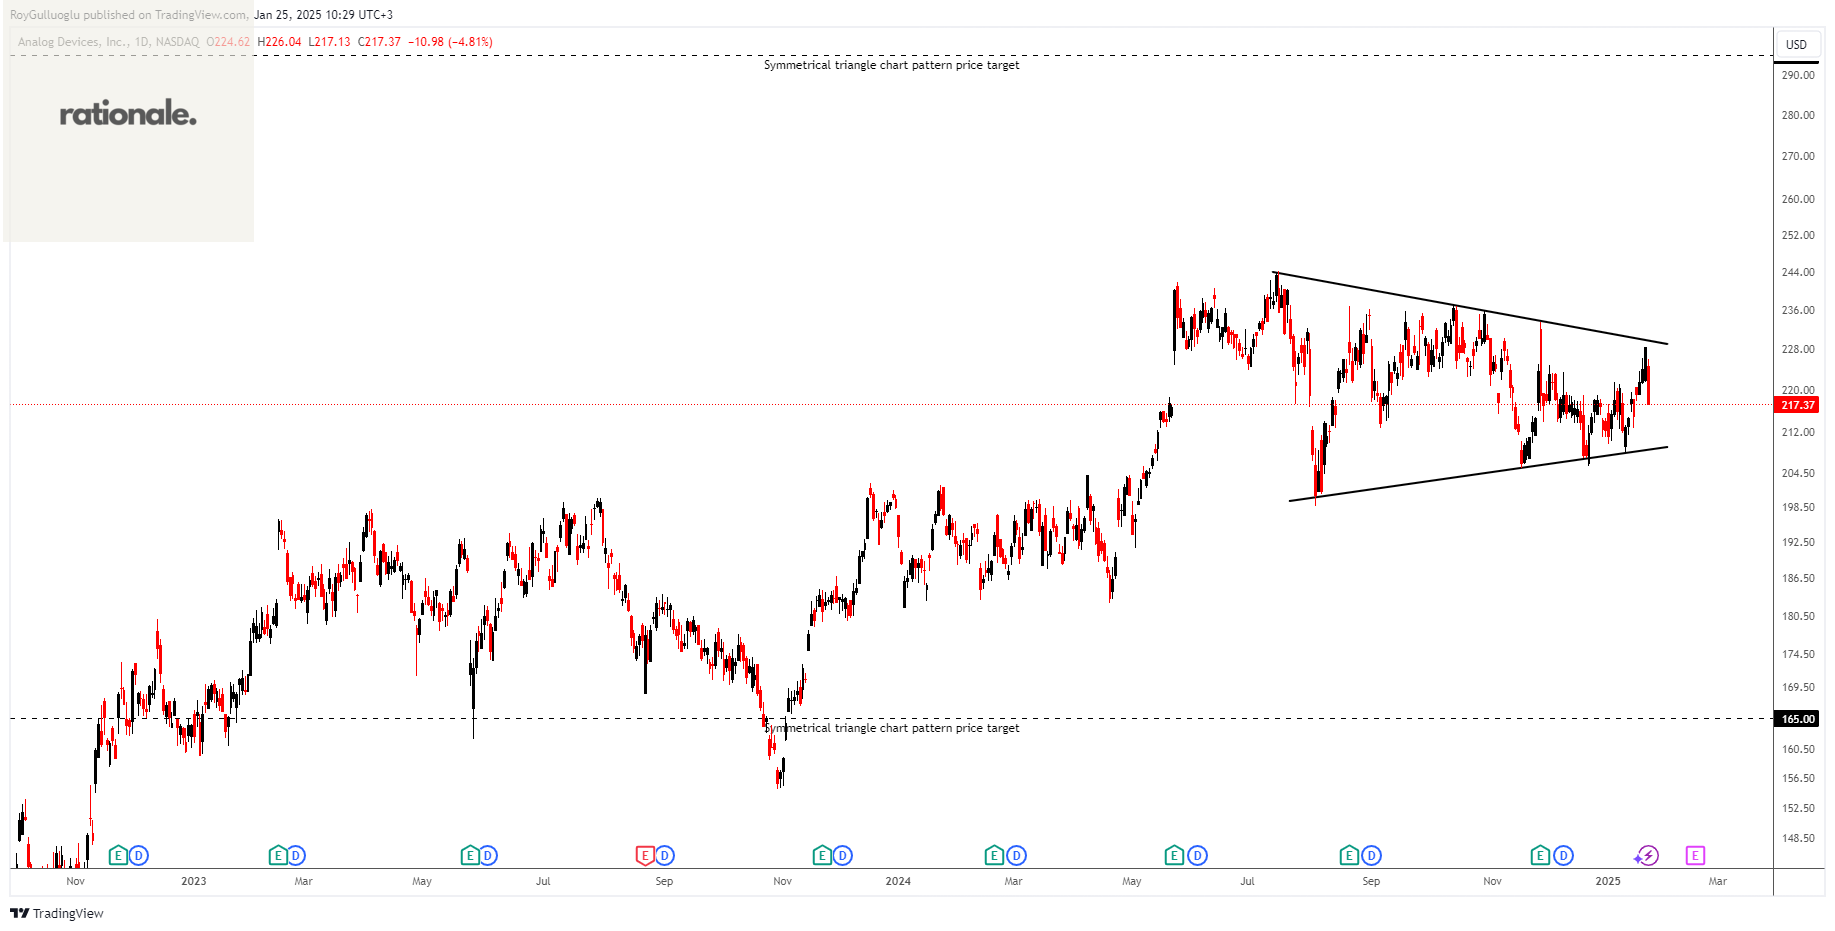
Analog Devices, Inc. designs, manufactures, tests, and markets integrated circuits (ICs), software, and subsystems products in the United States, rest of North and South America, Europe, Japan, China, and rest of Asia.
The above daily chart formed an approximately 5-month-long symmetrical triangle chart pattern that might act as a bearish reversal or bullish continuation after an uptrend.
A daily close below 203 levels would validate the breakdown and a daily close above 236.9 would validate the breakout from the 5-month-long symmetrical triangle chart pattern.
Based on the chart patterns, the potential price targets are 300 and 420 levels respectively.
CW, classified under the "industrials" sector, falls under the “Large Cap - Value” stock category.
ADI, classified under the "technology" sector, falls under the “Large Cap - Growth” stock category.
Fabrinet -(FN/NYSE)-Long Idea
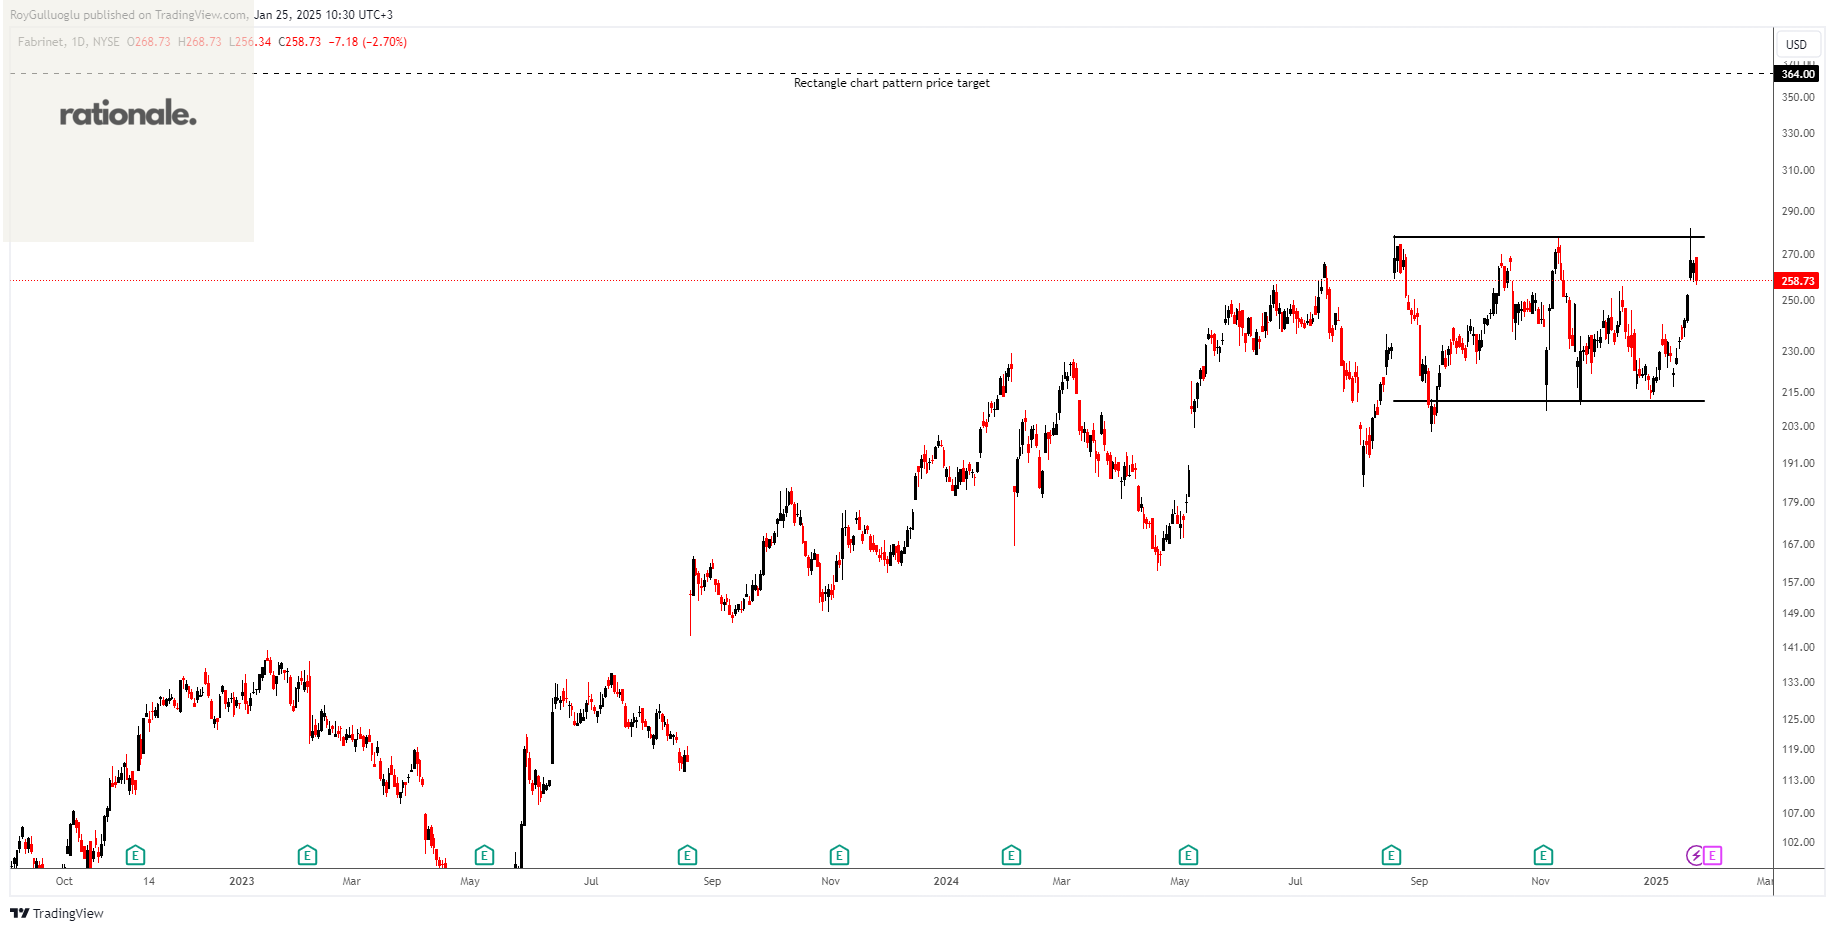
Fabrinet provides optical packaging and precision optical, electro-mechanical, and electronic manufacturing services in North America, the Asia-Pacific, and Europe.
The above daily chart formed an approximately 3-month-long rectangle chart pattern as a bullish continuation after an uptrend.
The horizontal boundary at 277.5 levels acts as a resistance within this pattern.
A daily close above 285.8 levels would validate the breakout from the 3-month-long rectangle chart pattern.
Based on this chart pattern, the potential price target is 364 levels.
FN, classified under the "technology" sector, falls under the “Mid Cap - Growth” stock category.
Amkor Technology, Inc.-(AMKR/NASDAQ)-Short Idea
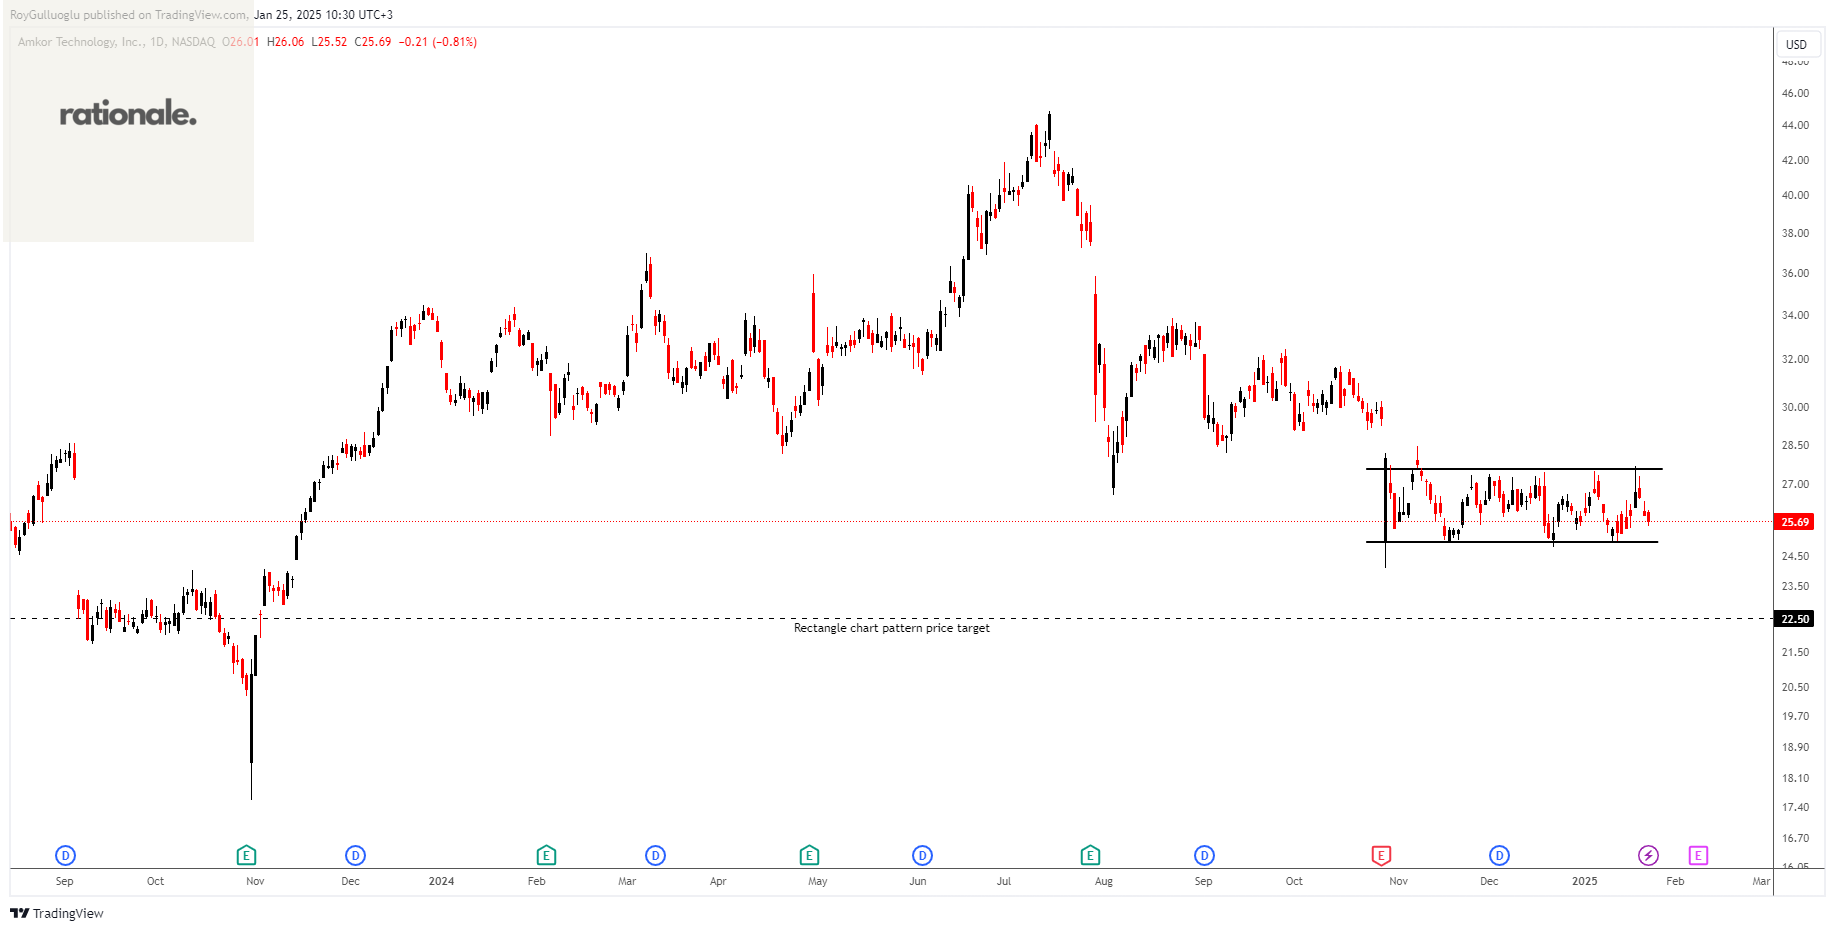
Amkor Technology, Inc. provides outsourced semiconductor packaging and test services in the United States, Japan, Europe, and the Asia Pacific.
The above daily chart formed an approximately 2-month-long rectangle chart pattern as a bearish continuation after a downtrend.
The horizontal boundary at 24.95 levels acts as a support within this pattern.
A daily close below 24.2 levels would validate the breakdown from the 2-month-long rectangle chart pattern.
Based on this chart pattern, the potential price target is 22.5 levels.
AMKR, classified under the "technology" sector, falls under the “Mid Cap - Growth” stock category.
AST SpaceMobile, Inc.-(ASTS/NASDAQ)-Short Idea
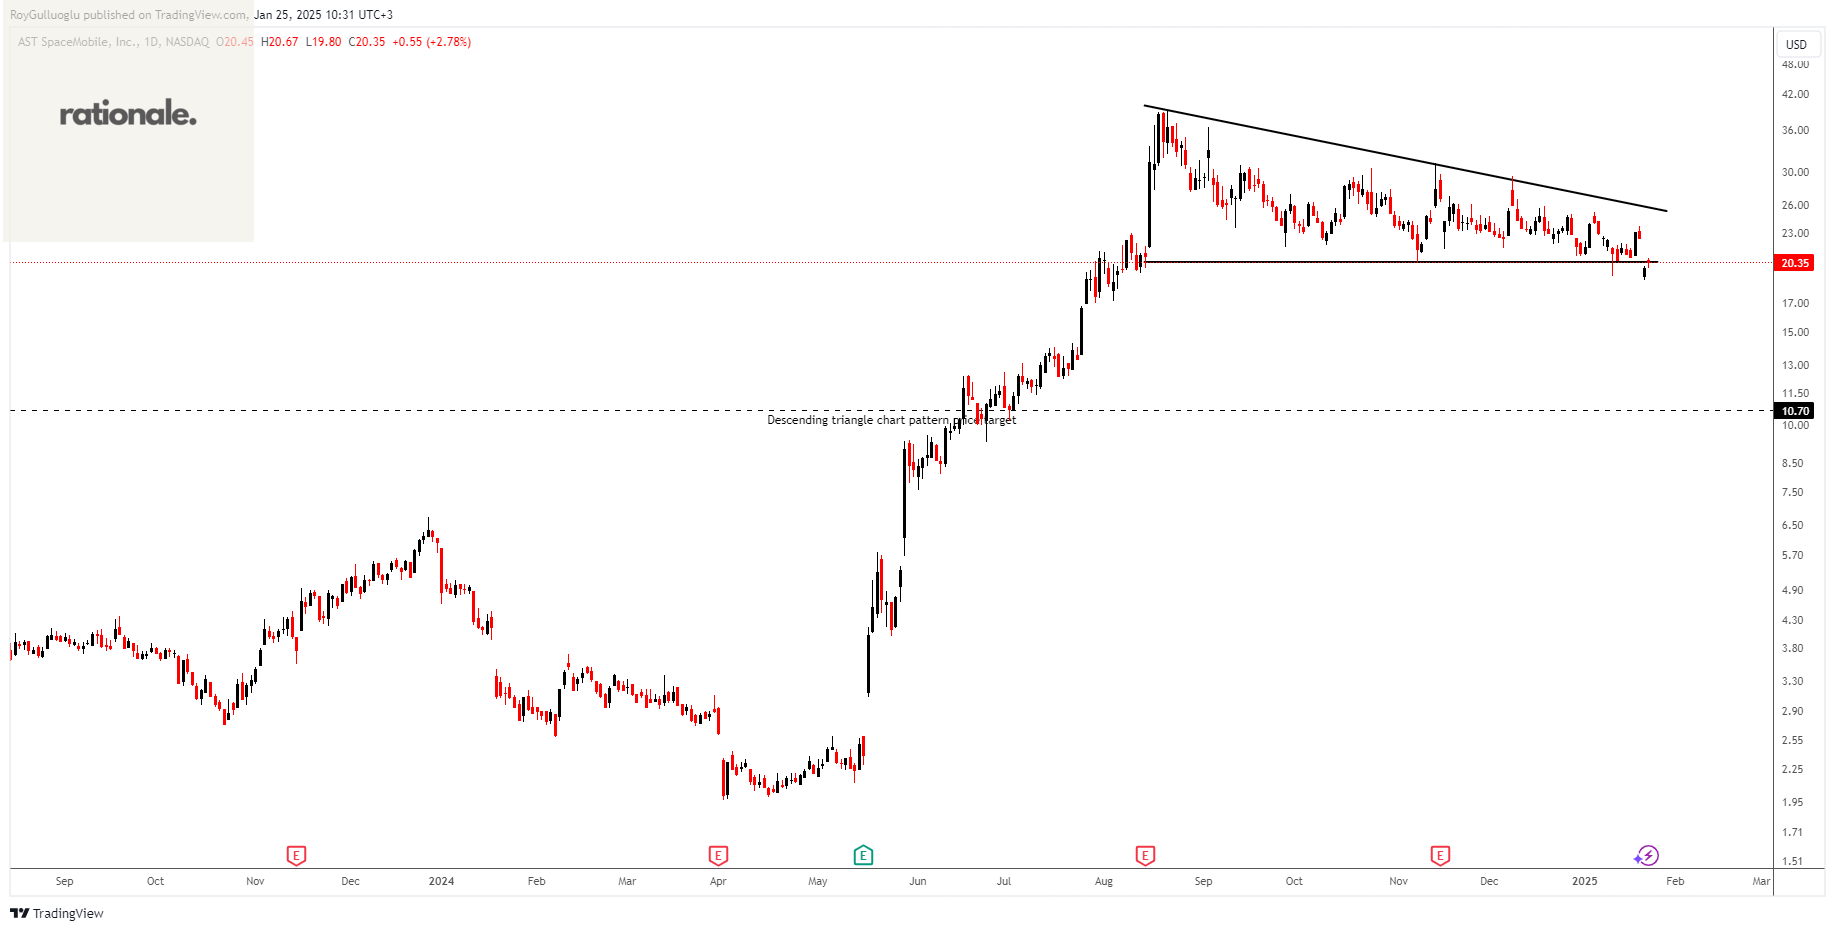
AST SpaceMobile, Inc., together with its subsidiaries, develops and provides access to a space-based cellular broadband network for smartphones in the United States.
The above daily chart formed an approximately 3-month-long descending triangle chart pattern as a bearish reversal after an uptrend.
The horizontal boundary at 20.3 levels acts as a support within this pattern.
A daily close below 19.69 levels would validate the breakdown from the 3-month-long descending triangle chart pattern.
Based on this chart pattern, the potential price target is 10.7 levels.
ASTS, classified under the "technology" sector, falls under the “Mid Cap - Growth” stock category.
SPS Commerce, Inc.-(SPSC/NASDAQ)-Long Idea
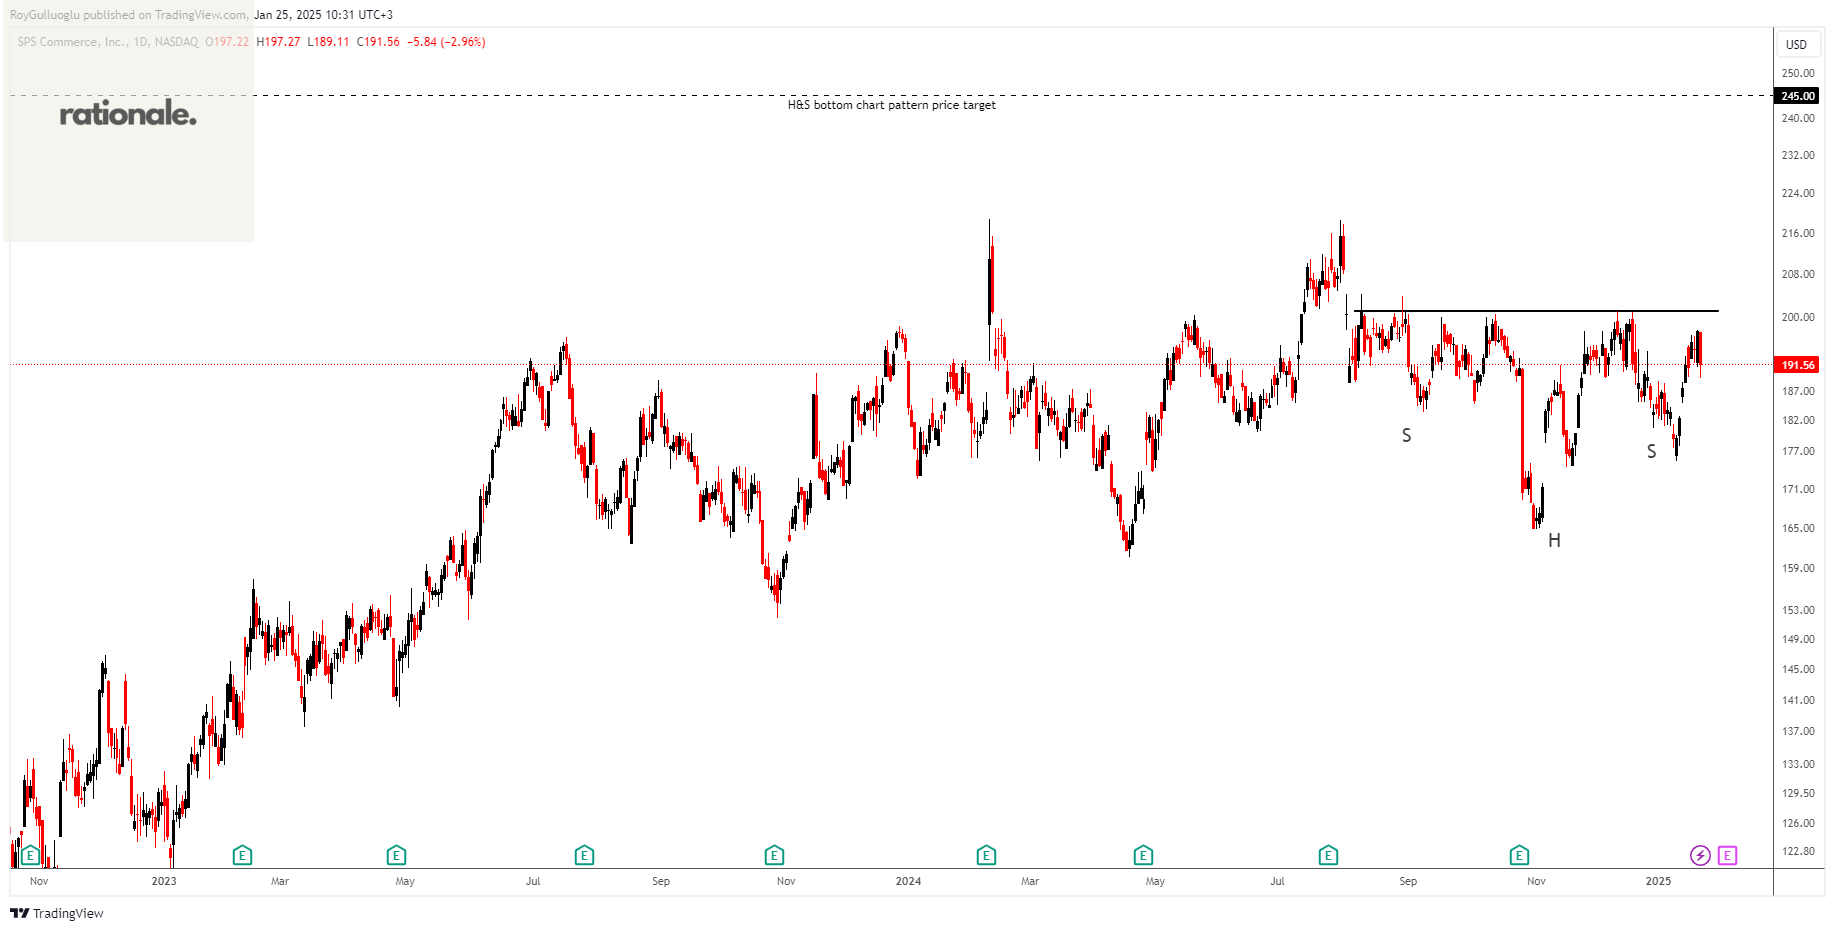
SPS Commerce, Inc. provides cloud-based supply chain management solutions in the United States and internationally.
The above daily chart formed an approximately 4-month-long H&S bottom chart pattern as a bullish reversal after a downtrend.
The horizontal boundary at 201 levels acts as a resistance within this pattern.
A daily close above 207 levels would validate the breakout from the 4-month-long H&S bottom chart pattern.
Based on this chart pattern, the potential price target is 245 levels.
SPSC, classified under the "technology" sector, falls under the “Mid Cap - Growth” stock category.
Kron Teknoloji A.S.-(KRONT/BIST)-Long Idea
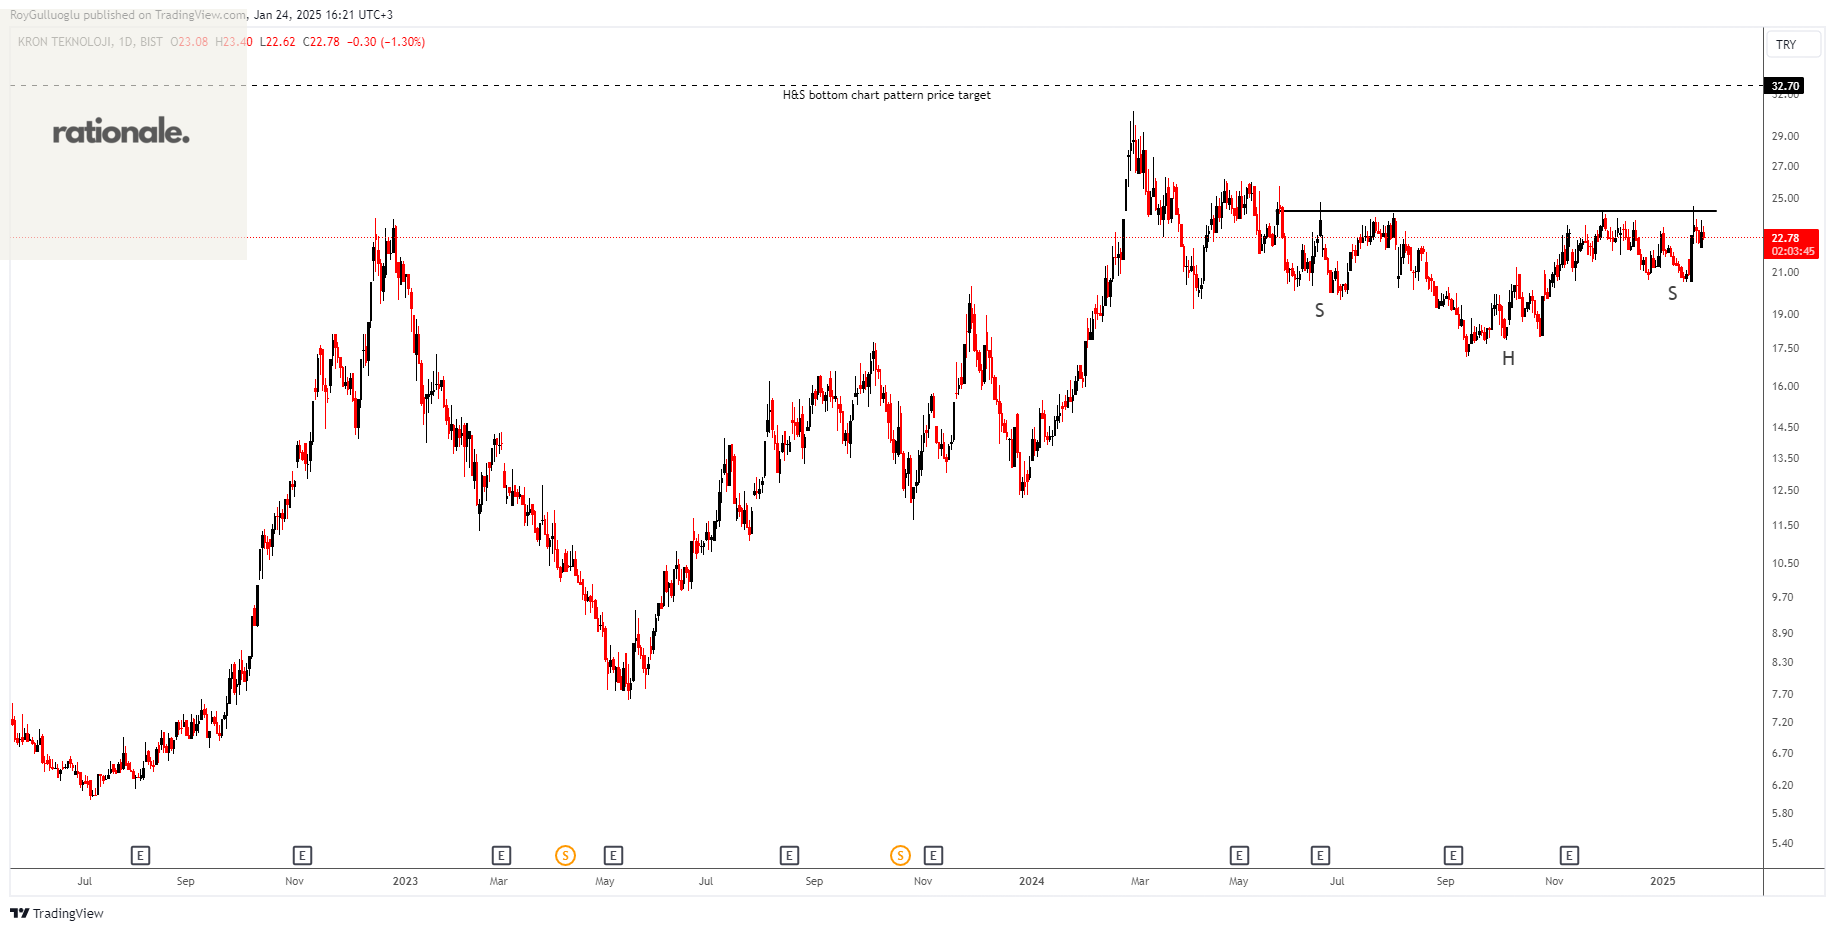
Kron Teknoloji A.S. provides technology solutions for the operational efficiency and security needs of the corporates in the finance, energy, healthcare, and telecommunications sectors worldwide.
The above daily chart formed an approximately 5-month-long H&S bottom chart pattern as a bullish reversal after a downtrend.
The horizontal boundary at 24.26 levels acts as a resistance within this pattern.
A daily close above 24.98 levels would validate the breakout from the 5-month-long H&S bottom chart pattern.
Based on this chart pattern, the potential price target is 32.7 levels.
KRONT, classified under the "technology" sector, falls under the “Small Cap - Growth” stock category.
TAV Havalimanlari Holding A.S.-(TAVHL/BIST)-Long Idea
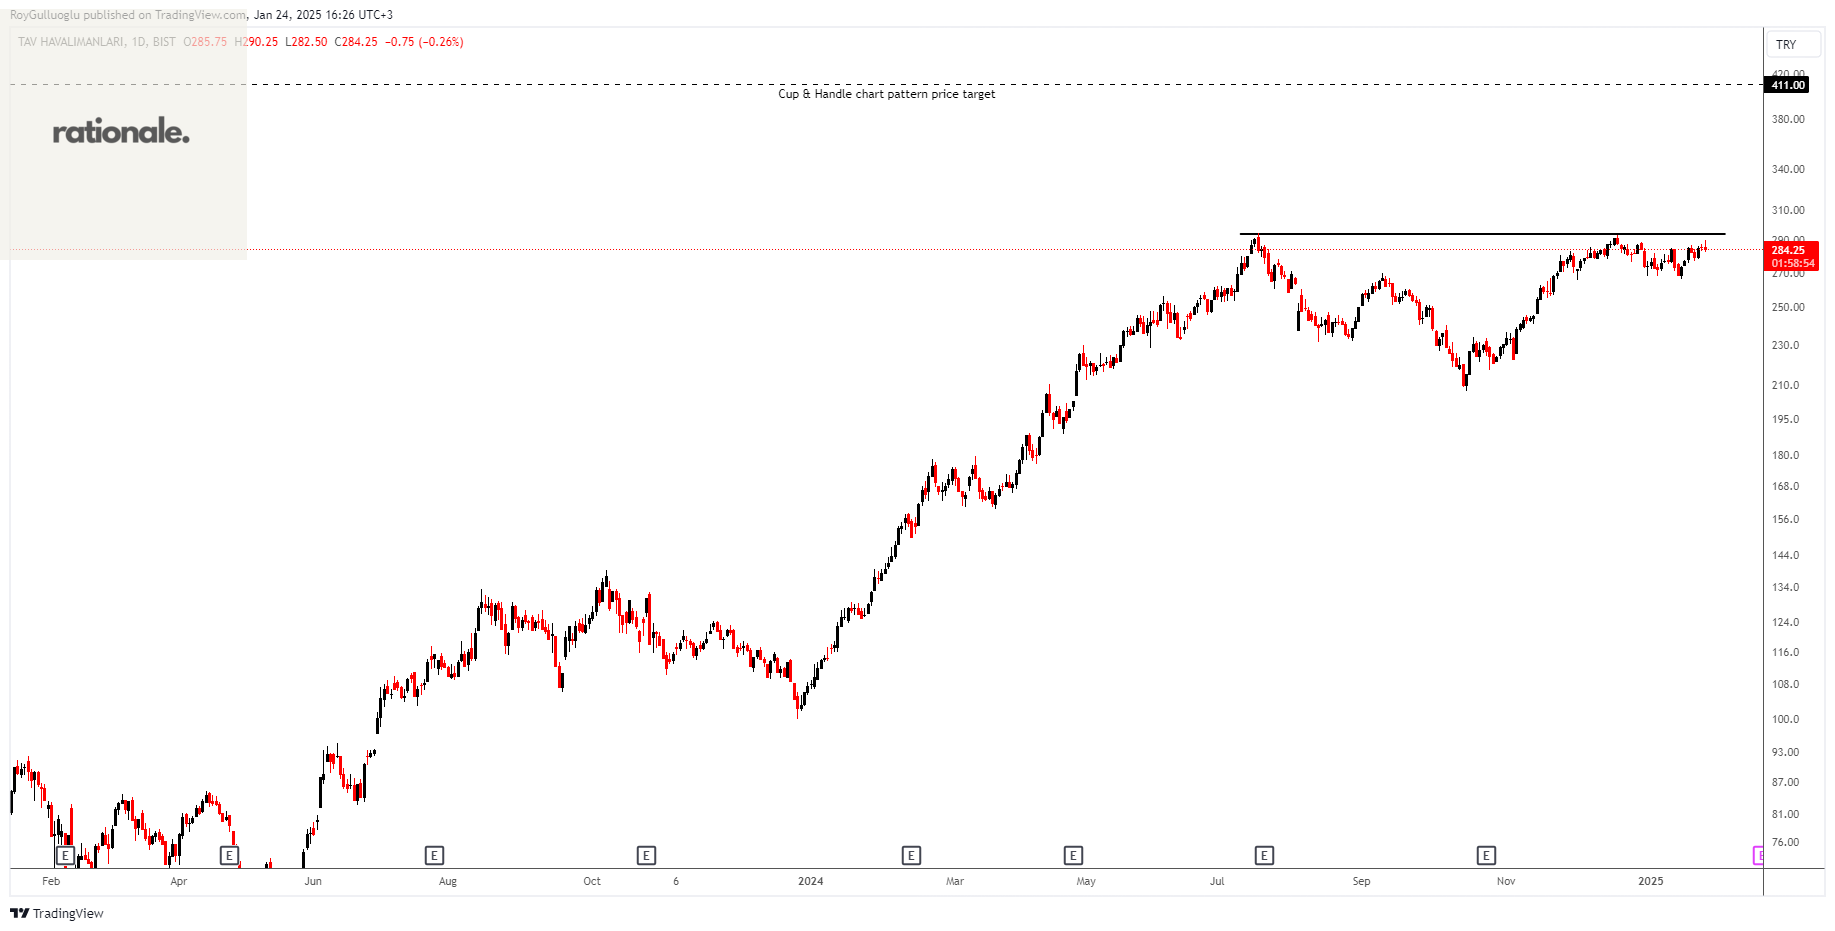
TAV Havalimanlari Holding A.S., together with its subsidiaries, constructs terminal buildings, and manages and operates terminals or airports in Turkey, Kazakhstan, Georgia, Qatar, Macedonia, Macedonia, Latvia, Croatia, Tunisia, Oman, Saudi Arabia, Spain, and internationally.
The above daily chart formed an approximately 5-month-long Cup & Handle continuation chart pattern as a bullish continuation after an uptrend.
The horizontal boundary at 294 levels acts as a resistance within this pattern.
A daily close above 302.8 levels would validate the breakout from the 5-month-long Cup & Handle continuation chart pattern.
Based on this chart pattern, the potential price target is 411 levels.
TAVHL, classified under the "industrials" sector, falls under the “Mid Cap - Value” stock category.
Yapi ve Kredi Bankasi A.S.-(YKBNK/BIST)-Long Idea
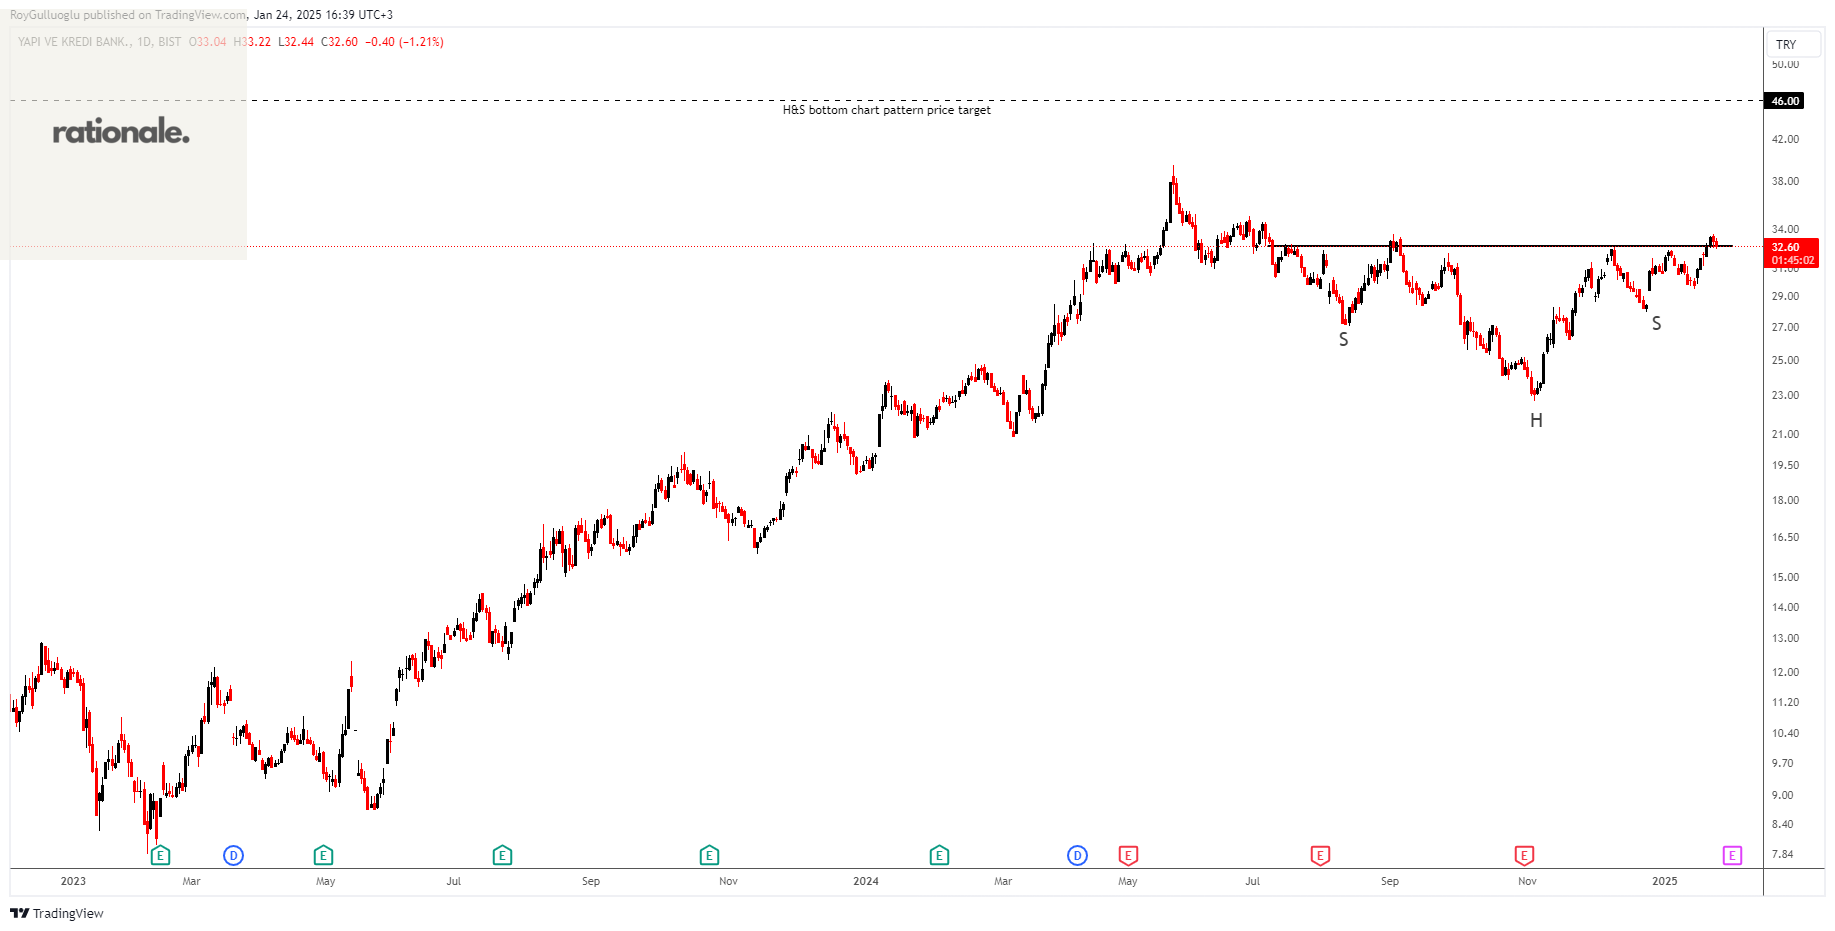
Yapi ve Kredi Bankasi A.S., together with its subsidiaries, provides various banking products and services in Turkey and internationally.
The above daily chart formed an approximately 5-month-long H&S bottom chart pattern as a bullish reversal after a downtrend.
The horizontal boundary at 32.6 levels acts as a resistance within this pattern.
A daily close above 33.57 levels would validate the breakout from the 5-month-long H&S bottom chart pattern.
Based on this chart pattern, the potential price target is 46 levels.
YKBNK, classified under the "financial services" sector, falls under the “Mid Cap - Income” stock category.
Teşekkürler Roy