


iRhythm Holdings, Inc.-(IRTC/NASDAQ)-Long Idea
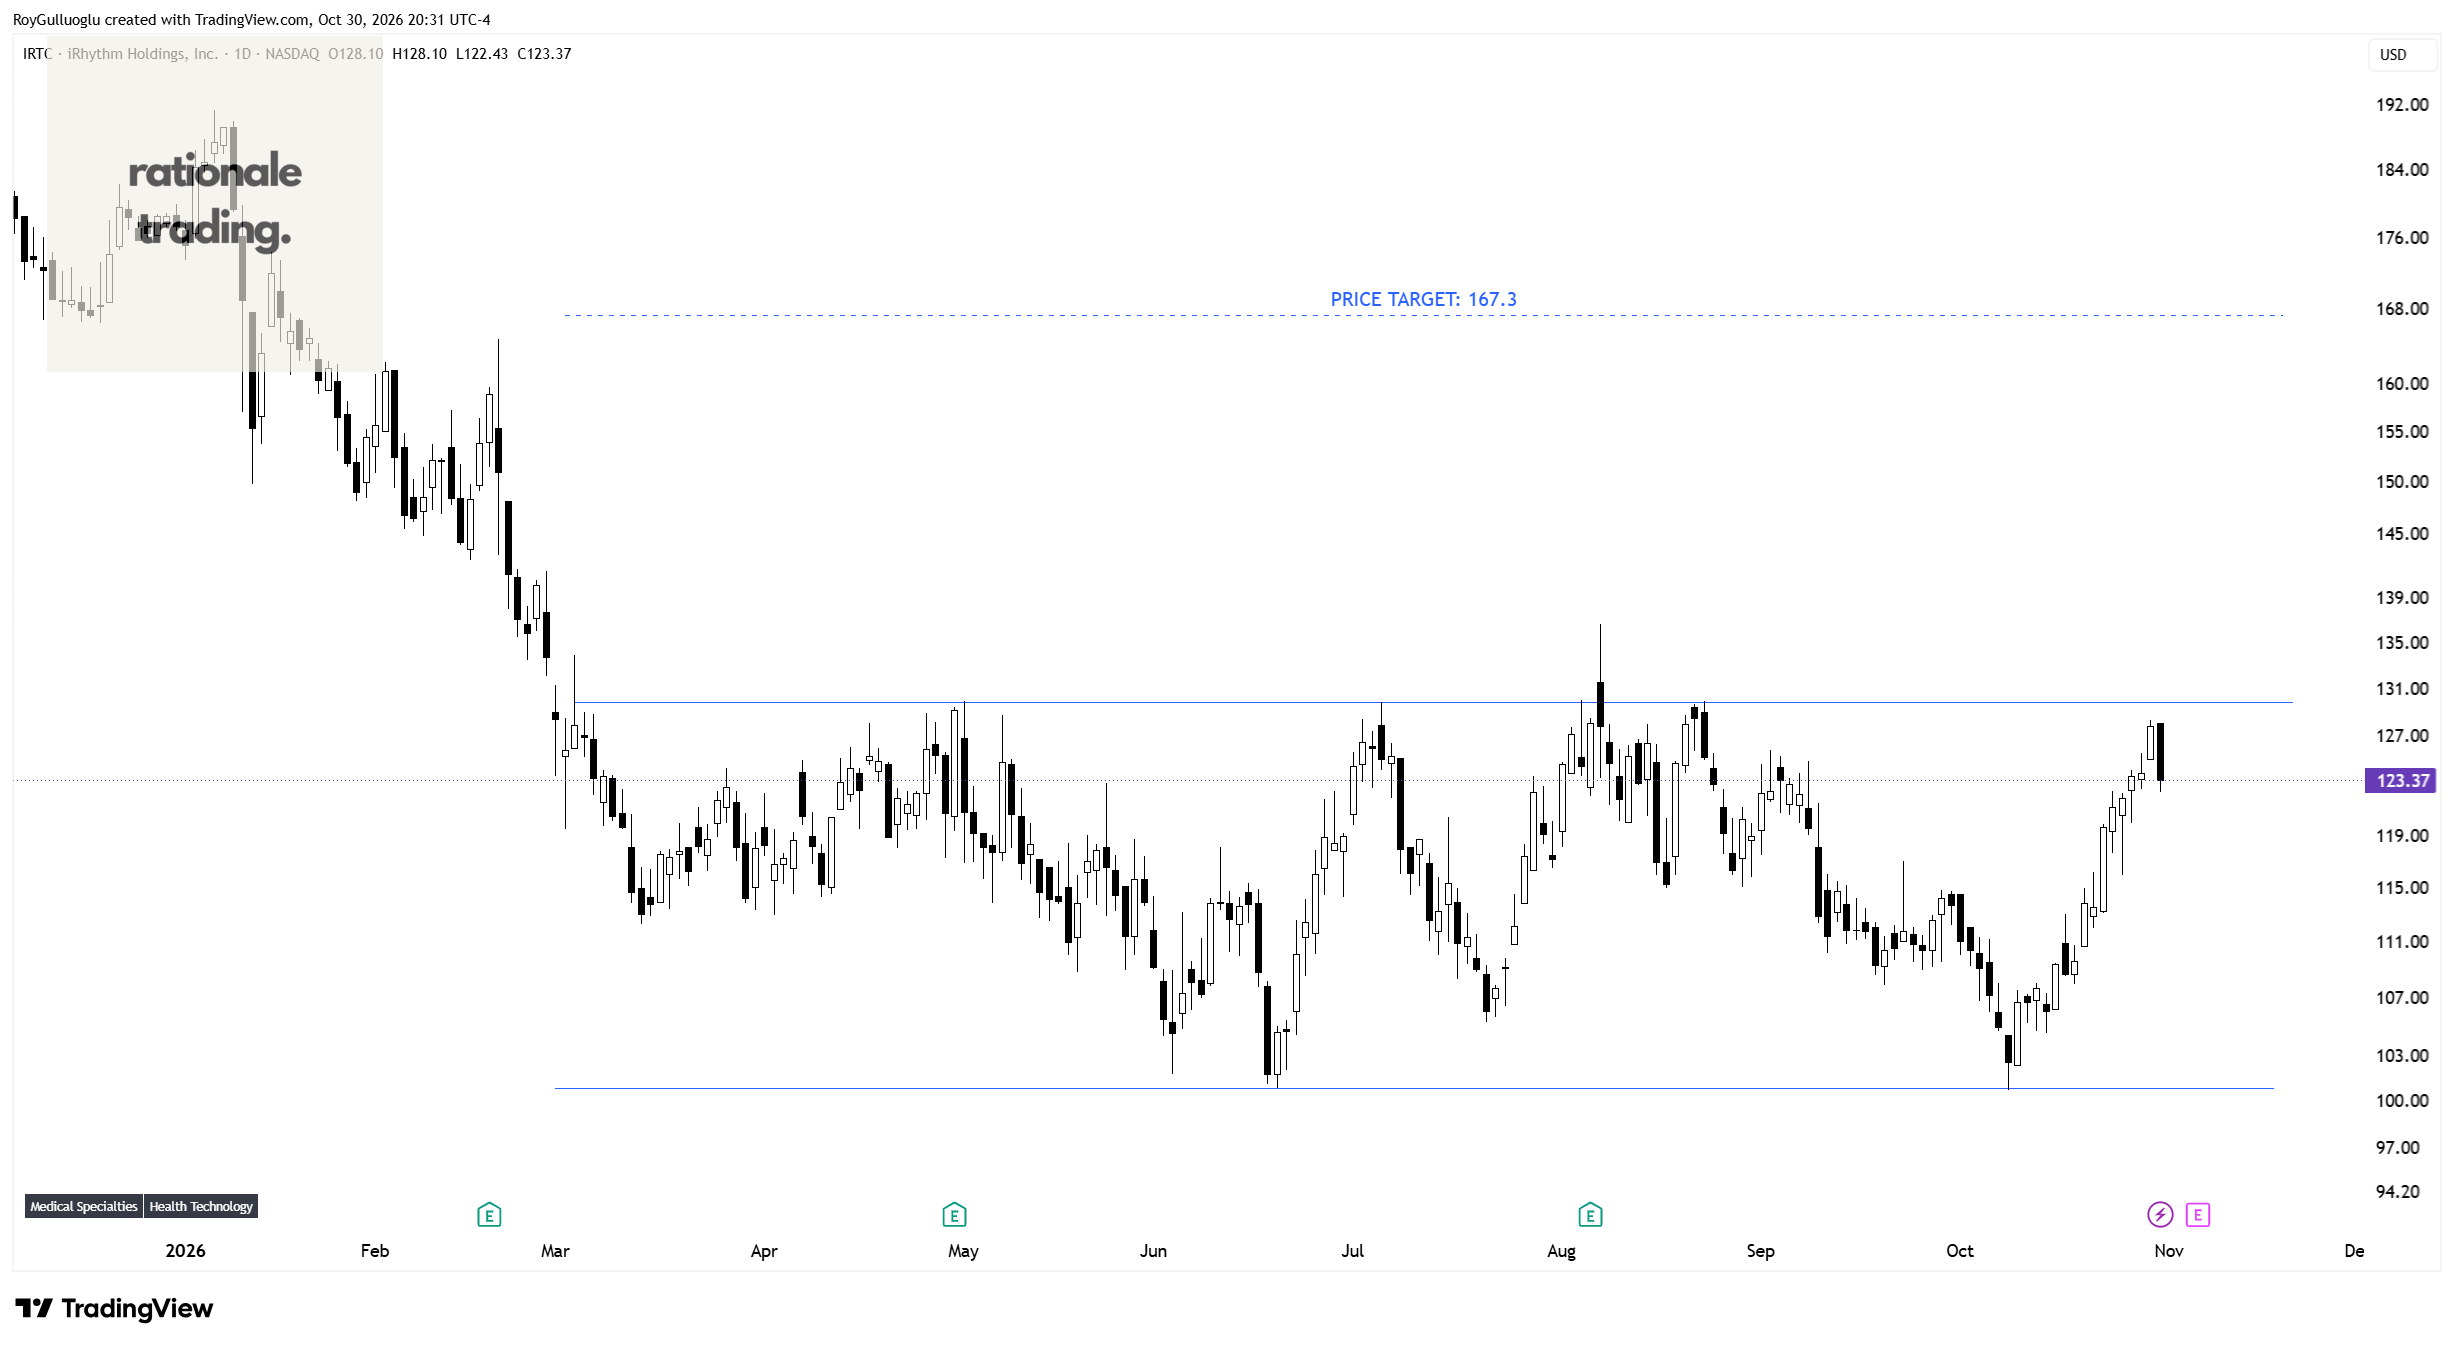
iRhythm Holdings, Inc., a digital healthcare company, engages in the design, development, and commercialization of device-based technology that provides ambulatory cardiac monitoring services to diagnose arrhythmias in the United States.
The above daily chart formed an approximately 5-month-long rectangle chart pattern as a bullish reversal after a downtrend.
Within this pattern, the horizontal boundary at 129.89 levels acts as a resistance.
A daily close above 133.7 levels would validate the breakout from the 5-month-long rectangle chart pattern.
Based on this chart pattern, the potential price target is 167.3 levels.
Kinder Morgan, Inc.-(KMI/NASDAQ)-Long Idea
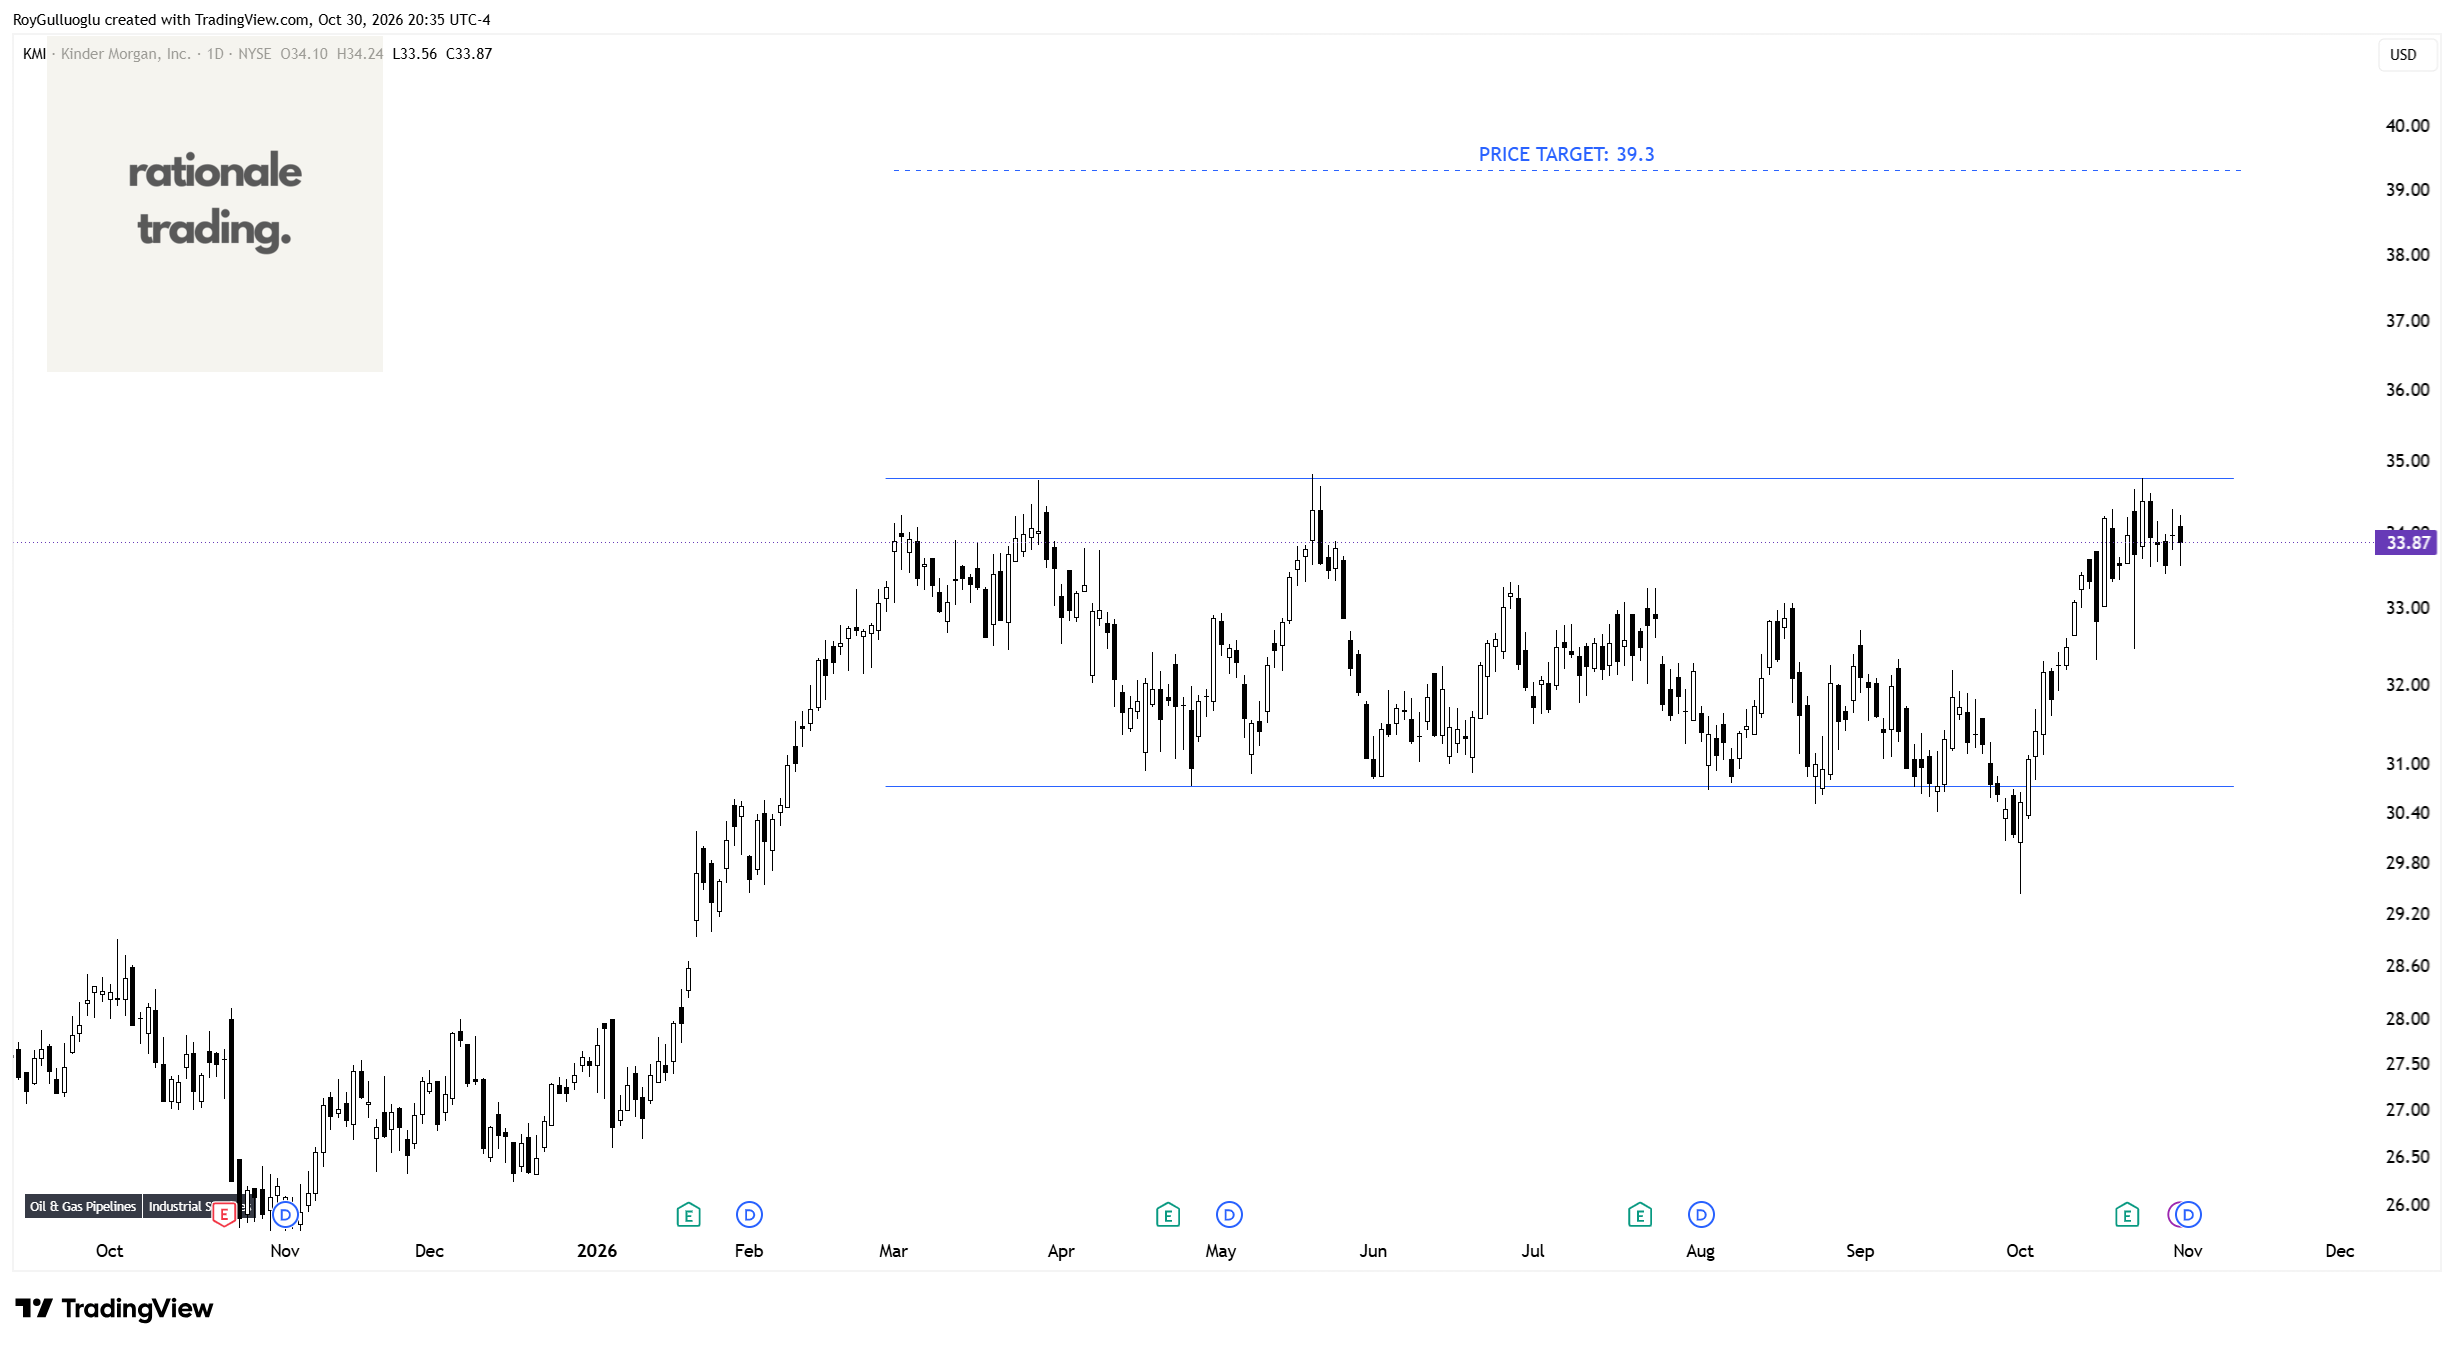
Kinder Morgan, Inc. operates as an energy infrastructure company primarily in North America. It operates through Natural Gas Pipelines, Products Pipelines, Terminals, and CO2 segments.
The above daily chart formed an approximately 5-month-long rectangle chart pattern as a bullish continuation after an uptrend.
Within this pattern, the horizontal boundary at 34.75 levels acts as a resistance.
A daily close above 35.8 levels would validate the breakout from the 5-month-long rectangle chart pattern.
Based on this chart pattern, the potential price target is 39.3 levels.
Wix.com Ltd.-(WIX/NASDAQ)-Long Idea
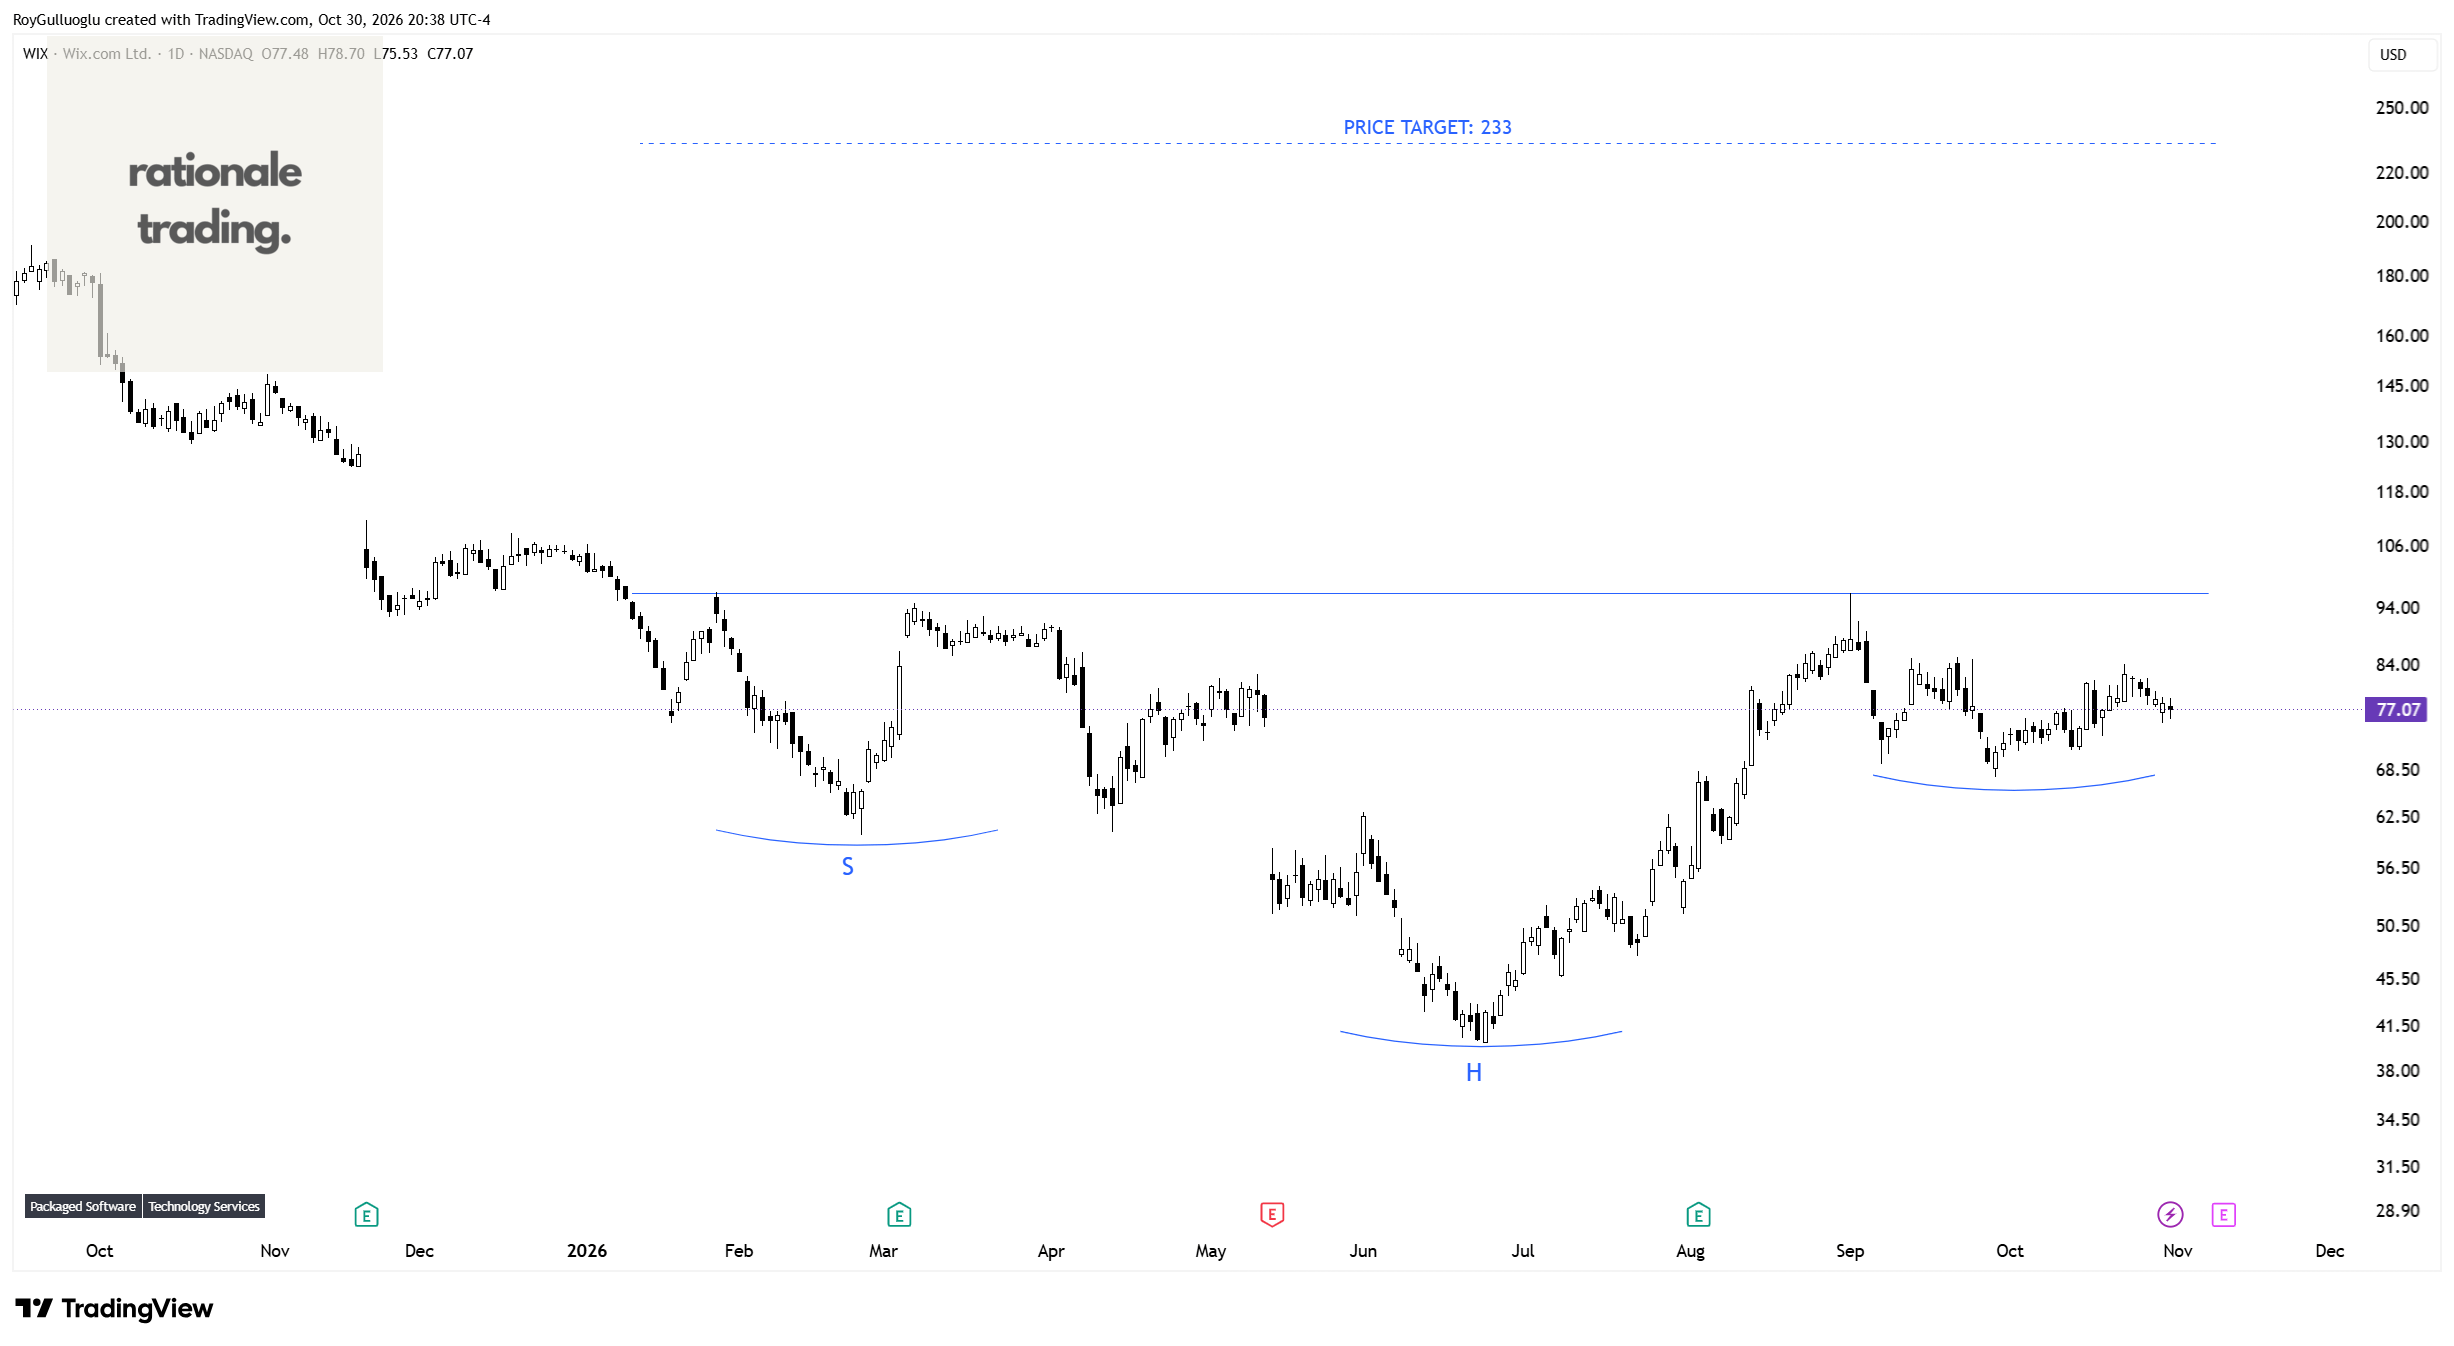
Wix.com Ltd. operates a cloud-based web development platform for registered users and creators in the United States, Europe, Israel, and internationally.
The above daily chart formed an approximately 6-month-long H&S bottom chart pattern as a bullish reversal after a downtrend.
Within this pattern, the horizontal boundary at 96.8 levels acts as a resistance.
A daily close above 99.7 levels would validate the breakout from the 6-month-long H&S bottom chart pattern.
Based on this chart pattern, the potential price target is 233 levels.
Skyworks Solutions, Inc.-(SWKS/NASDAQ)-Long Idea
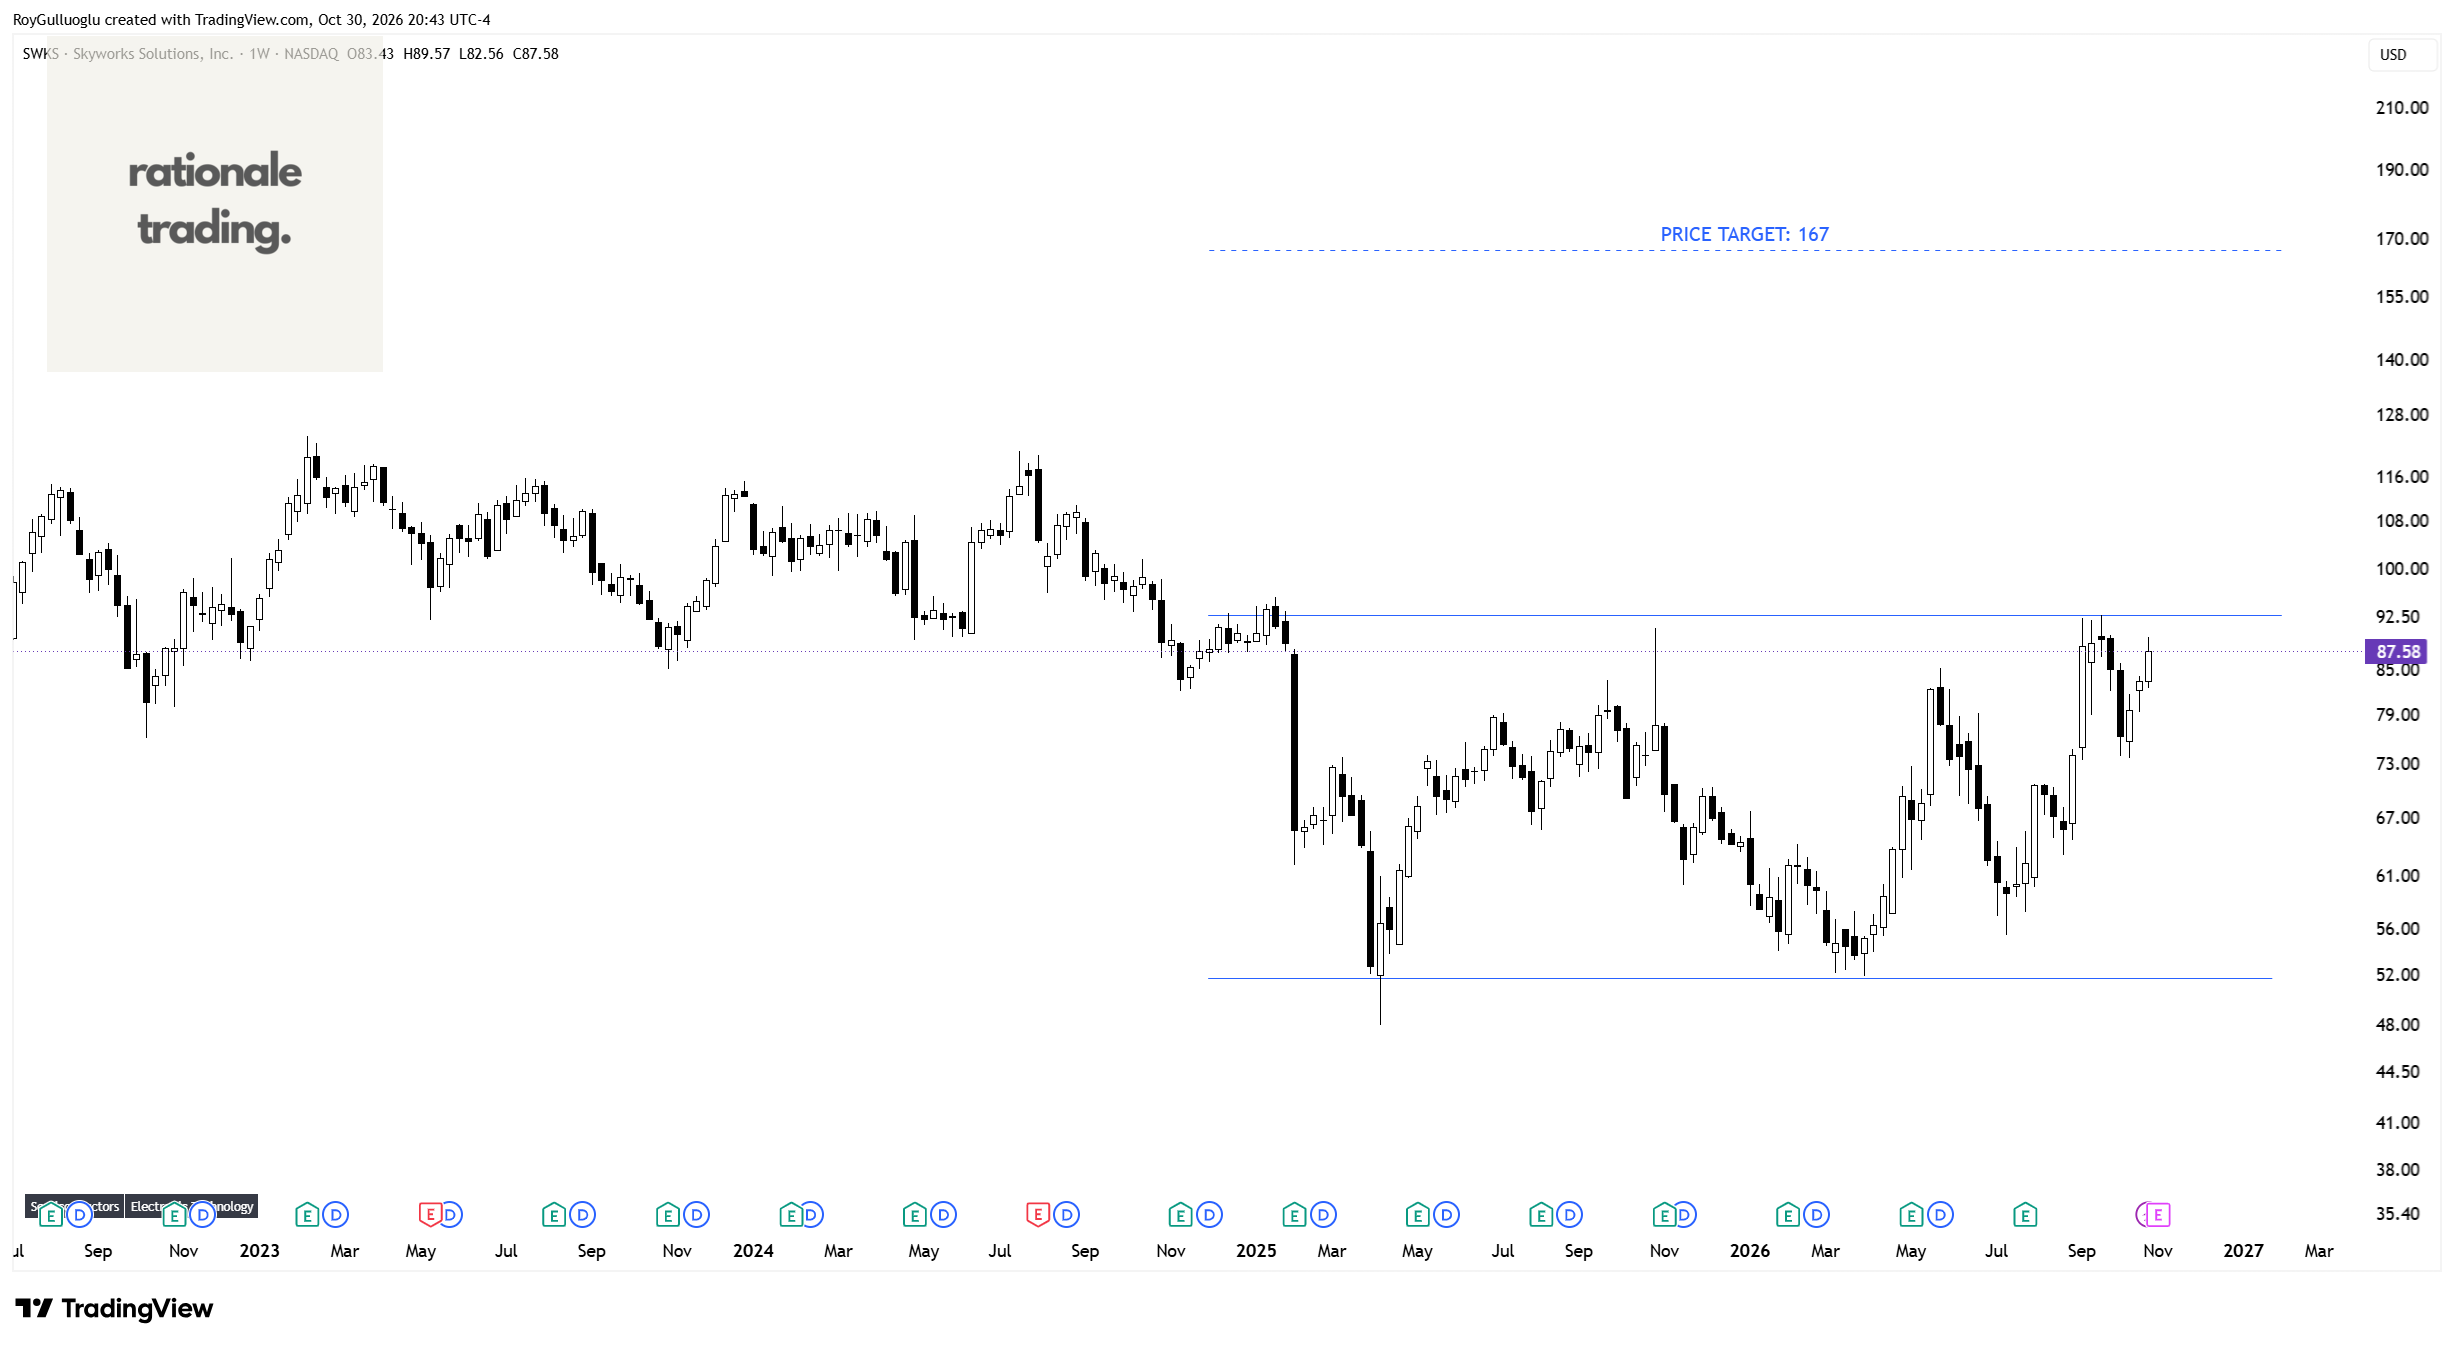
Skyworks Solutions, Inc., together with its subsidiaries, develops, manufactures, and markets analog and mixed-signal semiconductor products and solutions in the United States, Taiwan, China, South Korea, Europe, the Middle East, Africa, and the Asia Pacific.
The above weekly chart formed an approximately 25-month-long rectangle chart pattern as a bullish reversal after a downtrend.
Within this pattern, the horizontal boundary at 92.8 levels acts as a resistance.
A daily close above 95.5 levels would validate the breakout from the 25-month-long rectangle chart pattern.
Based on this chart pattern, the potential price target is 167 levels.
Hello Roy, how do you get to the price target for SWKS. When I measure the depth of the rectangle here I got just 130 target area. Thank you for the learning. Best wishes Florian
Thank you Roy for the help. Really appreciate. I just took the measure from Edwards/ Magee in points. Best wishes Florian