


New setups
United Rentals, Inc-(URI/NYSE)-Long Idea
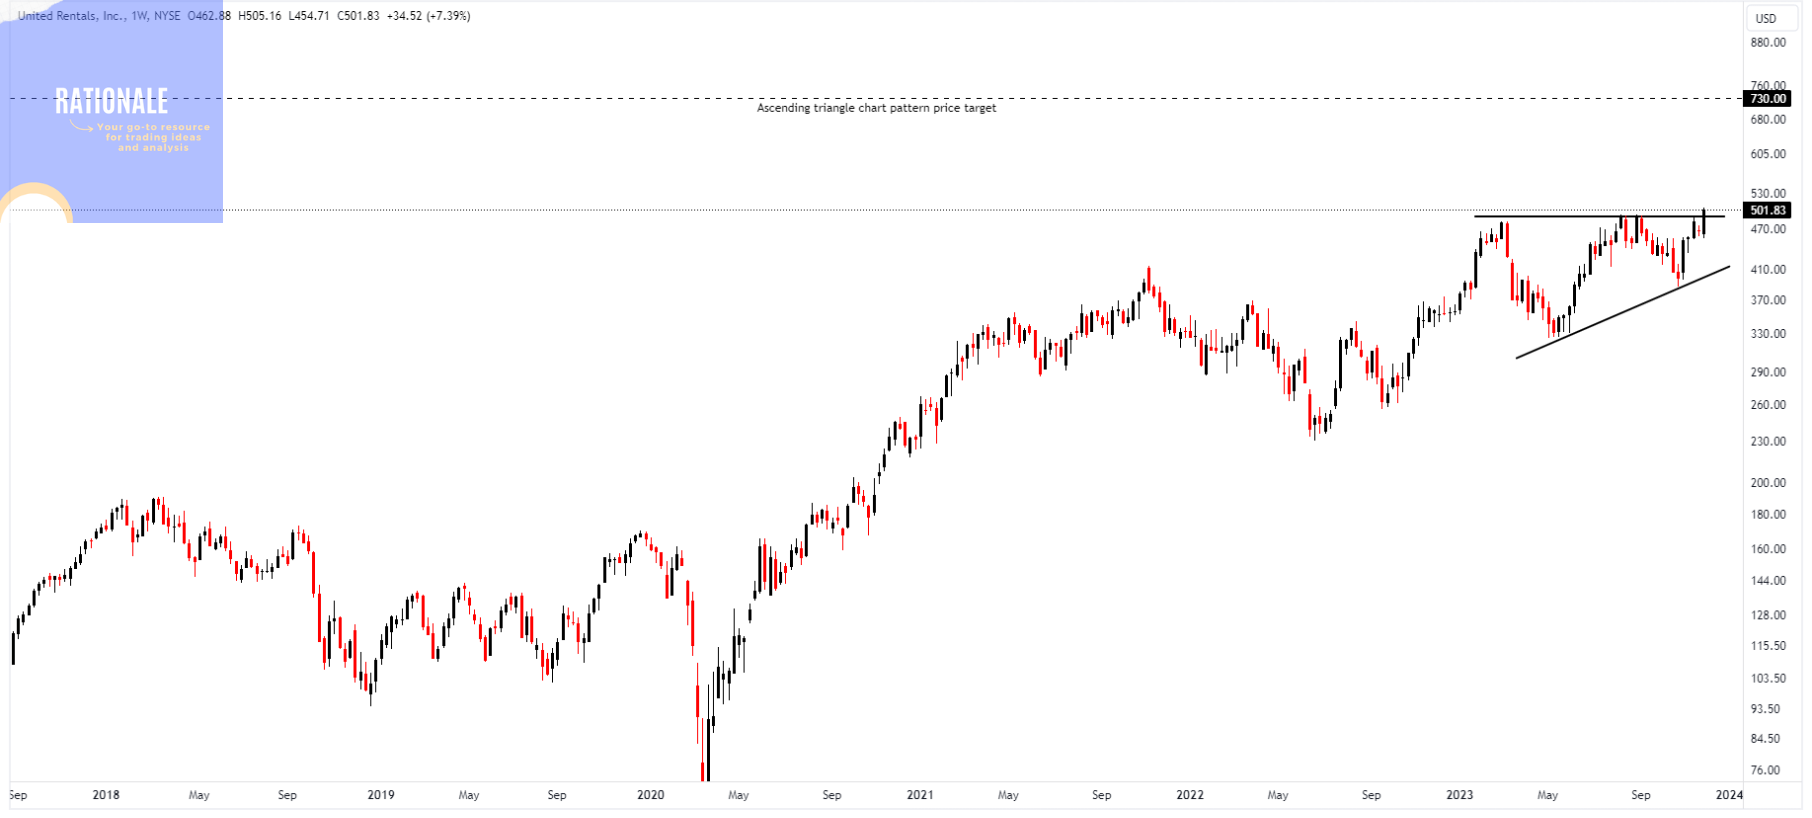
United Rentals is known for renting out a wide variety of equipment and tools used in construction, industrial, and other applications. This includes heavy machinery, earthmoving equipment, aerial work platforms, forklifts, generators, and a range of smaller tools.
The above weekly chart formed an approximately 9-month-long ascending triangle chart pattern as a bullish continuation after an uptrend.
Within this pattern, the horizontal boundary at 490 levels acts as a resistance.
A daily close above 504.7 levels would validate the breakout from the 9-month-long ascending triangle chart pattern.
Based on this chart pattern, the potential price target is 730 levels.
URI, classified under the "industrials" sector, falls under the “Large Cap - Value” stock category.
The valuation of especially value stocks is significantly influenced by long-term interest rates. When long-term rates decrease, as occurred this week, the equities' valuation increases. This is because lower rates begin to be employed as a discount factor in the valuation process.
A potential breakout would be to the all-time high which is another positive factor to consider about the equity.
Multiple quarters of EPS acceleration YoY in Quarterly Earnings is another strength of the stock.
American International Group, Inc-(AIG/NYSE)-Long Idea
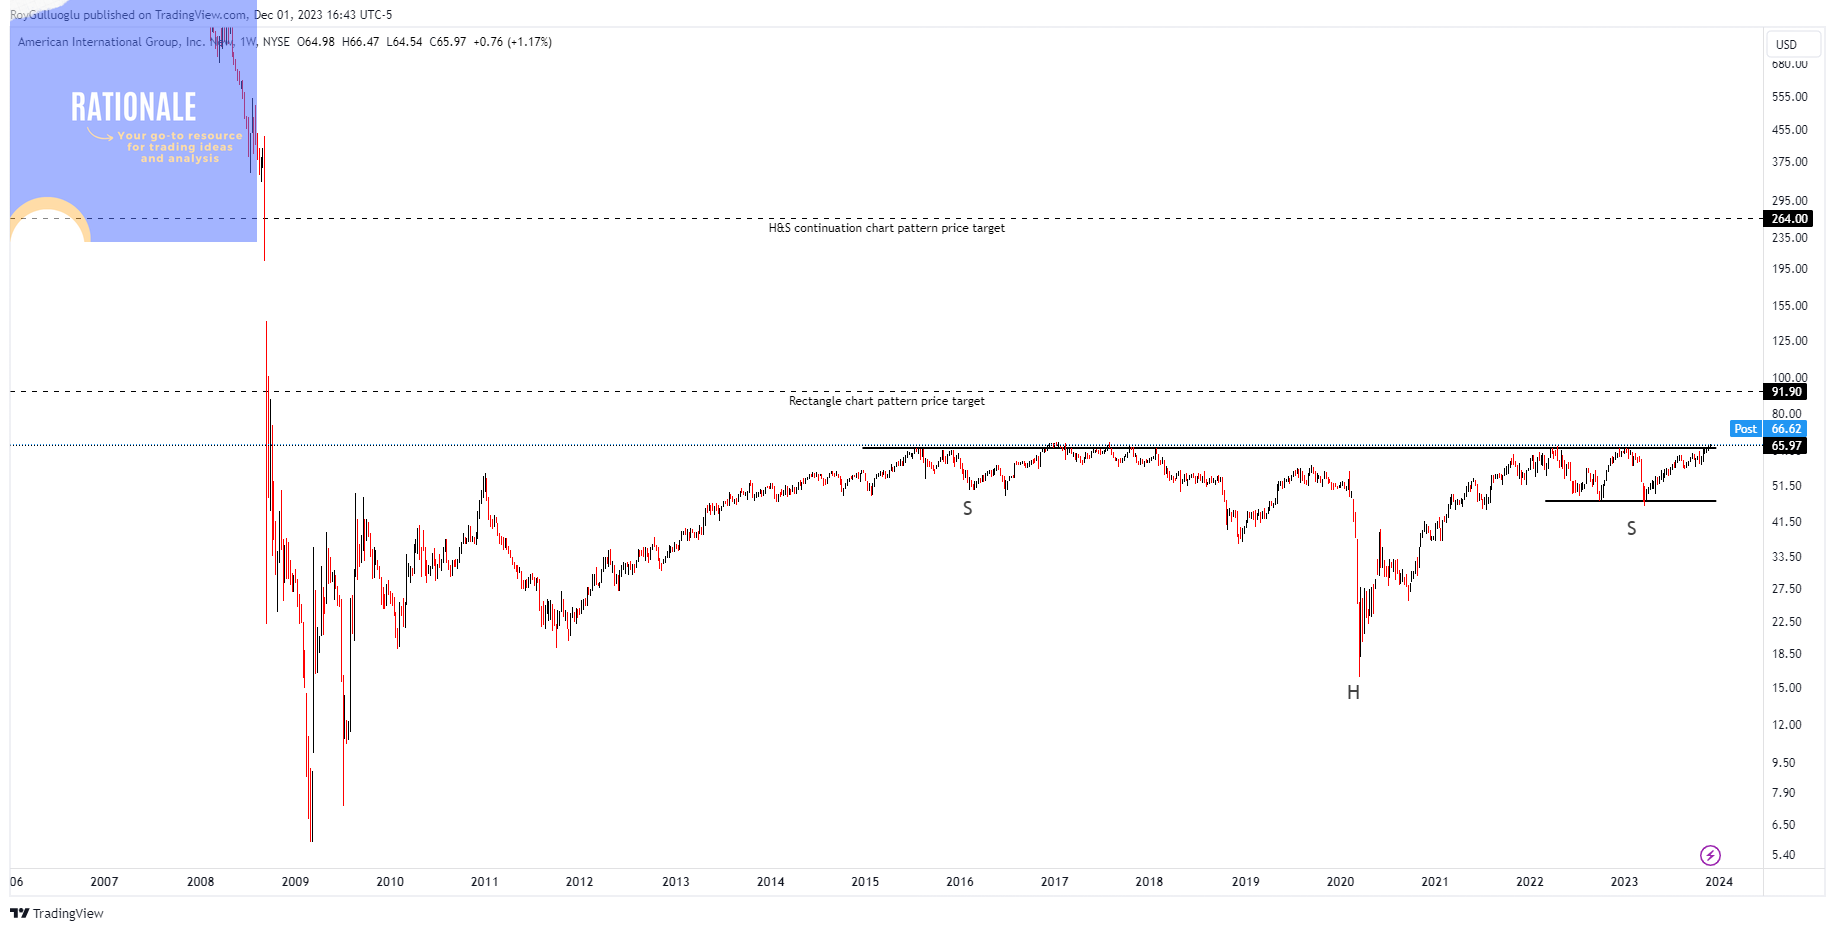
AIG is a multinational insurance company. AIG operates in various segments of the insurance industry, providing a wide range of insurance products and services to individuals, businesses, and institutional clients. These insurance offerings cover areas such as property and casualty insurance, life insurance, retirement products, and mortgage insurance.
The above weekly chart formed an approximately 8.5-YEARS-long H&S top chart pattern as a bullish continuation after an uptrend.
Also, an approximately 22-month-long rectangle chart pattern is formed as a right shoulder of the above chart pattern.
Within this pattern, the horizontal boundary at 65 levels acts as a resistance.
A daily close above 66.95 levels would validate both breakouts from the 8.5-years-long H&S top and 22-month-long rectangle chart pattern.
Based on these chart patterns, the potential price target is 264 and 91.9 levels respectively.
Since 2015, the price has seen 8 rejections from the 65$ level. The longer the consolidation, the stronger we would expect the subsequent price movement.
AIG, classified under the "financial sector" sector, falls under the “Large Cap - Income” stock category.
Waste Management, Inc-(WM/NYSE)-Long Idea
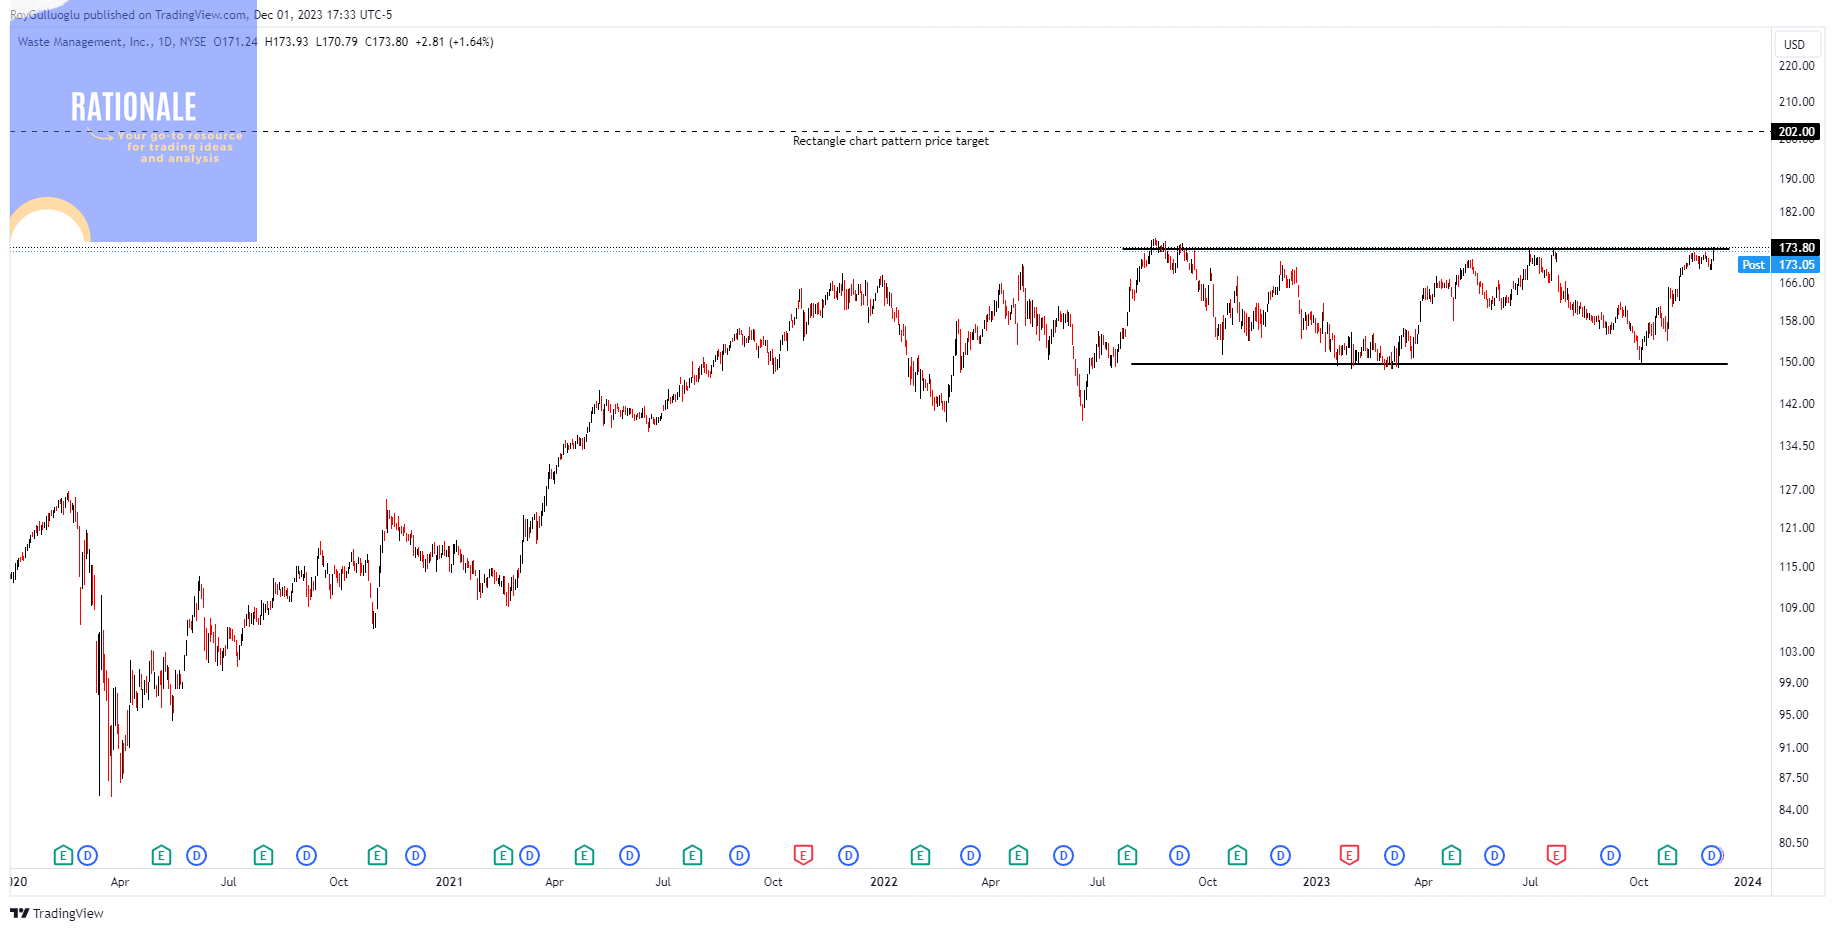
Waste Management is one of the largest waste management and environmental services companies in North America.
The above daily chart formed an approximately 10-month-long rectangle chart pattern as a bullish continuation after an uptrend.
Within this pattern, the horizontal boundary at 173.8 levels acts as a resistance.
A daily close above 179 levels would validate the breakout from the 10-month-long rectangle chart pattern.
Based on this chart pattern, the potential price target is 202 levels.
WM, classified under the "industrials" sector, falls under the “Large Cap - Value” stock category.
Same with URI, the WM is also a value stock that is affected by long-term interest rates. When these rates decline, the valuation of equities rises.
Ameriprise Financials, Inc-(AMP/NYSE)-Long Idea
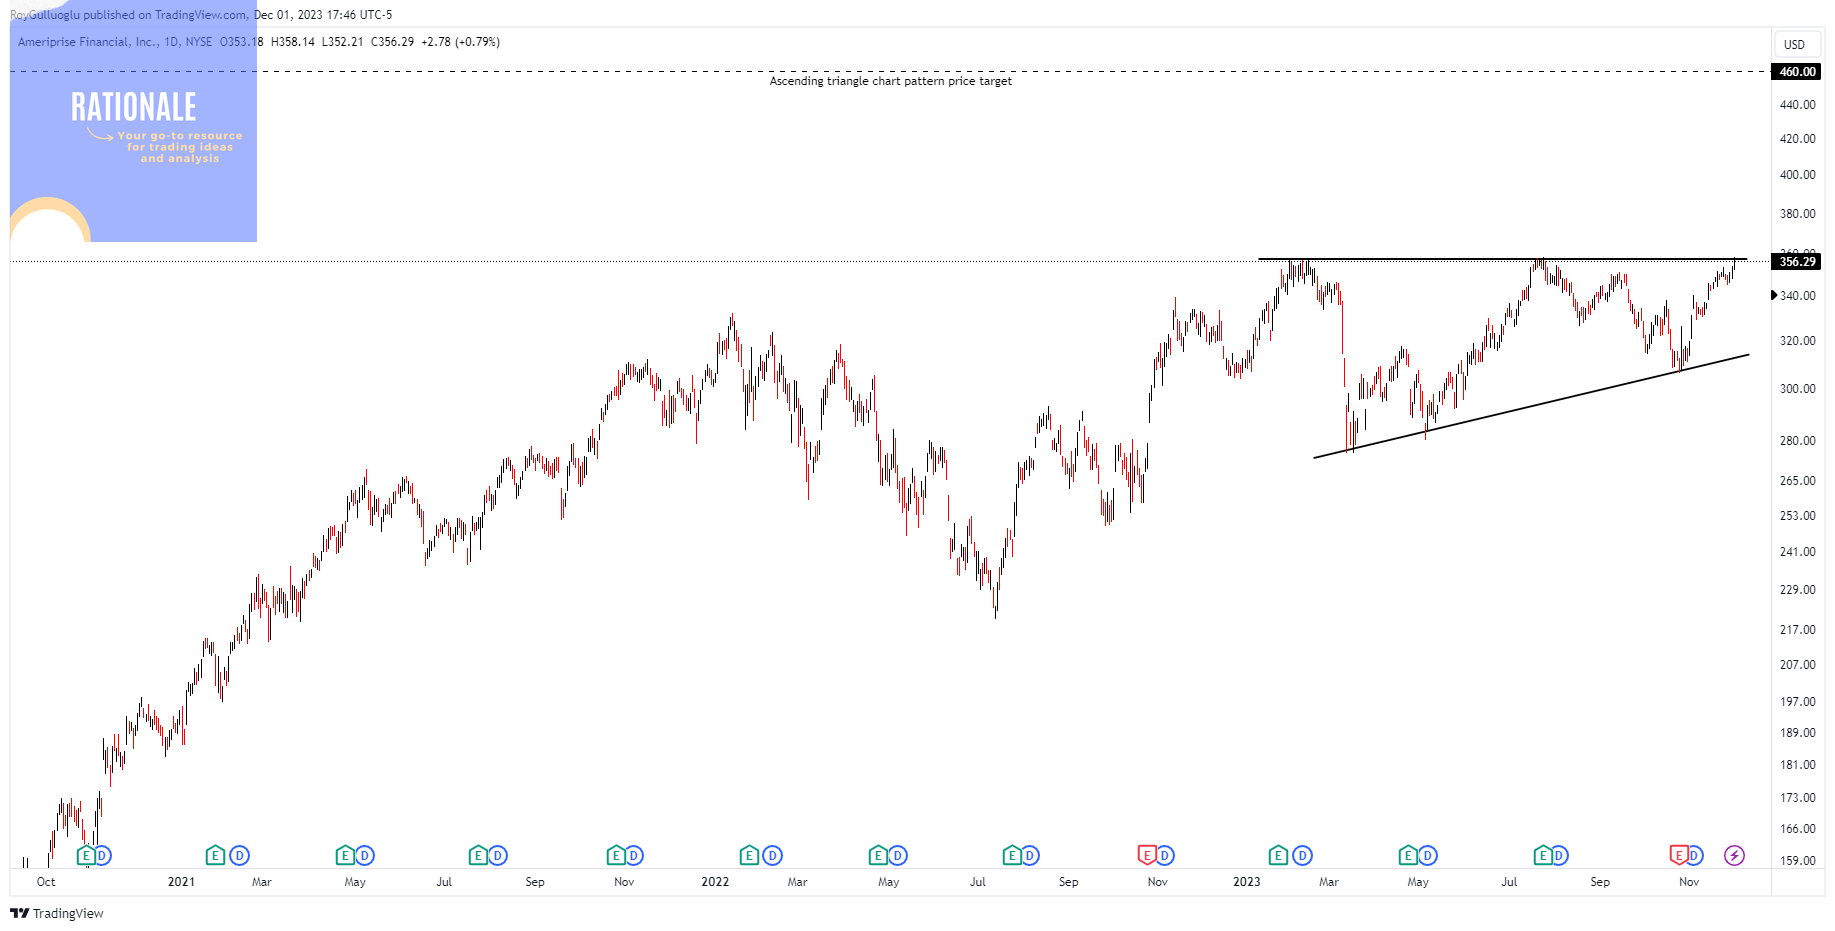
Ameriprise Financials is a diversified financial services company that provides a range of financial planning, investment management, and other related services. Financial Planning, Investment Management, Insurance Products, Retirement Planning, Wealth Management, Brokerage Services.
The above daily chart formed an approximately 7-month-long ascending triangle chart pattern as a bullish continuation after an uptrend.
Within this pattern, the horizontal boundary at 357.3 levels acts as a resistance.
A daily close above 368 levels would validate the breakout from the 7-month-long ascending triangle chart pattern.
Based on this chart pattern, the potential price target is 460 levels.
AMP, classified under the "financials" sector, falls under the “Small Cap - Income” stock category.
Diamondback Energy, Inc-(FANG/NYSE)-Long Idea
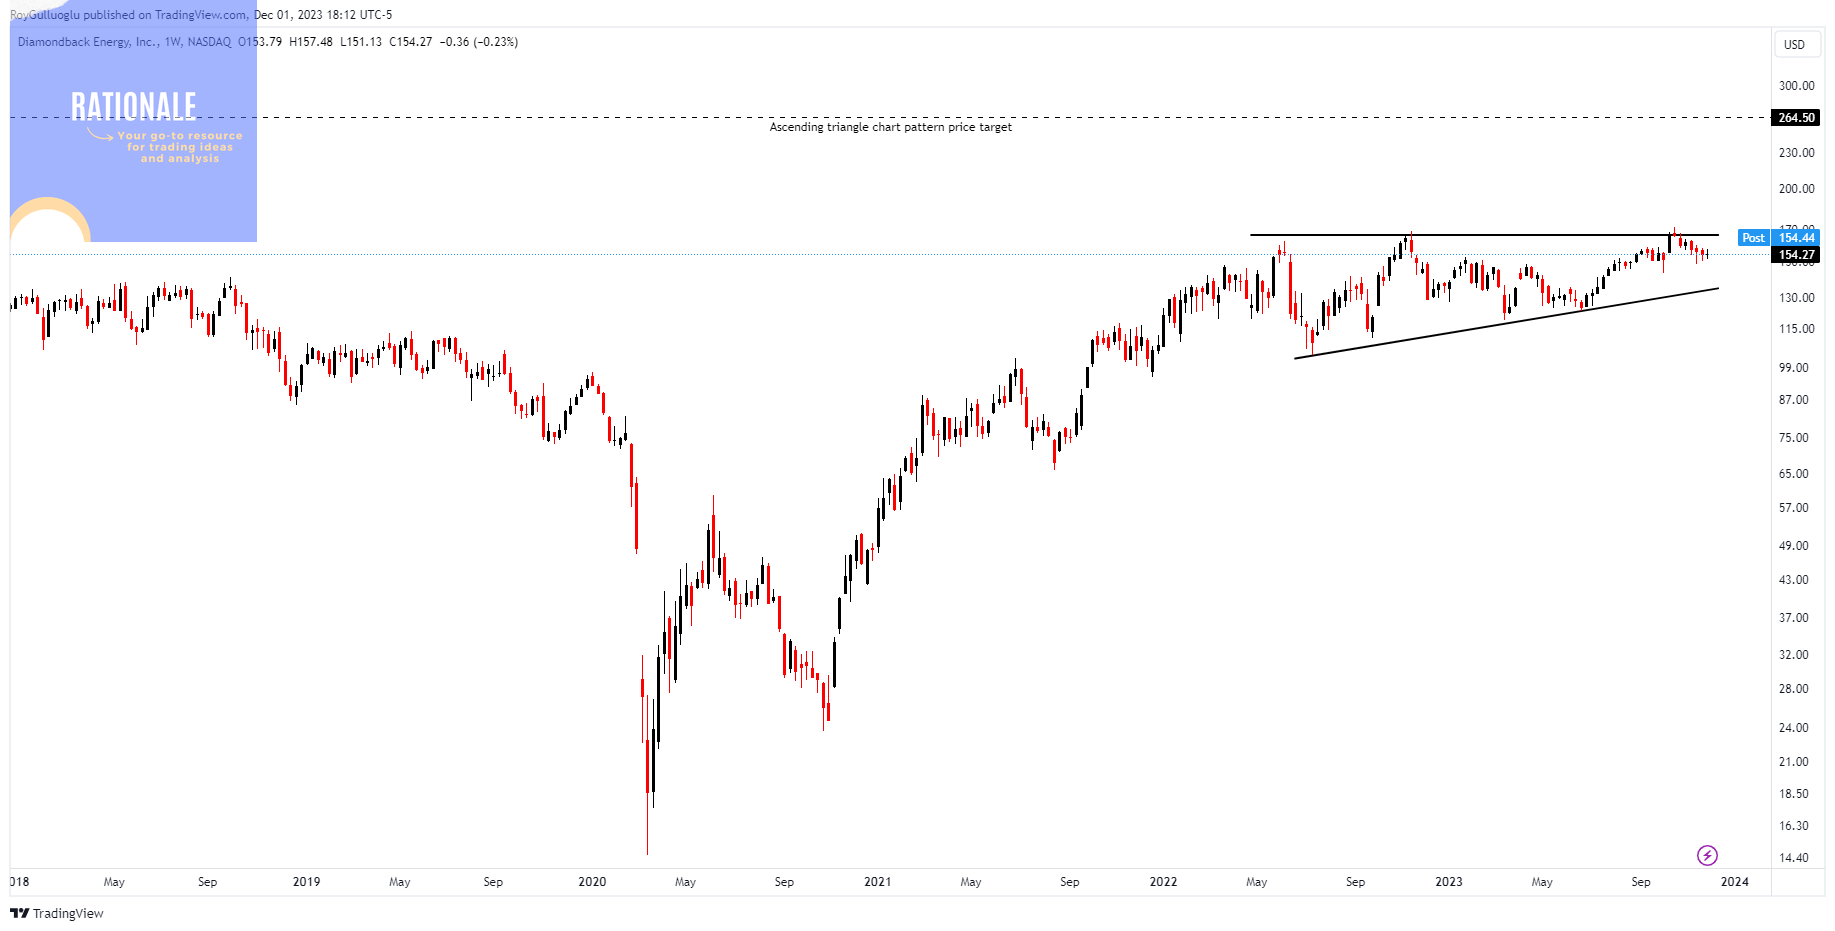
Diamondback Energy, Inc. is an independent oil and natural gas company engaged in the exploration, development, and production of hydrocarbons.
The above weekly chart formed an approximately 3-month-long ascending triangle chart pattern.
Within this pattern, the horizontal boundary at 166.6 levels acts as a resistance.
A daily close above 171.59 levels would validate the breakout from the 3-month-long ascending triangle chart pattern.
Based on this chart pattern, the potential price target is 264.5 levels.
AGI, classified under the "energy" sector, falls under the “Large Cap - Income” stock category.
Follow-ups
EnLink Midstream-(ENLC/NYSE)-Long Idea
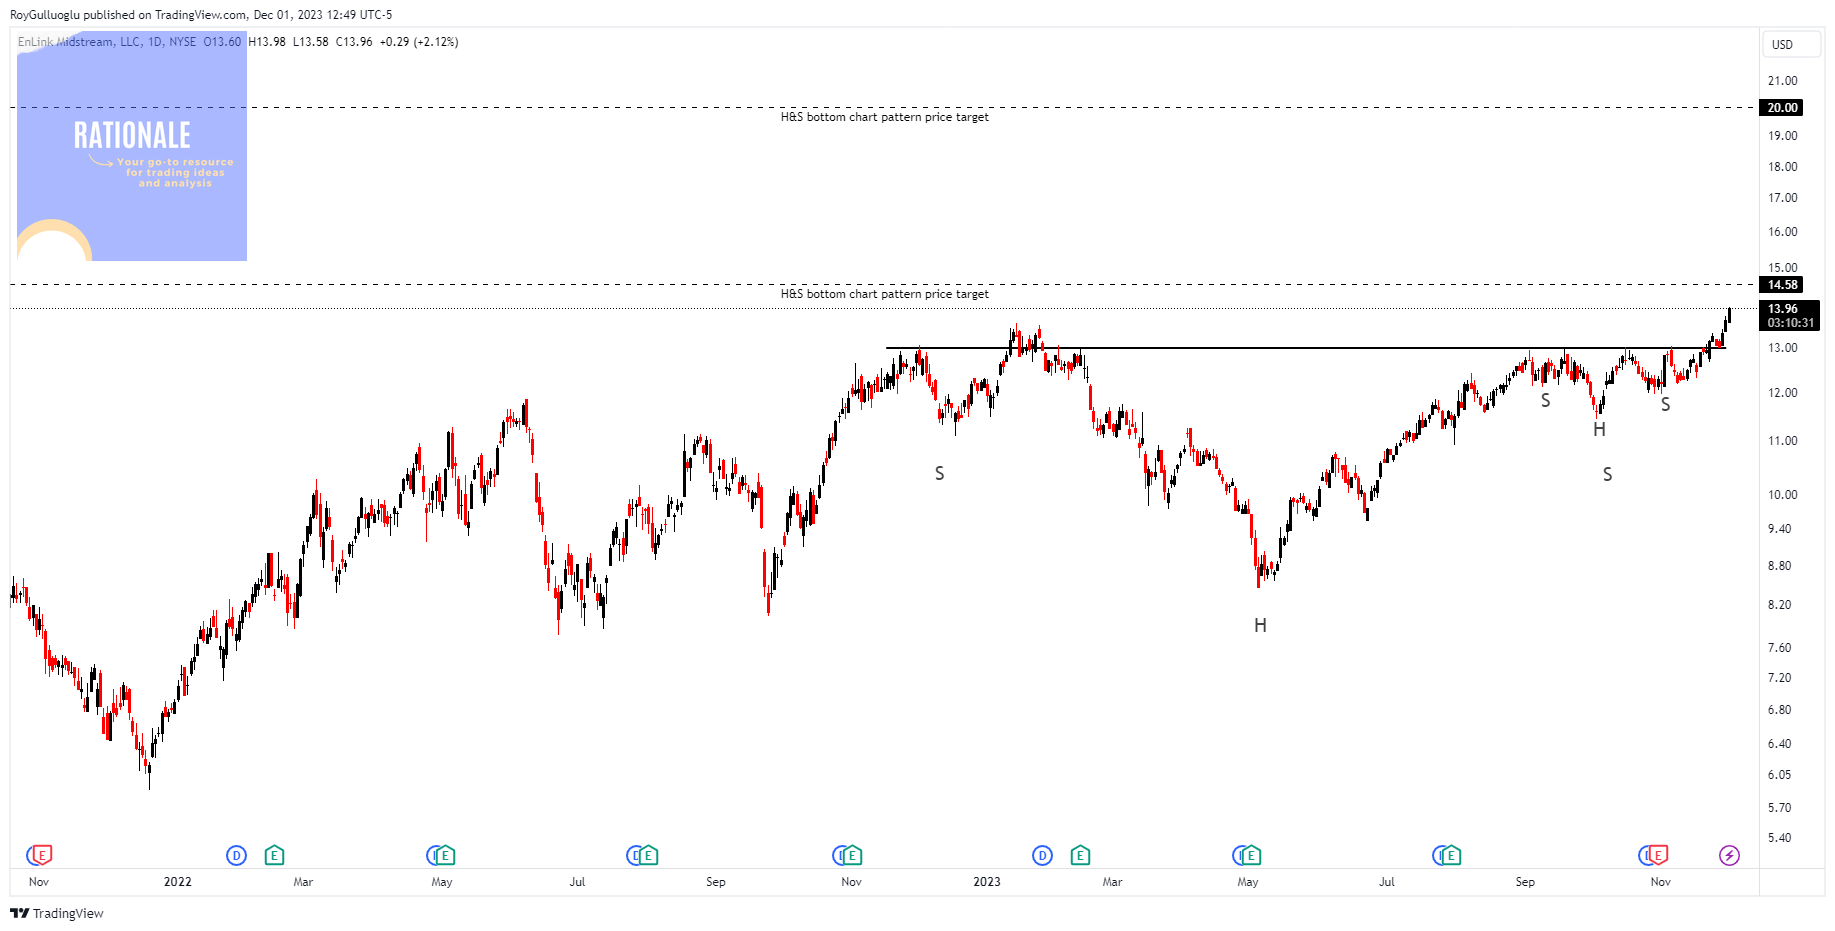
You can click the ENLC ticker above to access the first report explaining the RATIONALE behind the trade idea.
Pinterest Inc-(PINS/NYSE)-Long Idea
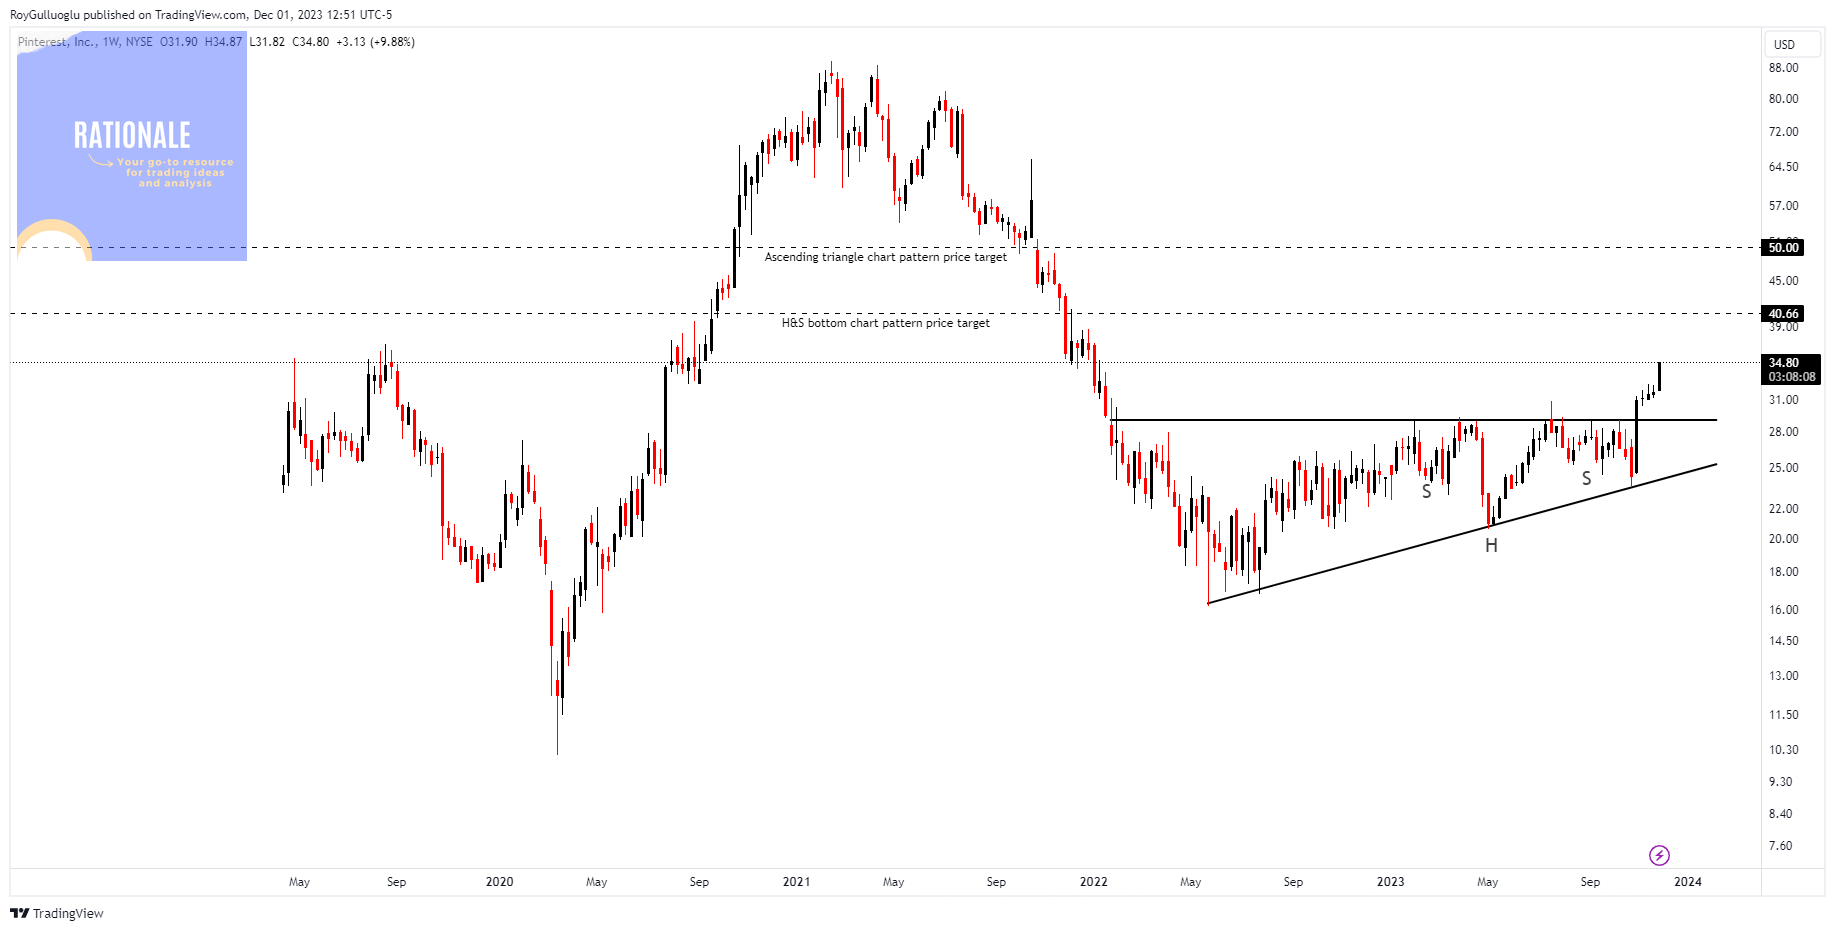
You can click the PINS ticker above to access the first report explaining the RATIONALE behind the trade idea.
Seagate Technology Holdings PLC-(STX/NASDAQ)-Long Idea
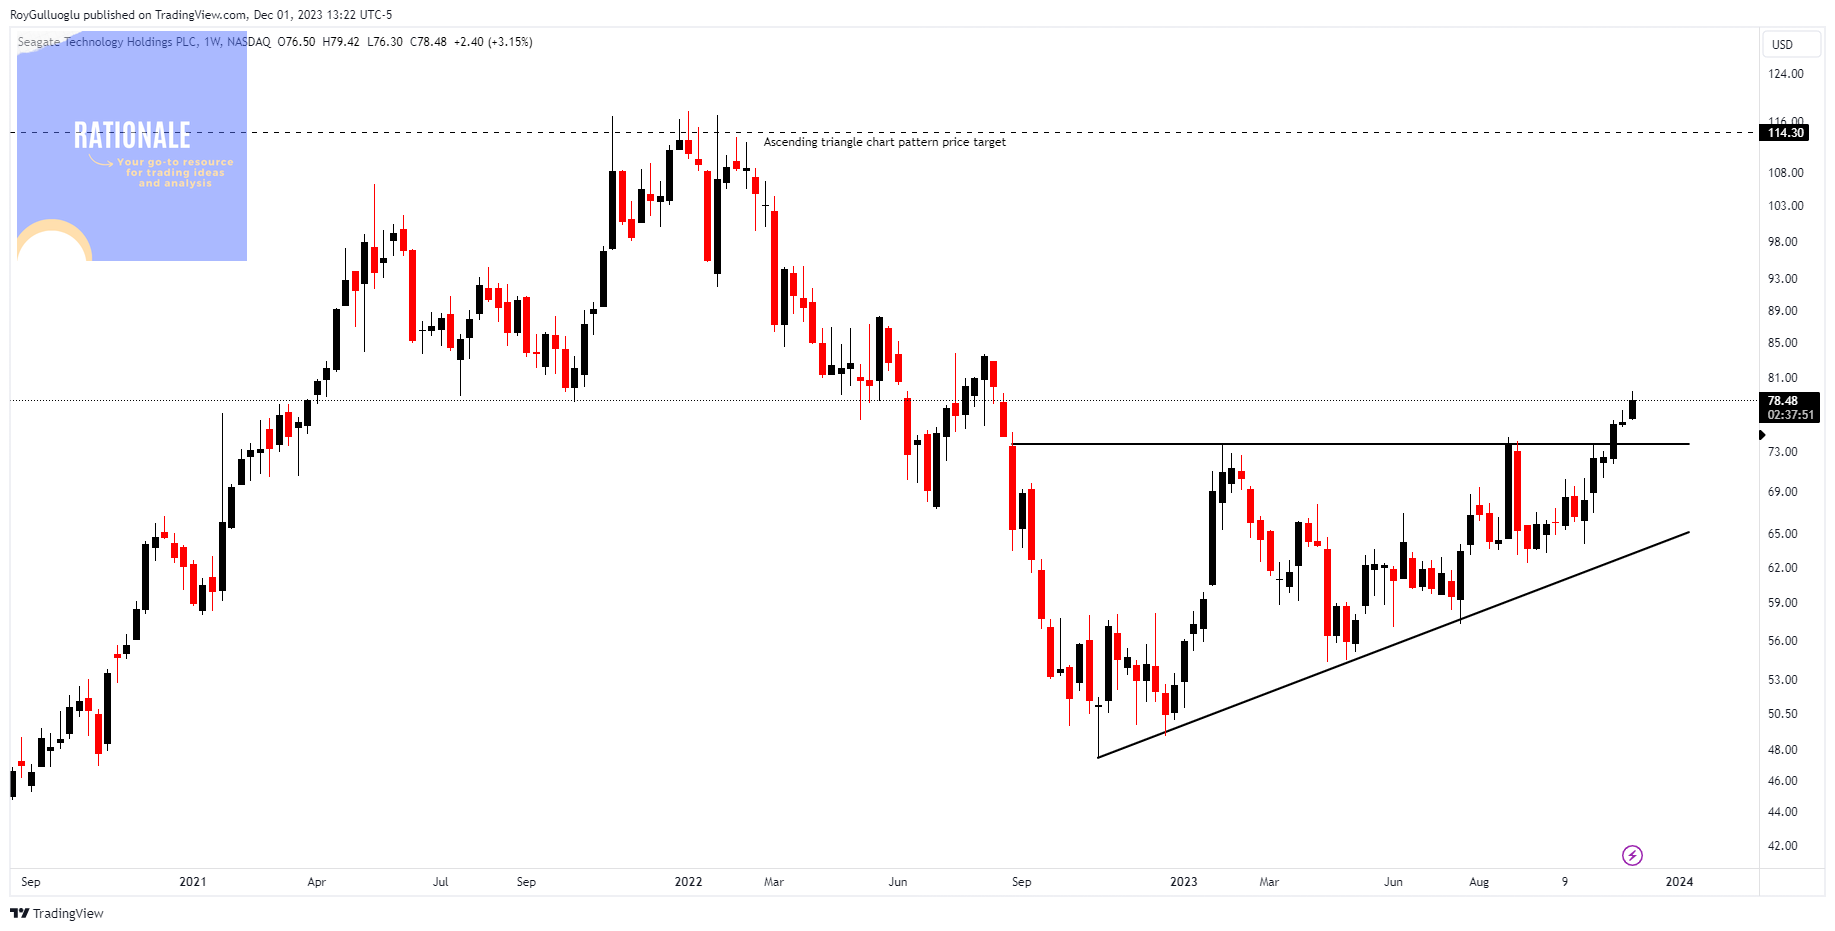
You can click the STX ticker above to access the first report explaining the RATIONALE behind the trade idea.
Celanese Corporation-(CE/NYSE)-Long Idea
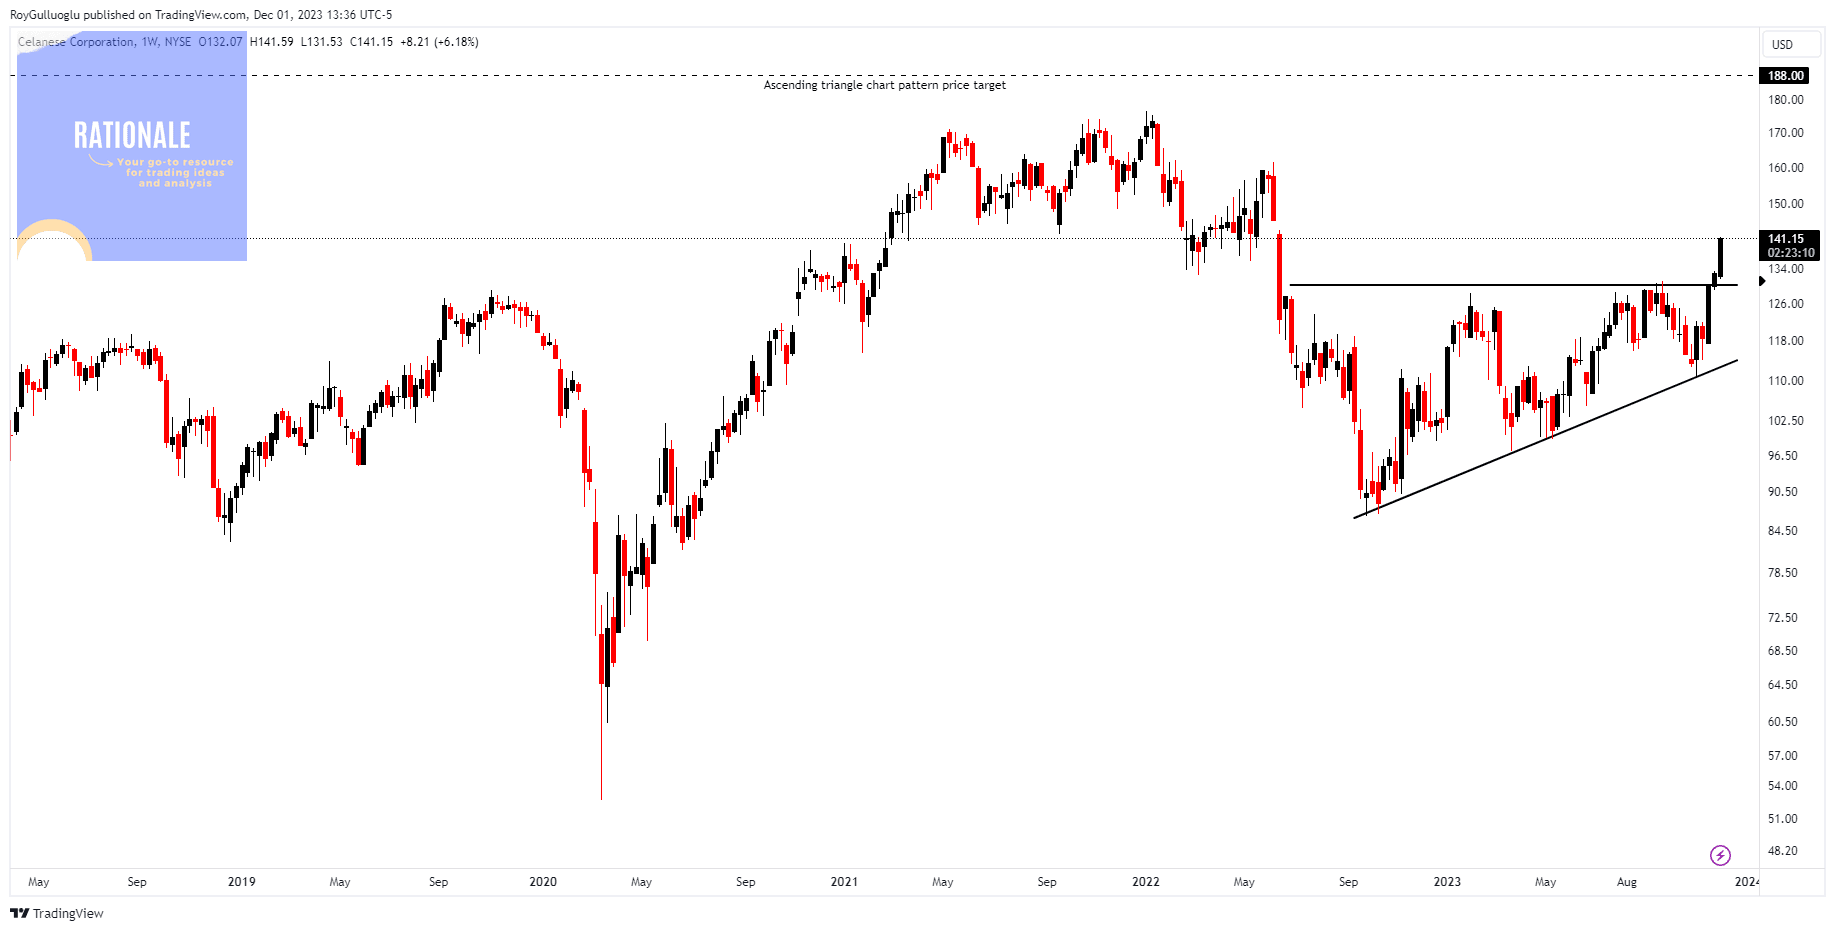
You can click the CE ticker above to access the first report explaining the RATIONALE behind the trade idea.
UnitedHealth Group Incorporated-(UNH/NYSE)-Long Idea
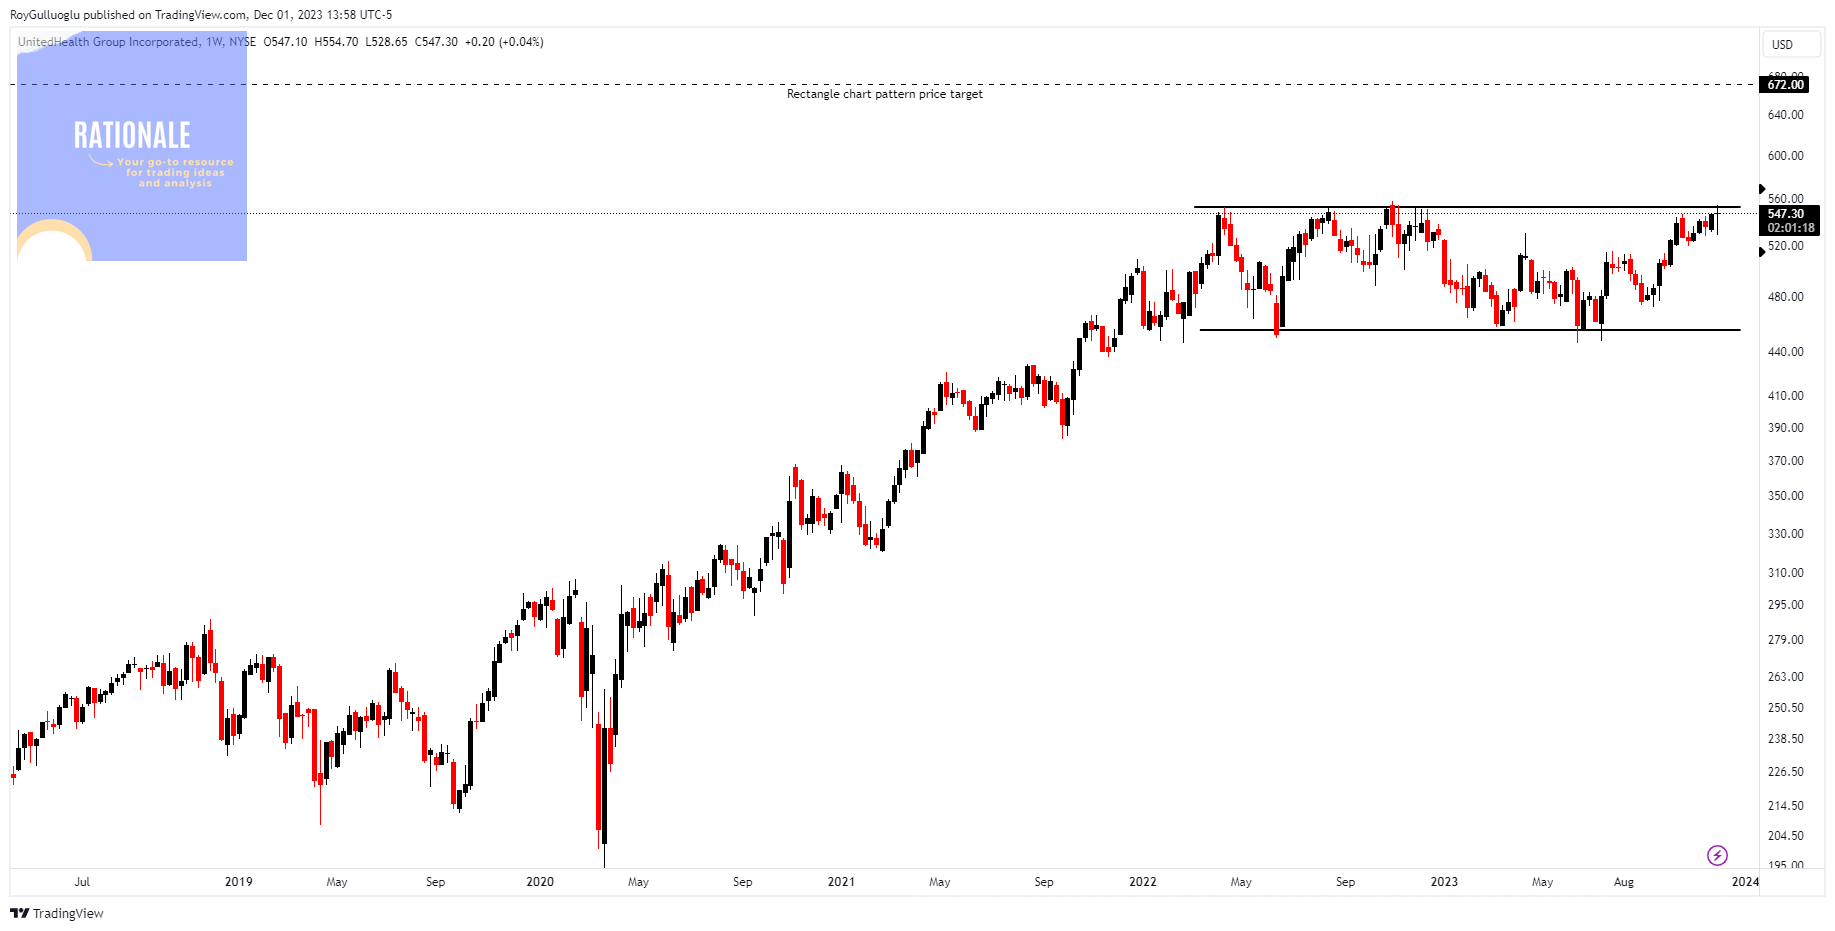
You can click the UNH ticker above to access the first report explaining the RATIONALE behind the trade idea.
Wyndham Hotels & Resorts-(WH/NYSE)-Long Idea
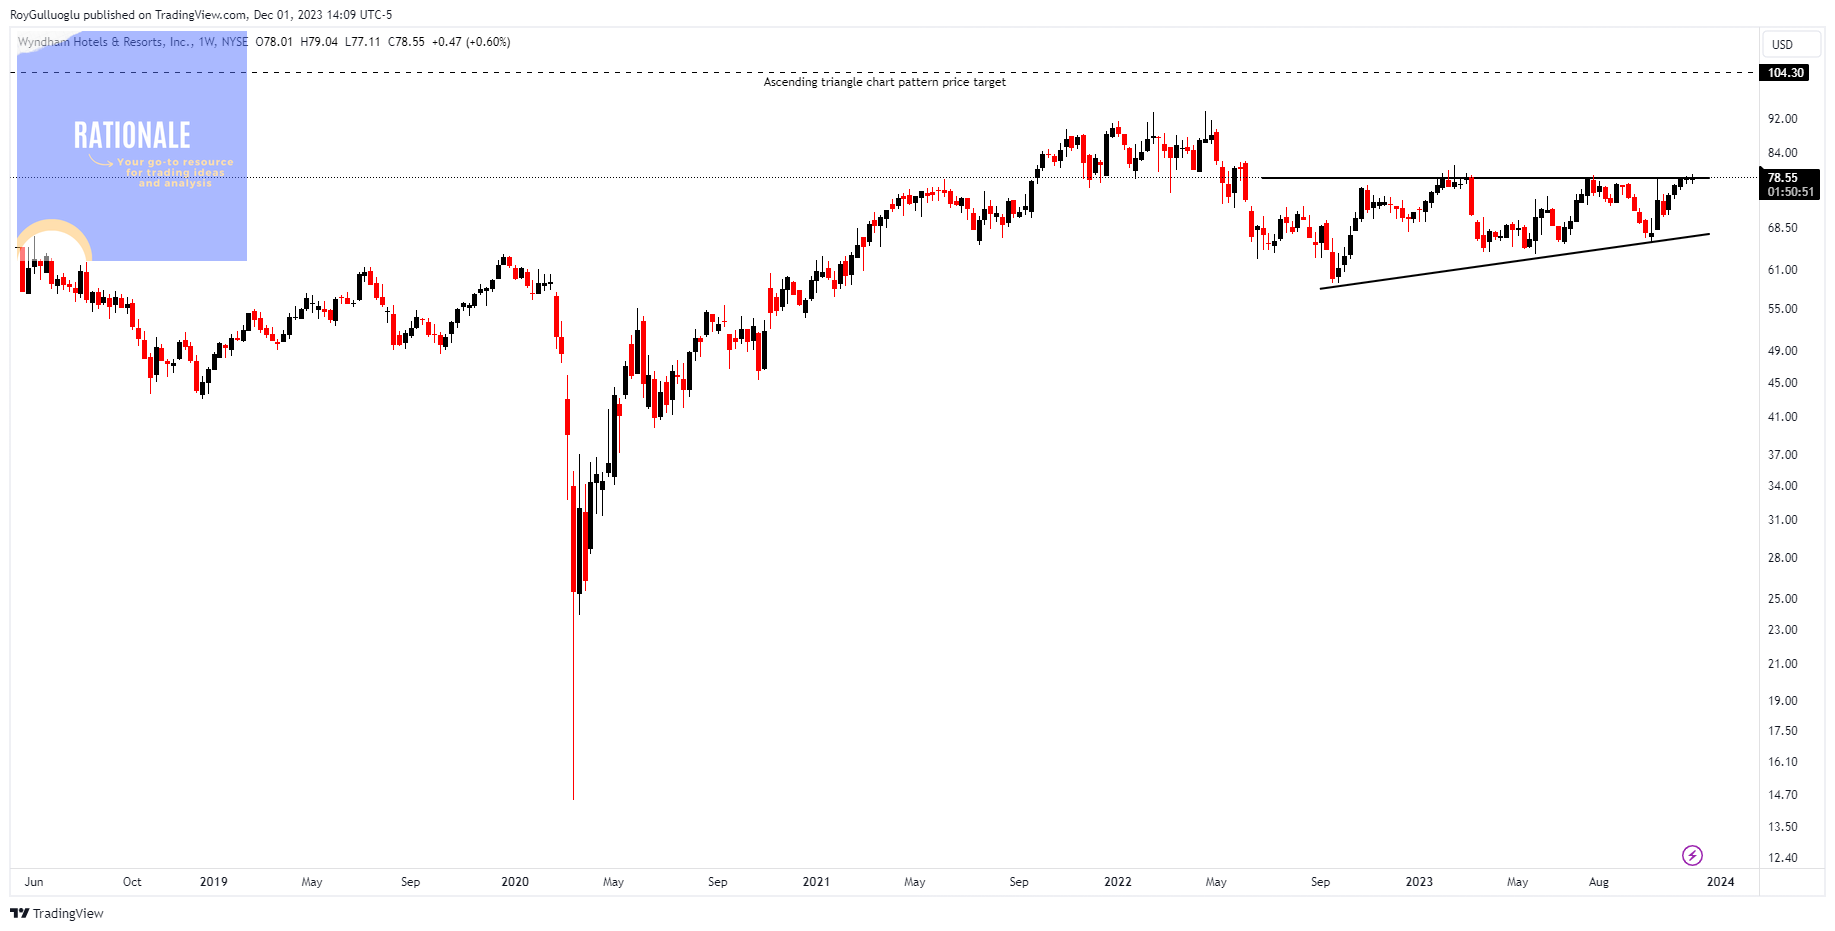
You can click the WH ticker above to access the first report explaining the RATIONALE behind the trade idea.
Alamos Gold, Inc-(AGI/NYSE)-Long Idea
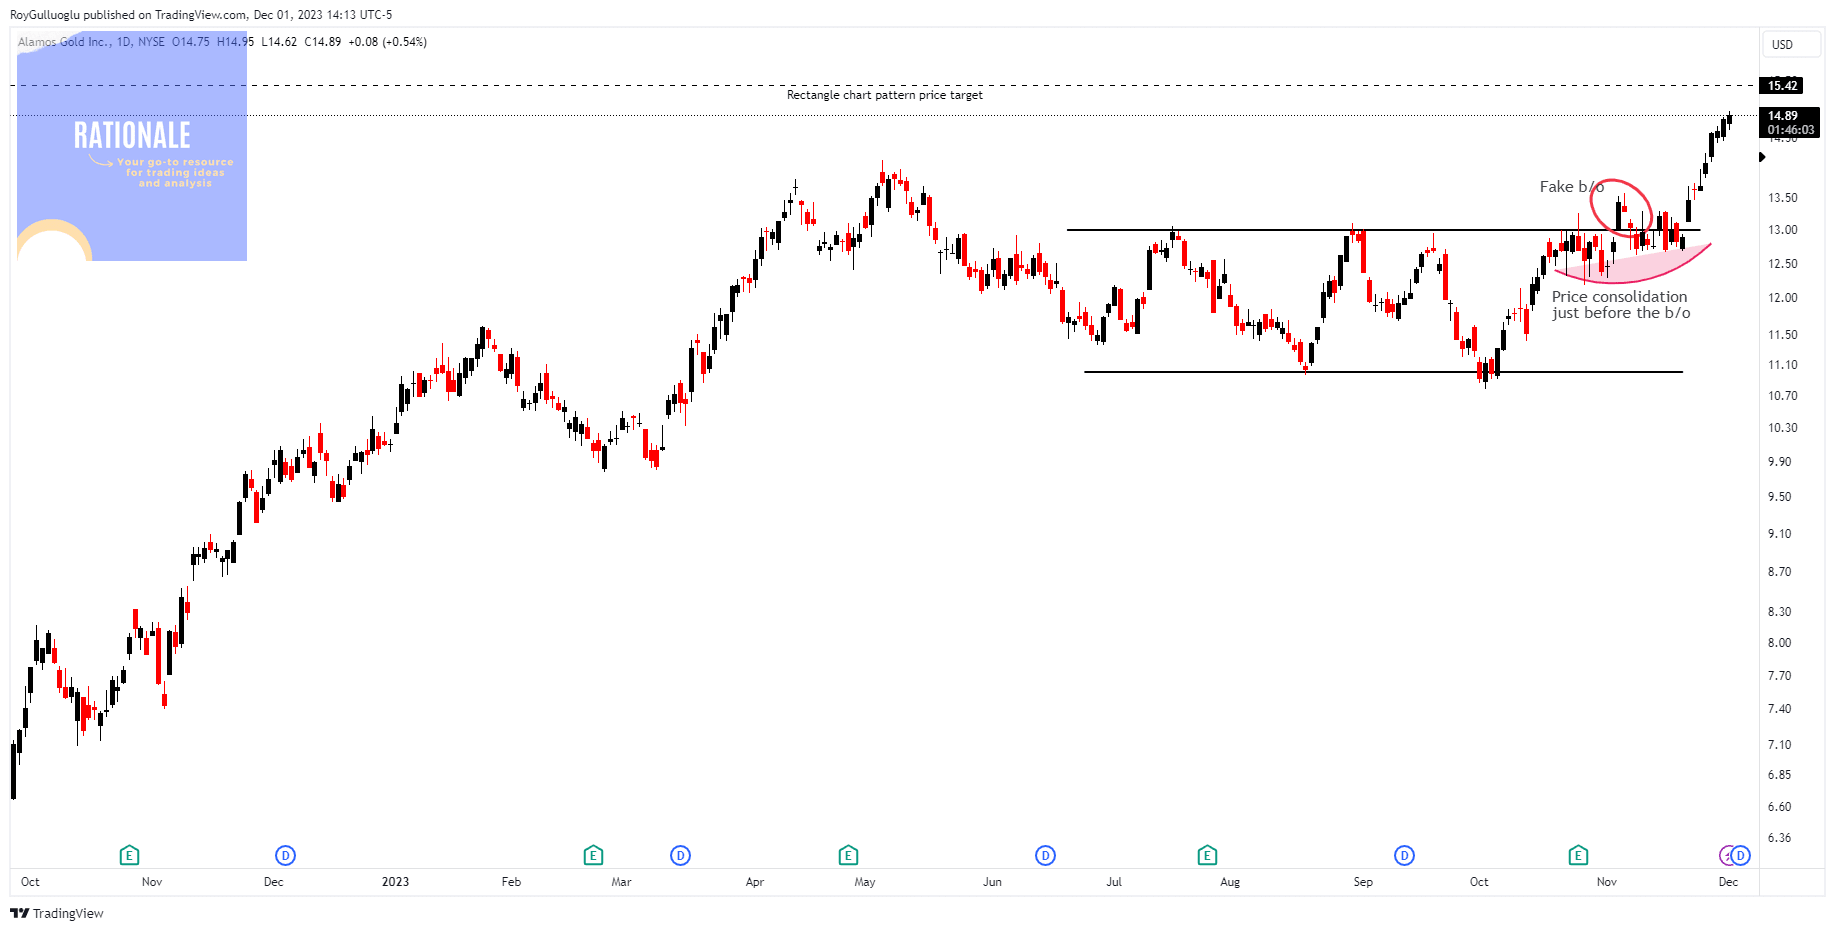
You can click the AGI ticker above to access the first report explaining the RATIONALE behind the trade idea.
Palo Alto Networks, Inc-(PANW/NASDAQ)-Long Idea
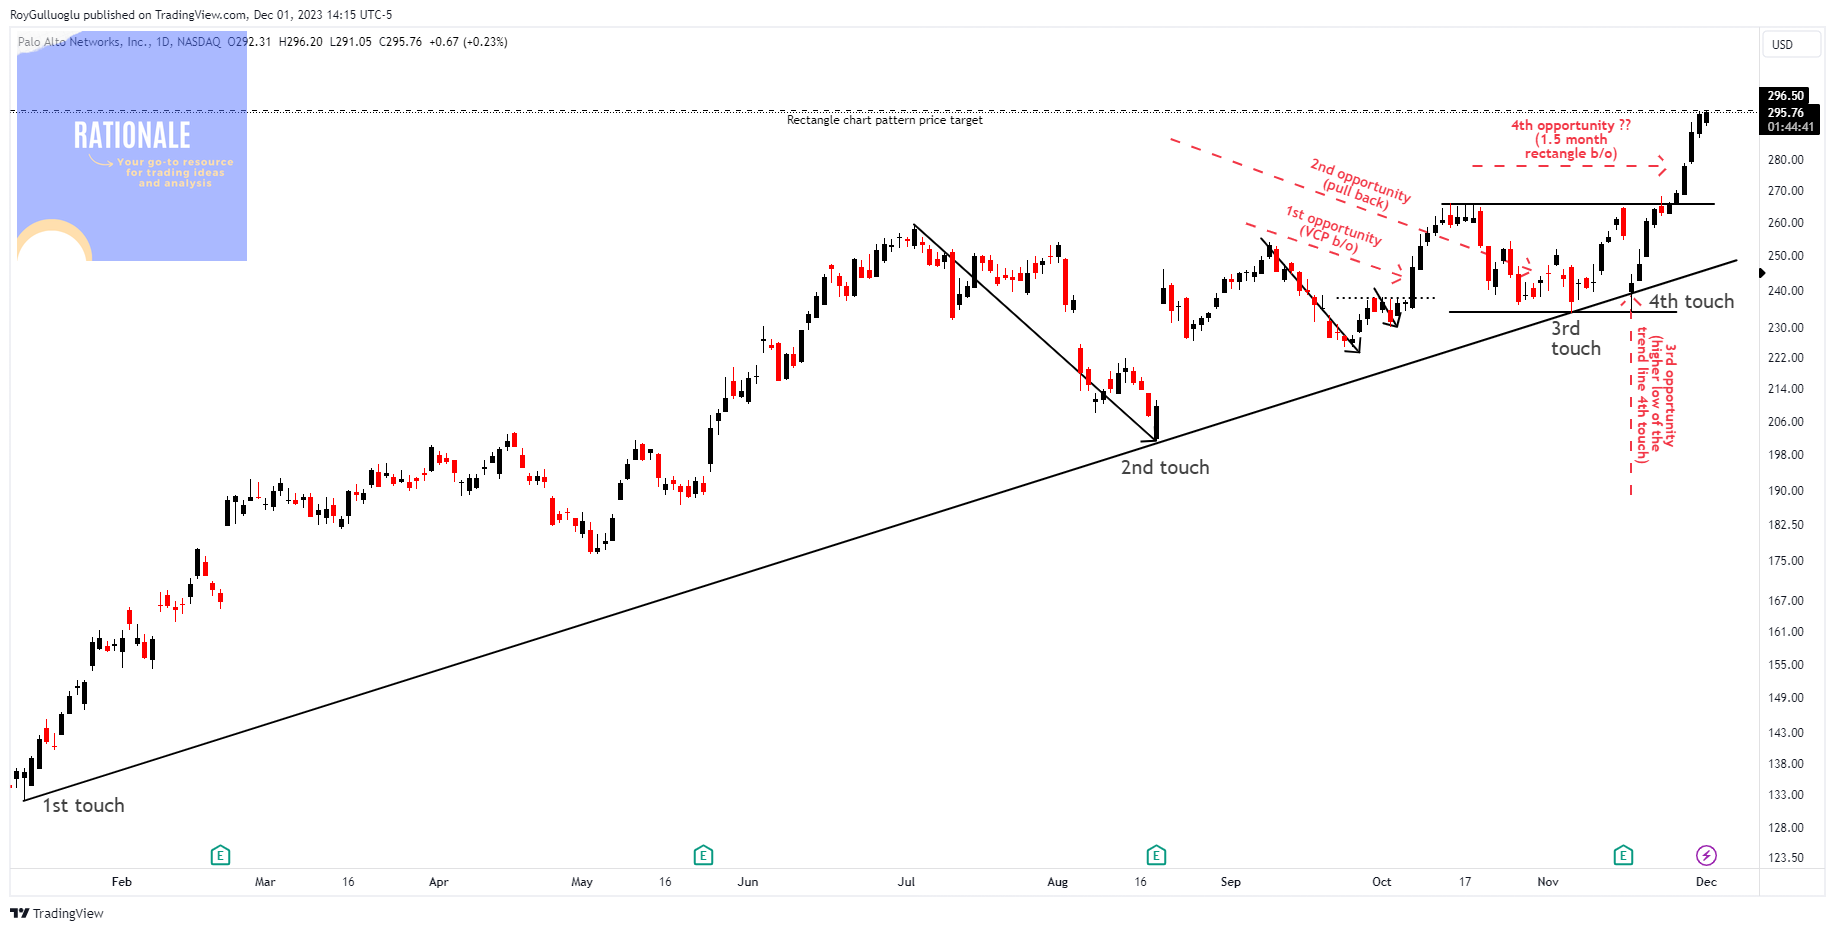
You can click the PANW ticker above to access the first report explaining the RATIONALE behind the trade idea.