


Mastercard Incorporated-(MA/NYSE)-Long Idea
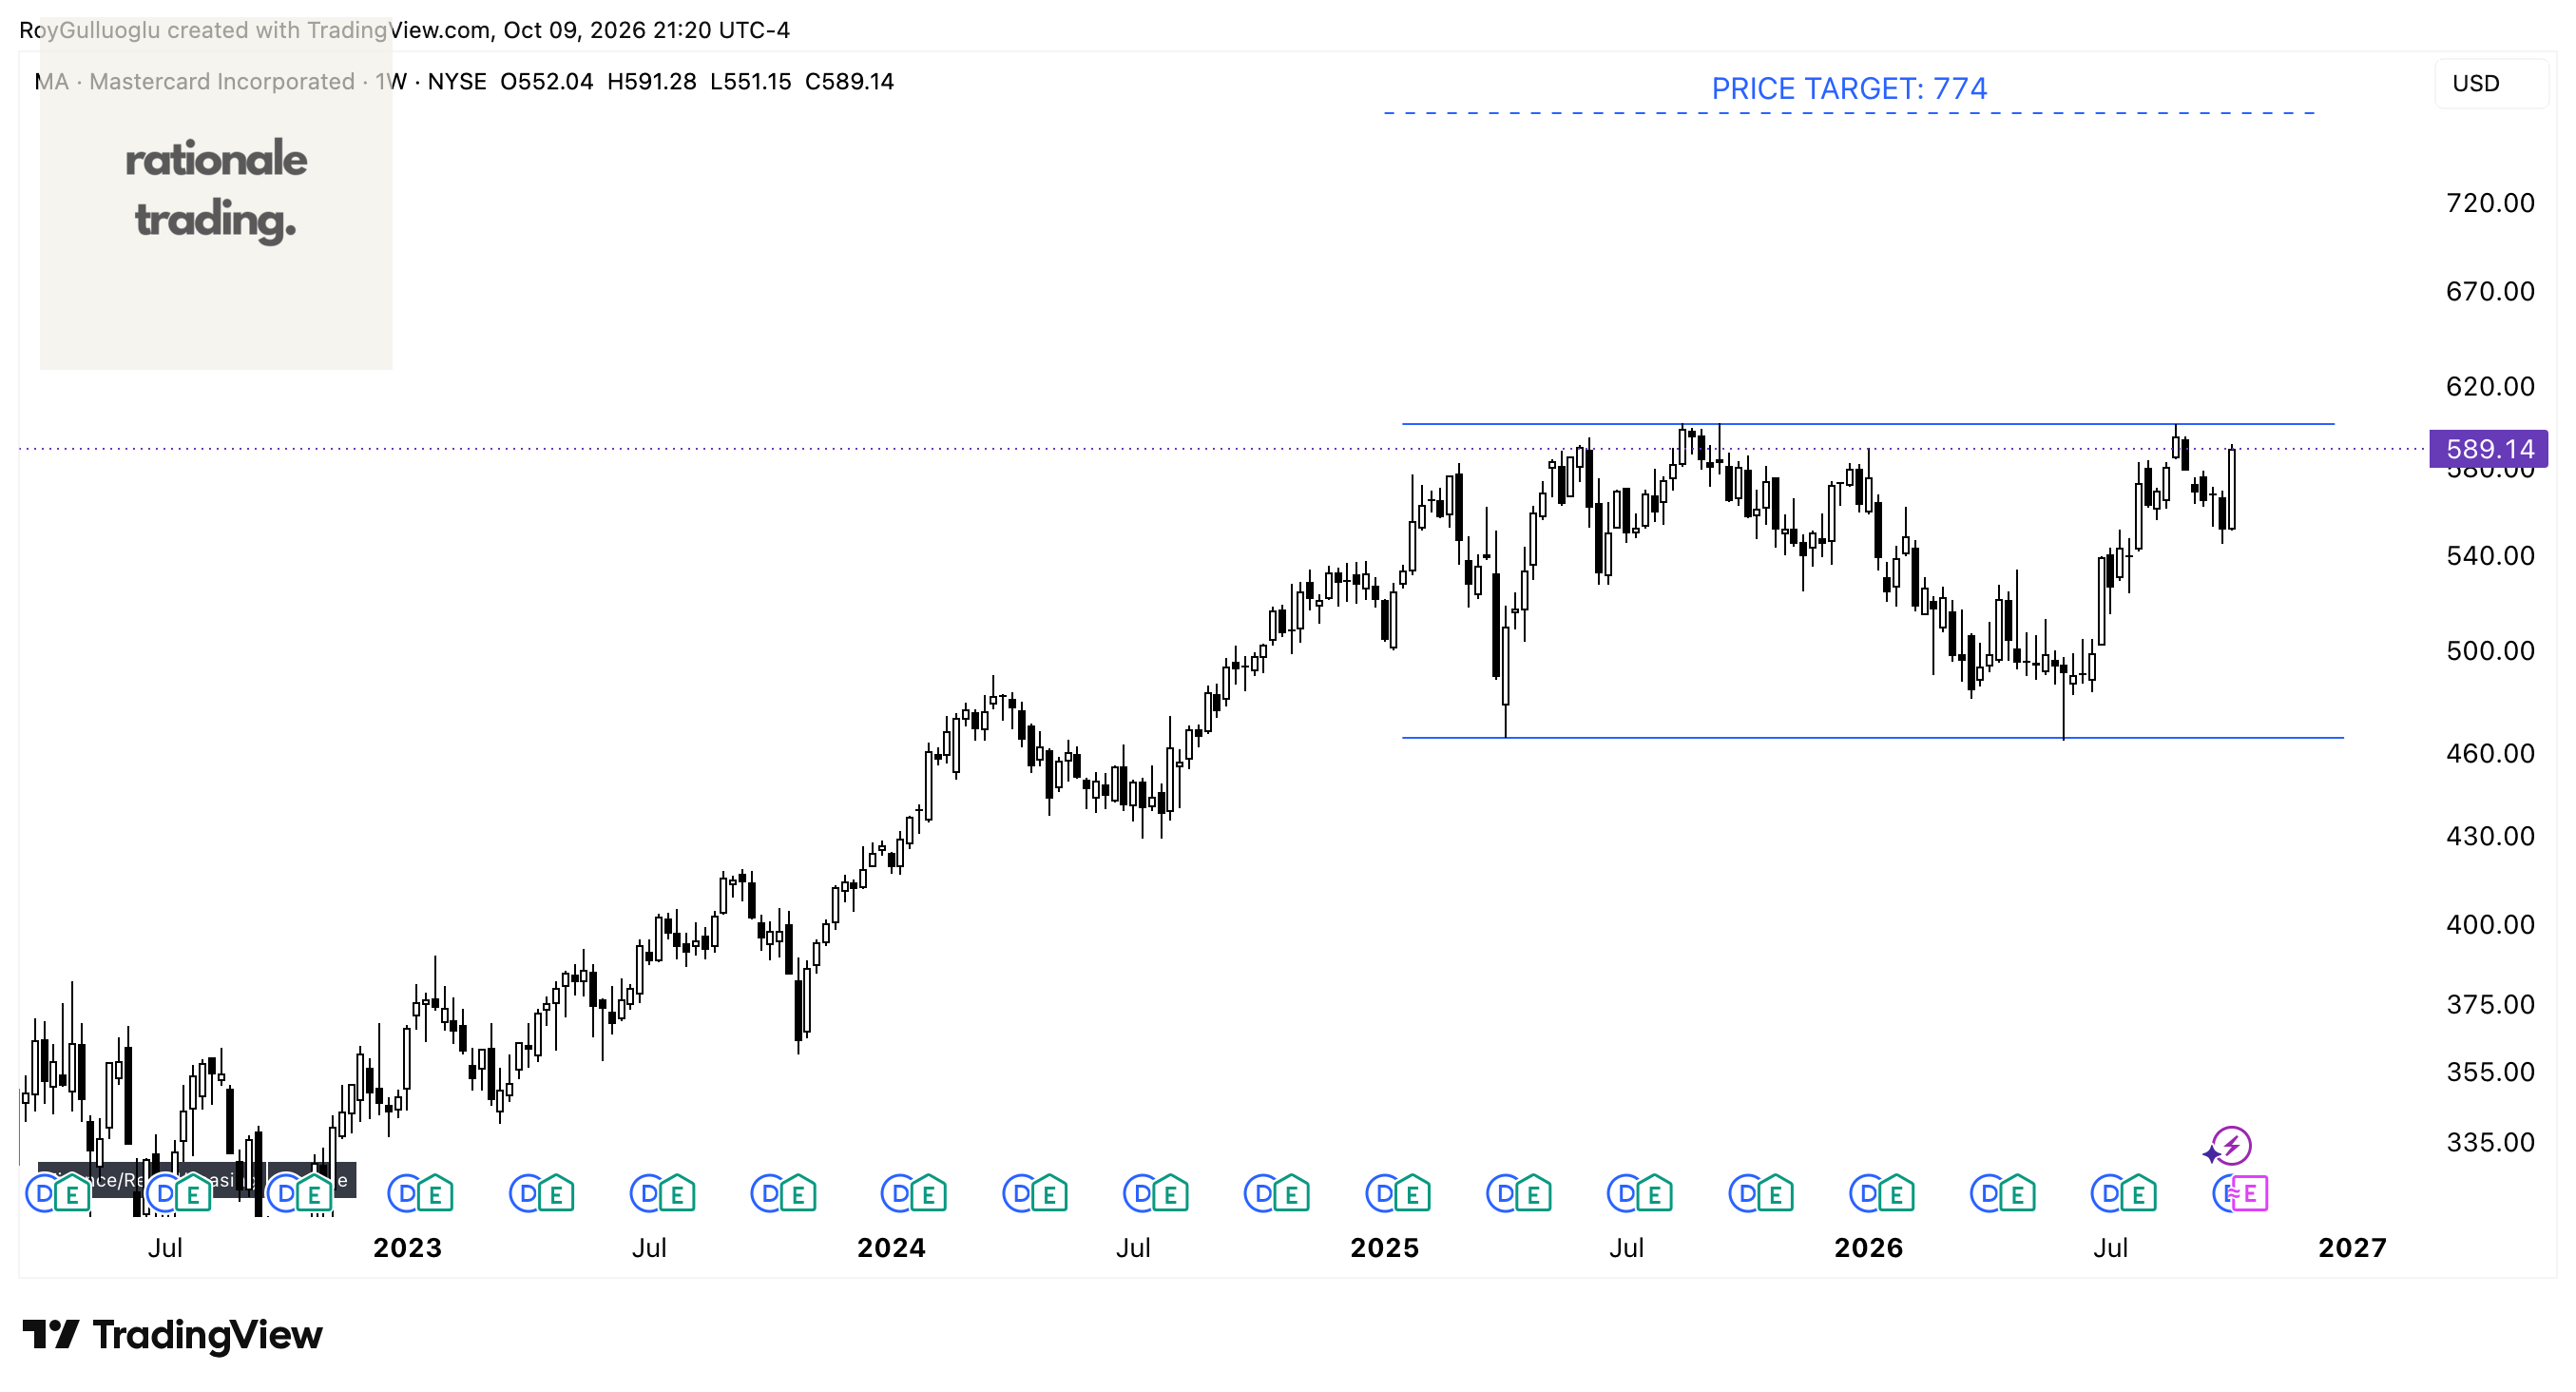
Mastercard Incorporated, a technology company, provides transaction processing and other payment-related products and services in the United States and internationally.
The above weekly chart formed an approximately 22-month-long rectangle chart pattern as a bullish continuation after a n uptrend.
Within this pattern, the horizontal boundary at 601.2 levels acts as a resistance.
A daily close above 619.2 levels would validate the breakout from the 22-month-long rectangle chart pattern.
Based on this chart pattern, the potential price target is 774 levels.
Nu Holdings Ltd.-(NU/NYSE)-Long Idea
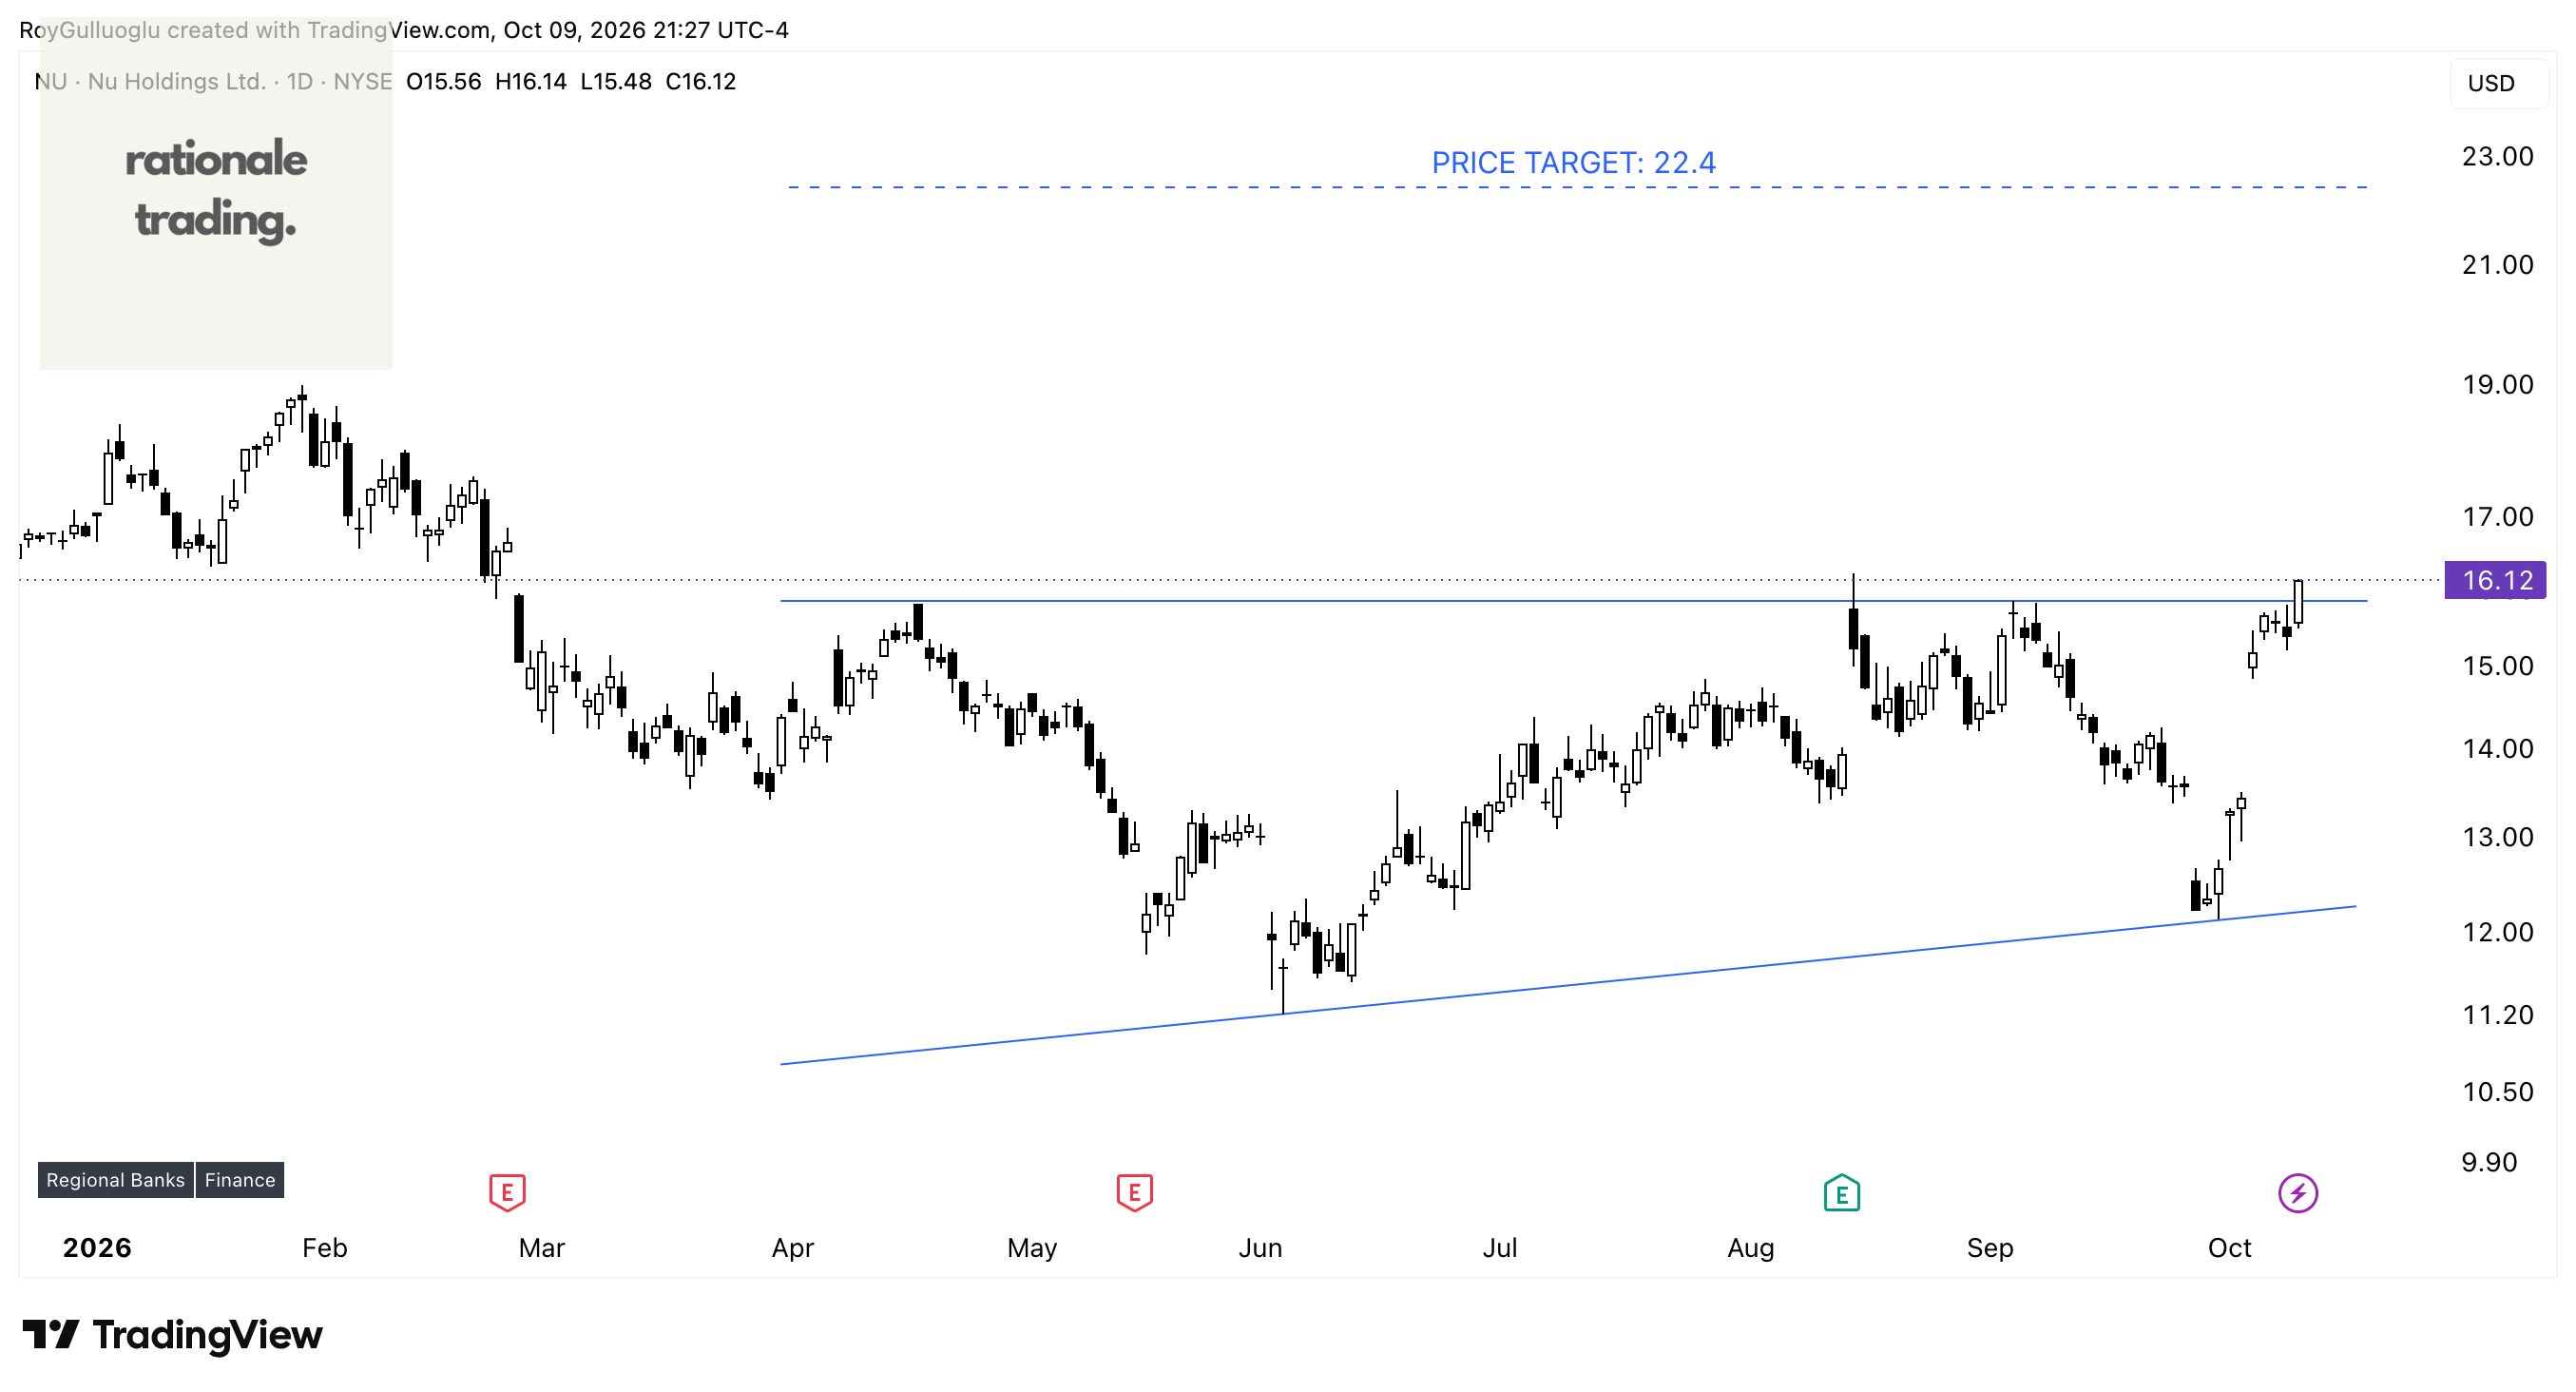
Nu Holdings Ltd. provides digital banking platform in Brazil, Mexico, Colombia, the Cayman Islands, and the United States.
The above daily chart formed an approximately 4-month-long ascending triangle chart pattern as a bullish reversal after a downtrend.
Within this pattern, the horizontal boundary at 15.8 levels acts as a resistance.
A daily close above 16.2 levels would validate the breakout from the 4-month-long ascending triangle chart pattern.
Based on this chart pattern, the potential price target is 22.4 levels.
Diamondback Energy, Inc.-(FANG/NASDAQ)-Long Idea
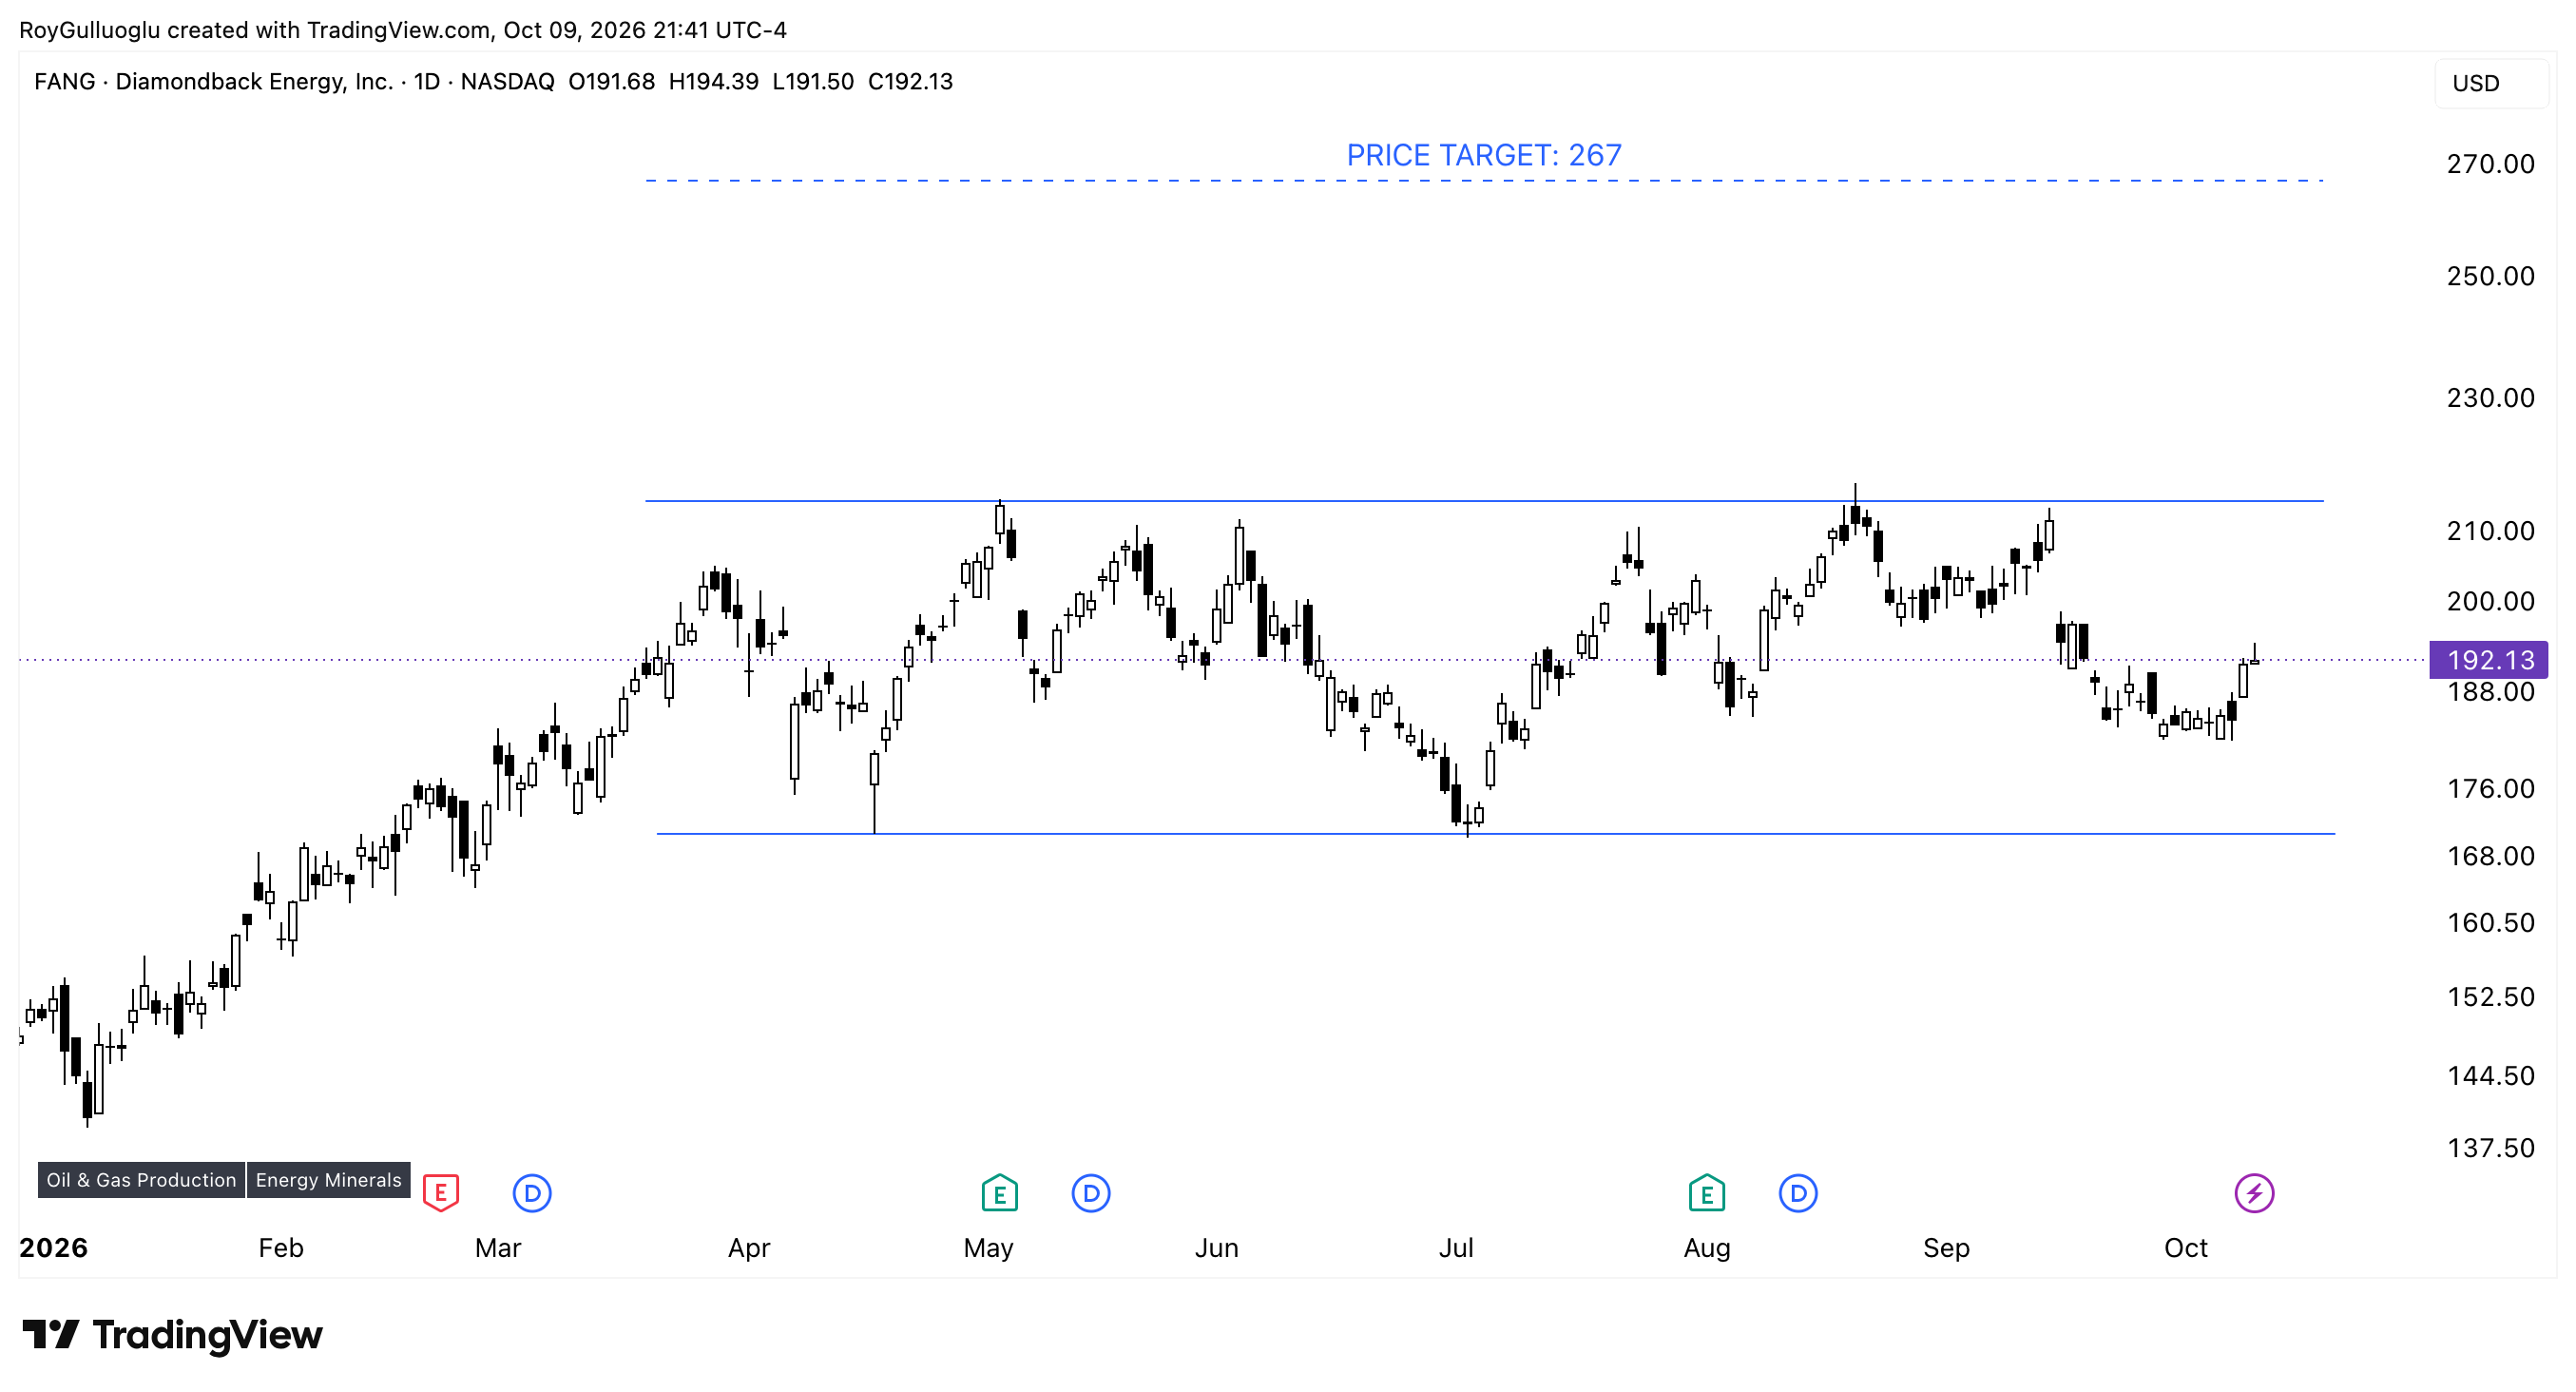
Diamondback Energy, Inc., an independent oil and natural gas company, acquires, develops, explores, and exploits unconventional, onshore oil and natural gas reserves in the Permian Basin in West Texas, the United States.
The above daily chart formed an approximately 4-month-long rectangle chart pattern as a bullish continuation after an uptrend.
Within this pattern, the horizontal boundary at 214.2 levels acts as a resistance.
A daily close above 220.6 levels would validate the breakout from the 4-month-long rectangle chart pattern.
Based on this chart pattern, the potential price target is 267 levels.
TD SYNNEX Corporation-(SNX/NYSE)-Long Idea
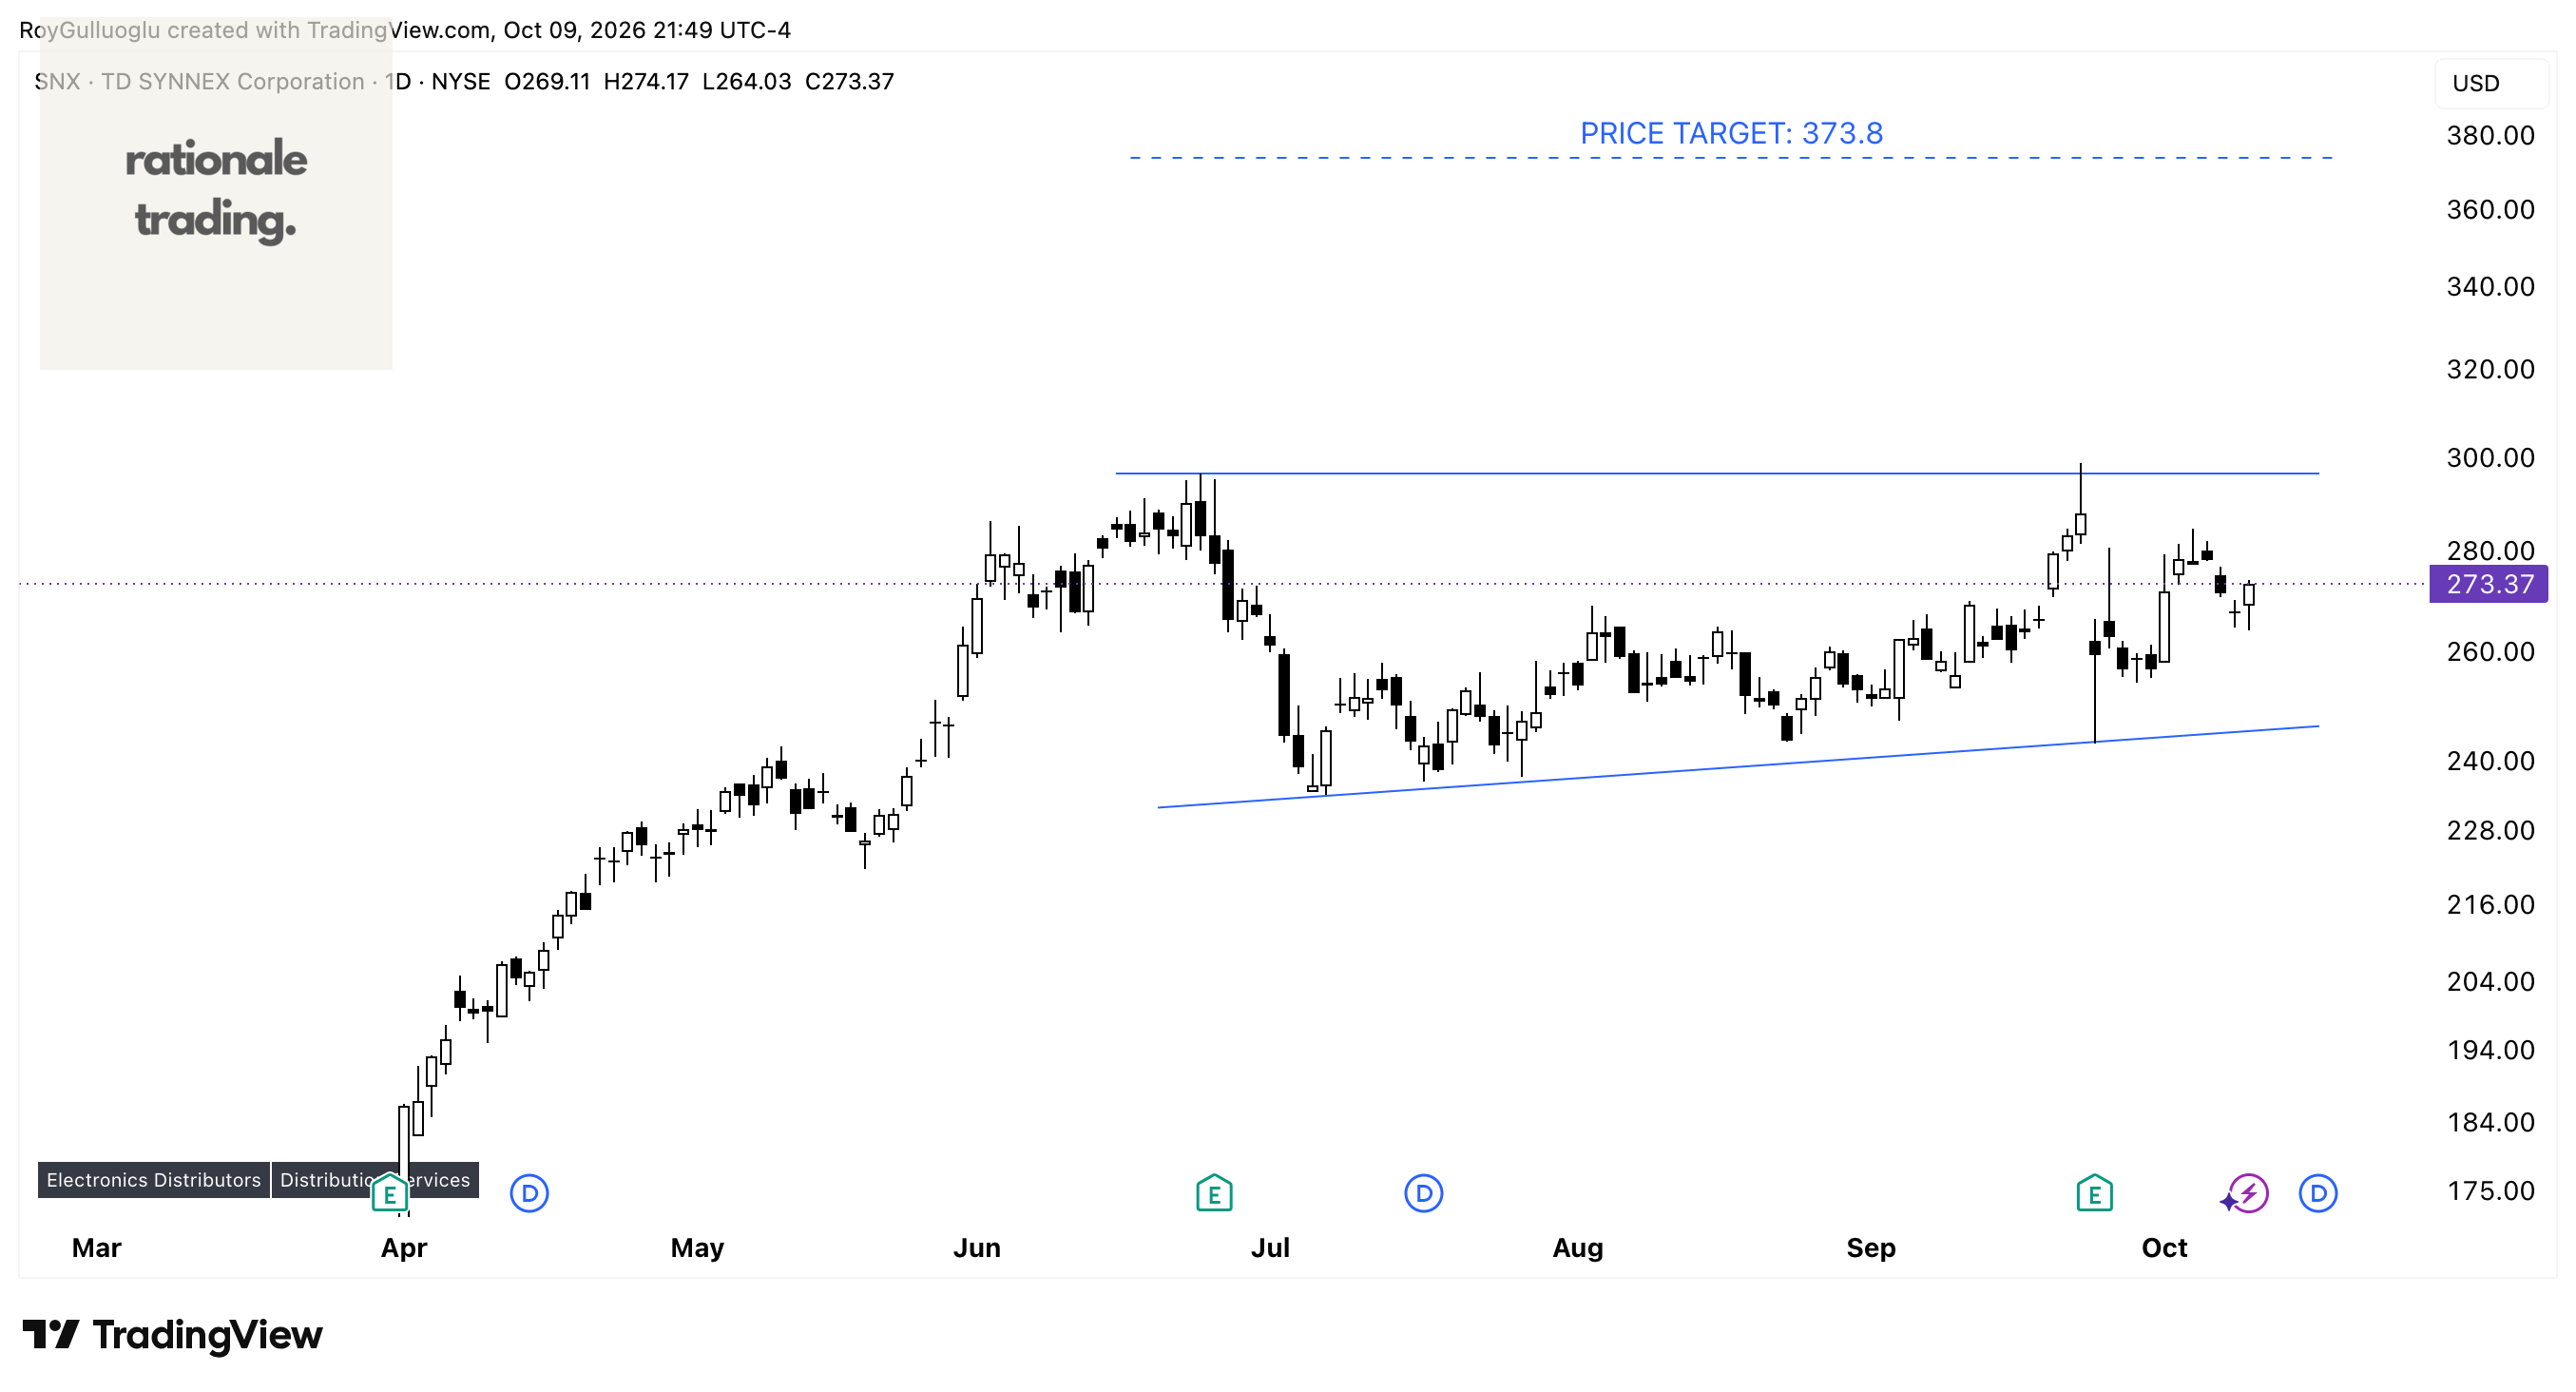
TD SYNNEX Corporation operates as a distributor and solutions aggregator for the information technology (IT) ecosystem in the United States, Europe, and internationally.
The above daily chart formed an approximately 3-month-long ascending triangle chart pattern as a bullish continuation after an uptrend.
Within this pattern, the horizontal boundary at 296.4 levels acts as a resistance.
A daily close above 305.2 levels would validate the breakout from the 3-month-long ascending triangle chart pattern.
Based on this chart pattern, the potential price target is 373.8 levels.