


New setups
TICKERS: LLY(NYSE), DFIN(NYSE), TTD(NASDAQ), BX(NYSE), KLAC(NASDAQ), 6370(TSE), 2201(TSE)
Eli Lilly and Company-(LLY/NYSE)-Long Idea
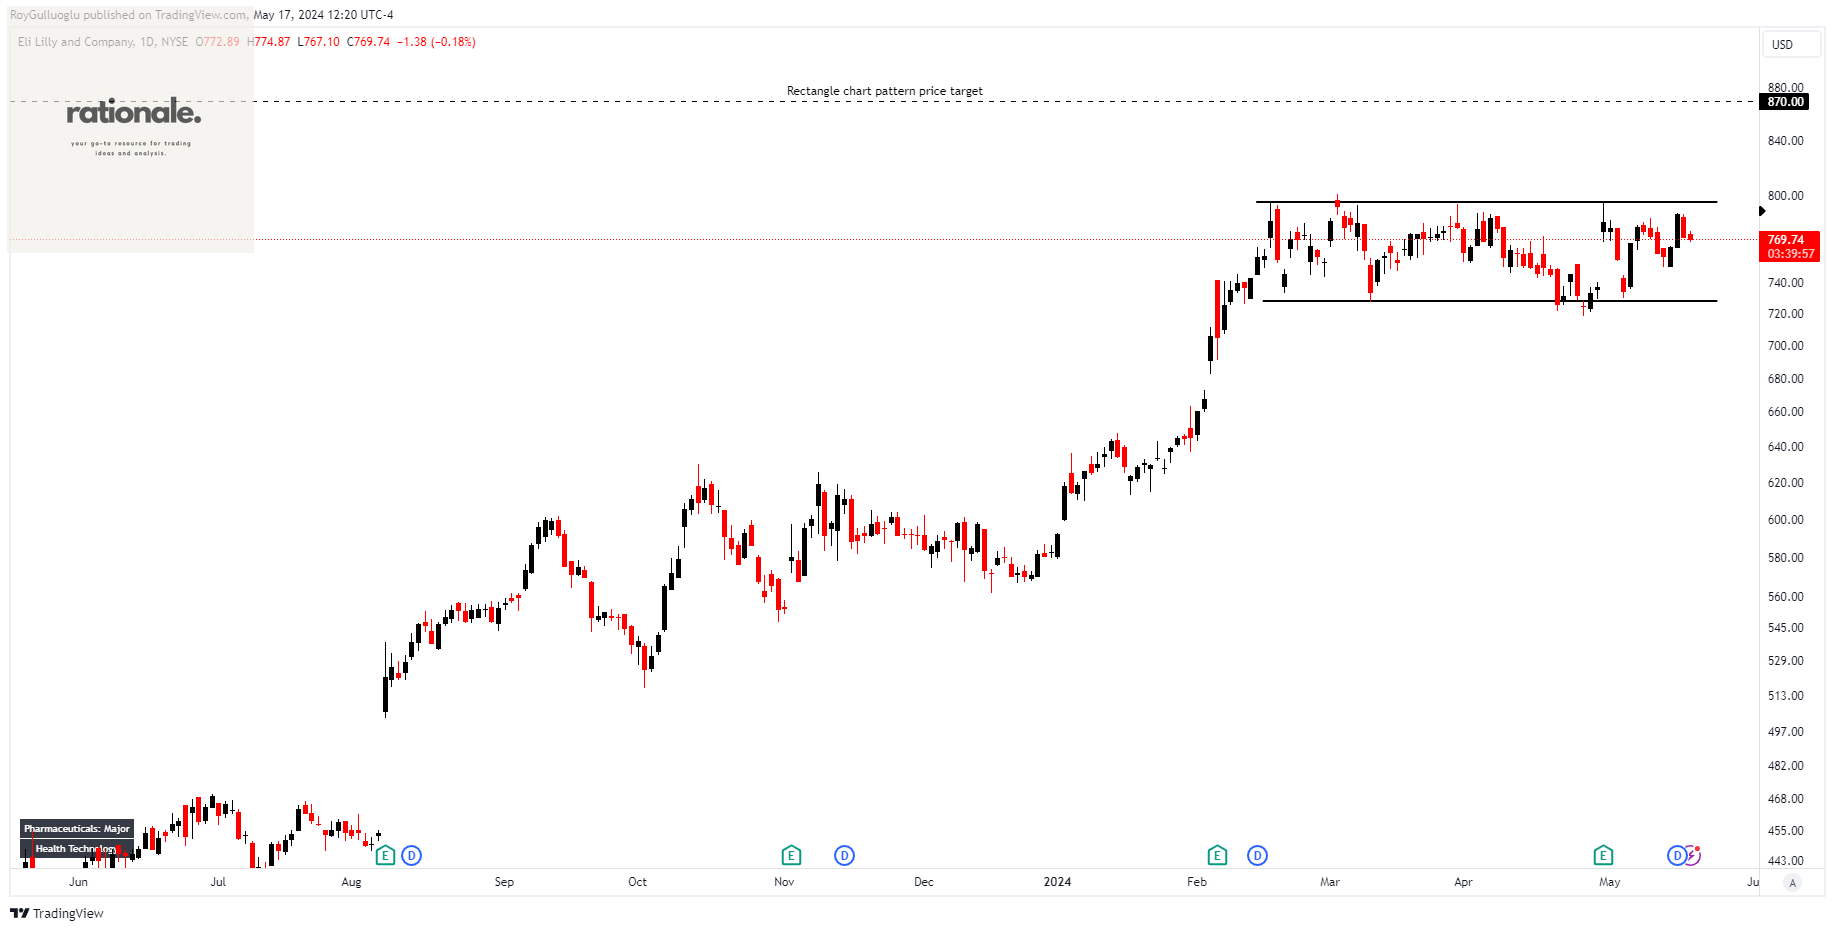
Eli Lilly and Company is engaged in the discovery, development, and global marketing of human pharmaceuticals.
The above daily chart formed an approximately 2-month-long rectangle chart pattern as a bullish continuation after an uptrend.
The horizontal boundary at 795.5 levels acts as a support within this pattern.
A daily close above 819 levels would validate the breakout from the 2-month-long rectangle chart pattern.
Based on this chart pattern, the potential price target is 870 levels.
LLY, classified under the "healthcare" sector, falls under the “Large Cap - Value” stock category.
Donnelley Financial Solutions, Inc.-(DFIN/NYSE)-Long Idea
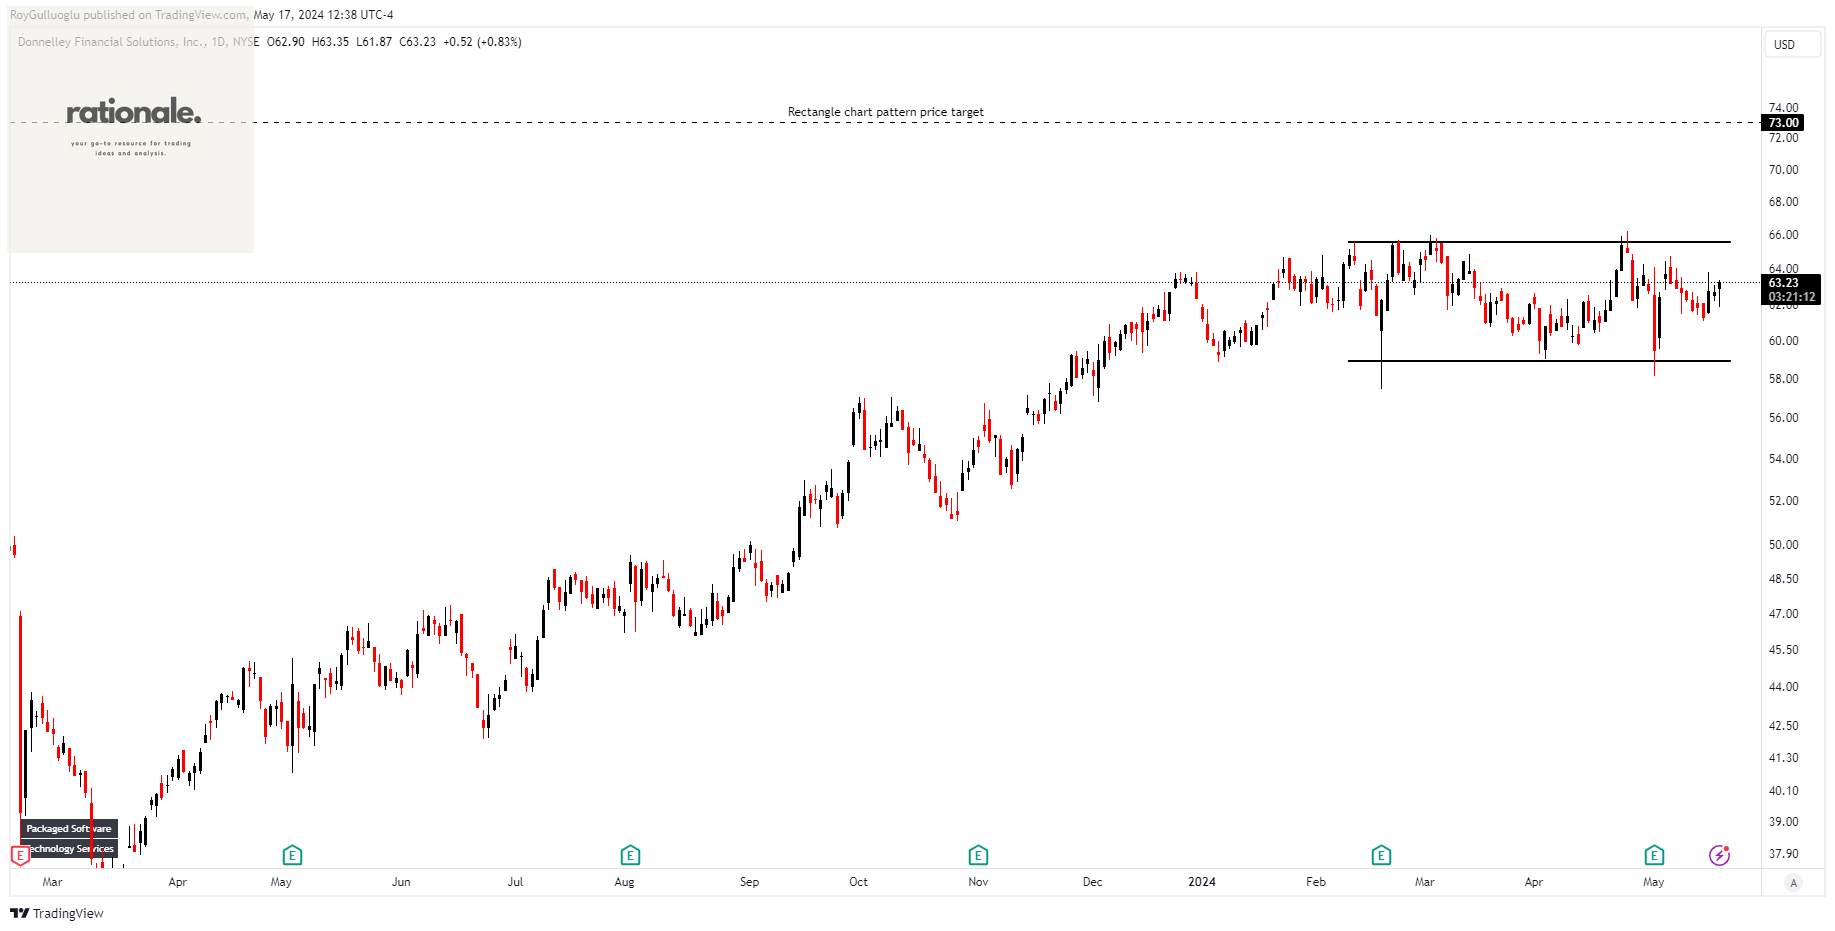
Donnelley Financial Solutions, Inc. offers innovative software and technology-driven financial regulatory and compliance solutions across the United States, Asia, Europe, Canada, and other international markets.
The above daily chart formed an approximately 2-month-long rectangle chart pattern as a bullish continuation after an uptrend.
The horizontal boundary at 65.5 levels acts as a support within this pattern.
A daily close above 67.45 levels would validate the breakout from the 2-month-long rectangle chart pattern.
Based on this chart pattern, the potential price target is 73 levels.
DFIN, classified under the "financial services" sector, falls under the “Small Cap - Income” stock category.
The Trade Desk, Inc.-(TTD/NASDAQ)-Long Idea
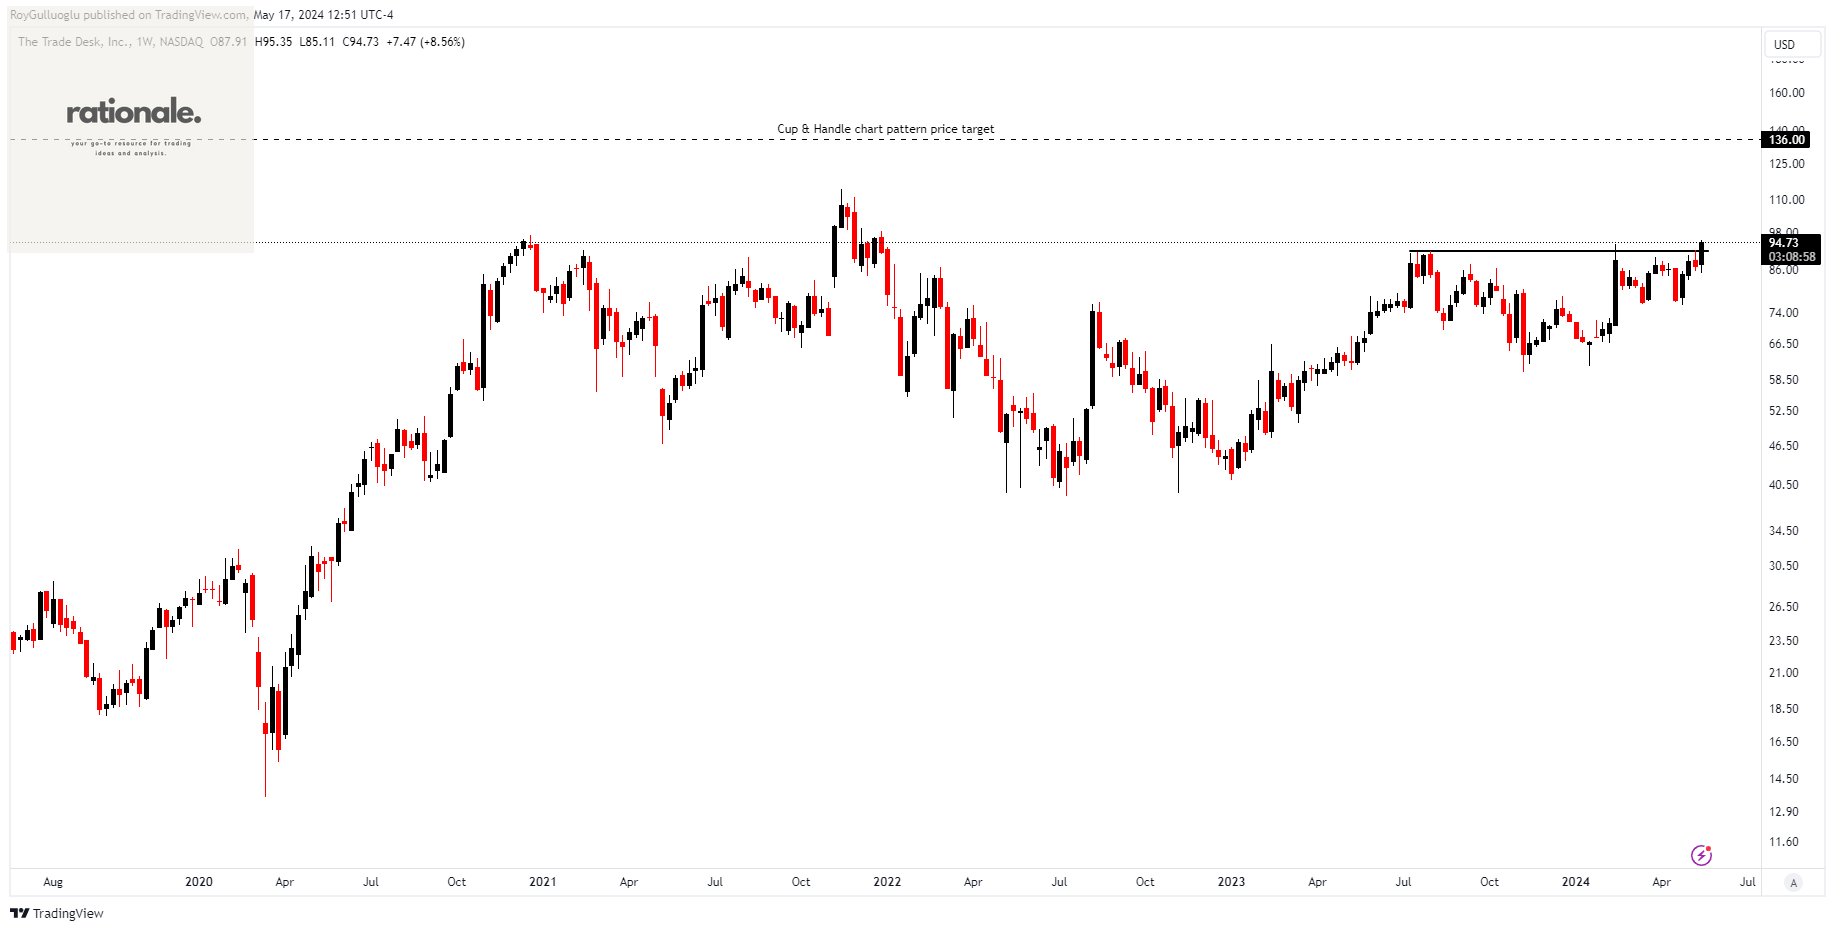
The Trade Desk, Inc. functions as a technology company both in the United States and globally.
The above weekly chart formed an approximately 10-month-long Cup & Handle chart pattern as a bullish continuation after an uptrend.
The horizontal boundary at 91.85 levels acts as a support within this pattern.
A daily close above 94.6 levels would validate the breakout from the 10-month-long Cup & Handle chart pattern.
Based on this chart pattern, the potential price target is 136 levels.
TTD, classified under the "technology" sector, falls under the “Large Cap - Growth” stock category.
Blackstone Inc.-(BX/NYSE)-Long Idea
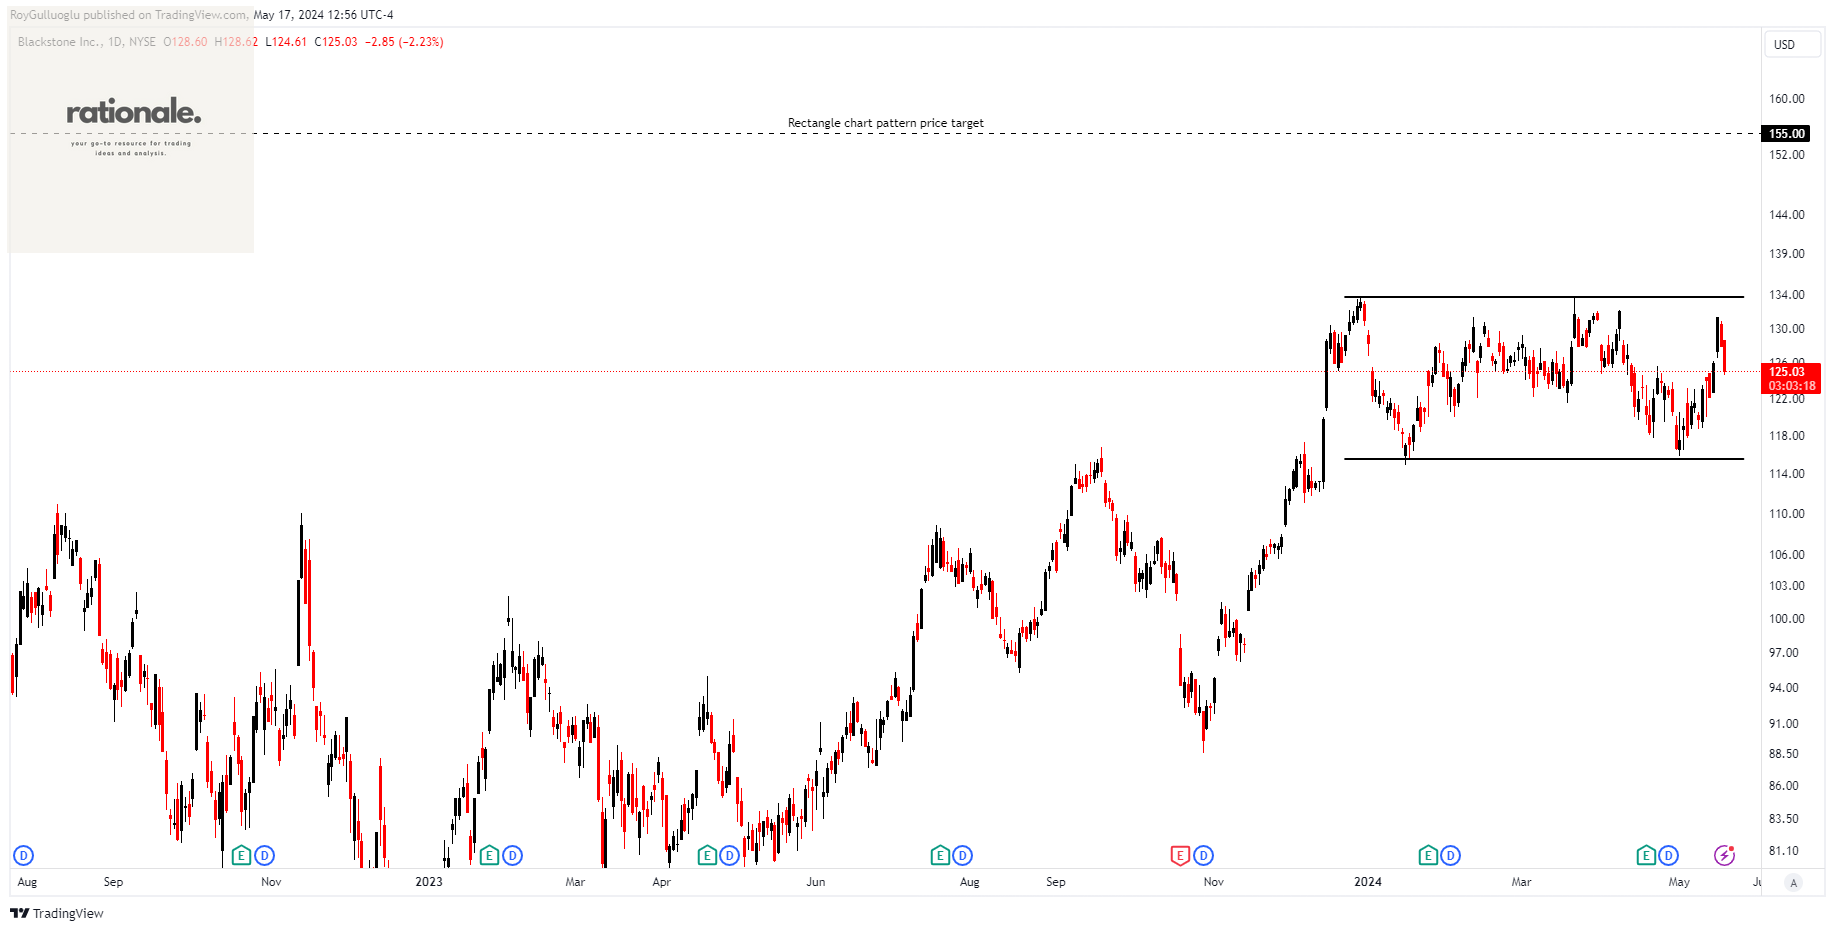
Blackstone Inc. is an alternative asset management firm that specializes in real estate, private equity, hedge fund solutions, credit, secondary funds of funds, public debt and equity, and multi-asset class strategies.
The above daily chart formed an approximately 3-month-long rectangle chart pattern as a bullish continuation after an uptrend.
The horizontal boundary at 133.6 levels acts as a support within this pattern.
A daily close above 137.6 levels would validate the breakout from the 3-month-long rectangle chart pattern.
Based on this chart pattern, the potential price target is 155 levels.
BX, classified under the "financial services" sector, falls under the “Large Cap - Income” stock category.
KLA Corporation-(KLAC/NASDAQ)-Long Idea
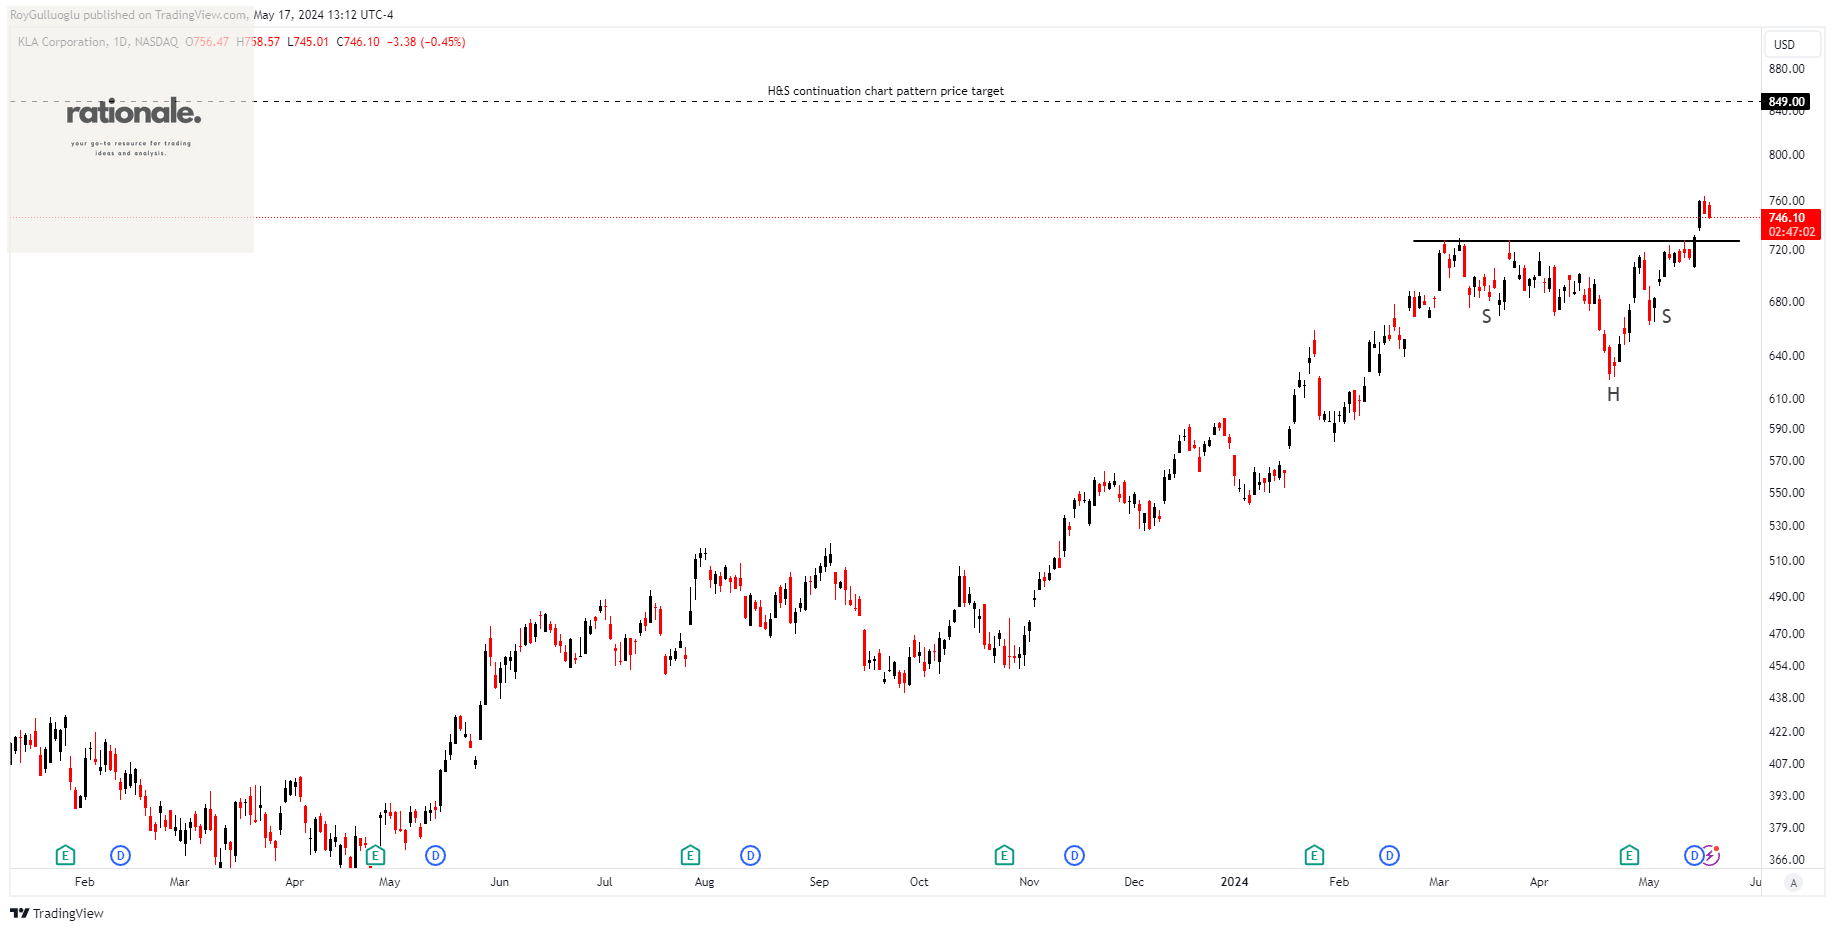
KLA Corporation designs, manufactures, and markets process control, process-enabling, and yield management solutions for the semiconductor and related electronics industries globally. It operates through three segments: Semiconductor Process Control; Specialty Semiconductor Process; and PCB, Display, and Component Inspection.
The above daily chart formed an approximately 2-month-long H&S continuation chart pattern as a bullish continuation after an uptrend.
The horizontal boundary at 727 levels acted as a support within this pattern.
A daily close above 748 levels validated the breakout from the 2-month-long H&S continuation chart pattern.
Based on this chart pattern, the potential price target is 849 levels.
KLAC, classified under the "technology" sector, falls under the “Large Cap - Growth” stock category.
Kurita Water Industries Ltd.-(6370/TSE)-Long Idea
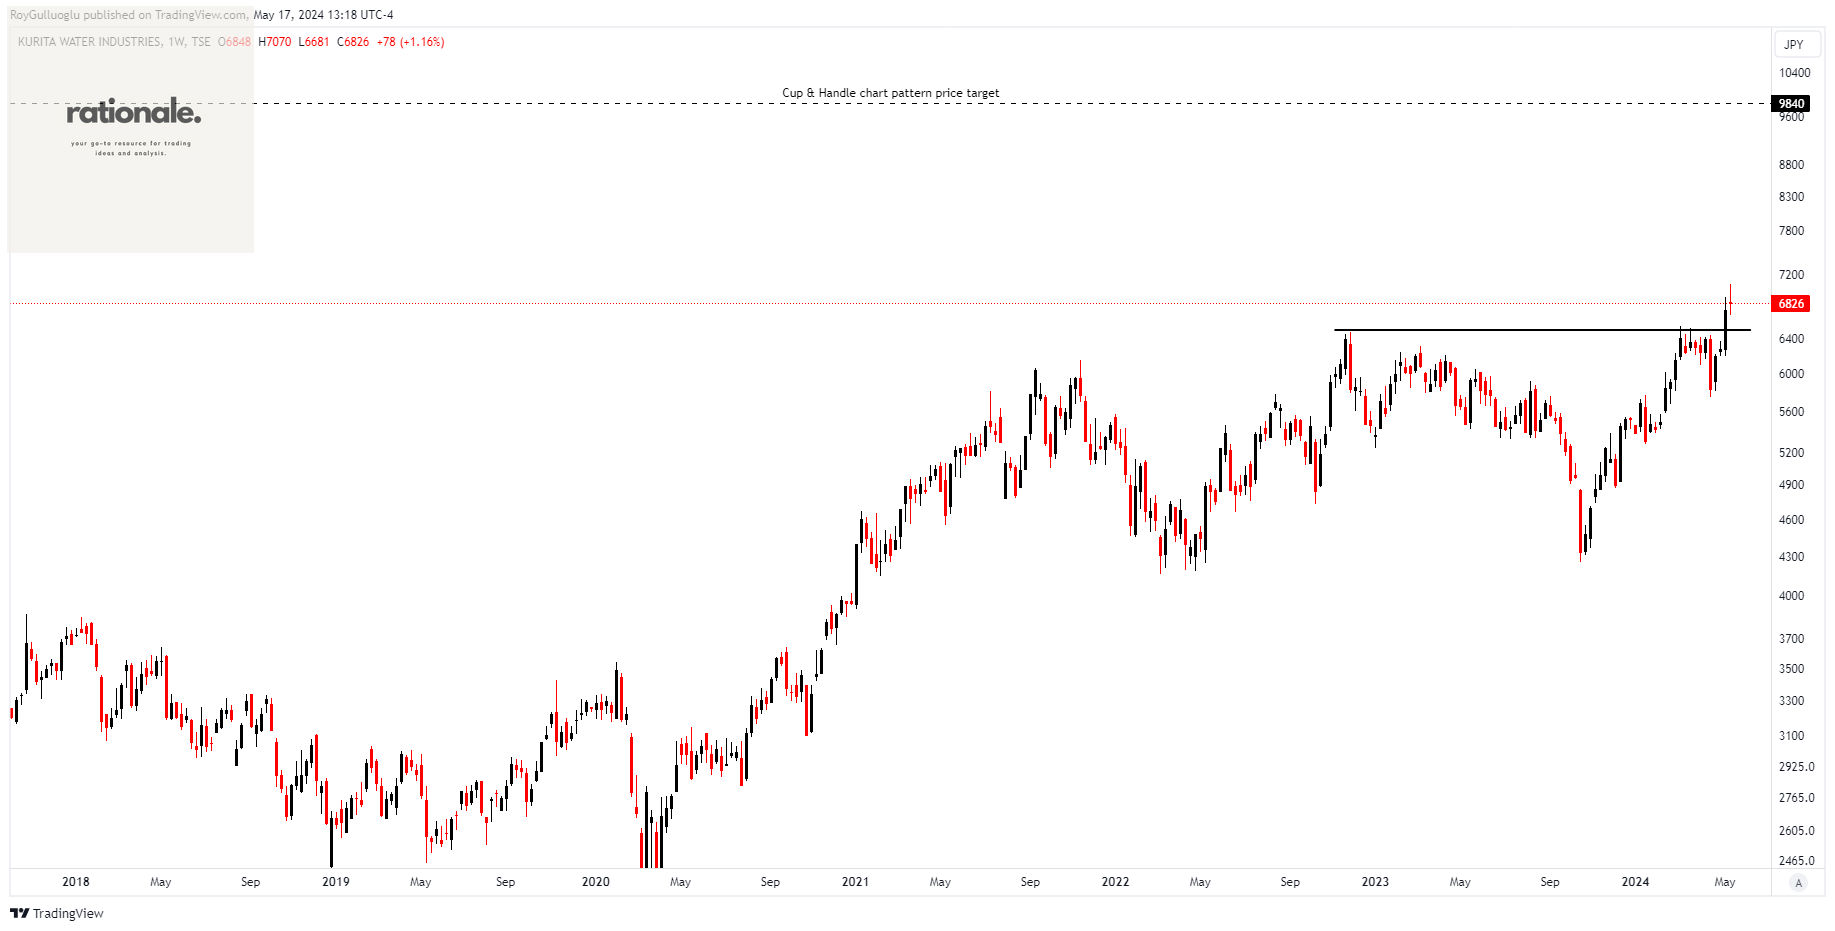
Kurita Water Industries Ltd. provides a range of water treatment solutions across North America, South America, Europe, and other international markets.
The above weekly chart formed an approximately 20-month-long cup & handle chart pattern as a bullish continuation after an uptrend.
The horizontal boundary at 6500 levels acted as a support within this pattern.
A daily close above 6695 levels validated the breakout from the 20-month-long cup & handle chart pattern.
Based on this chart pattern, the potential price target is 9840 levels.
6370, classified under the "industrials" sector, falls under the “Mid Cap - Value” stock category.
Morinaga&Co., Ltd.-(2201/TSE)-Short Idea
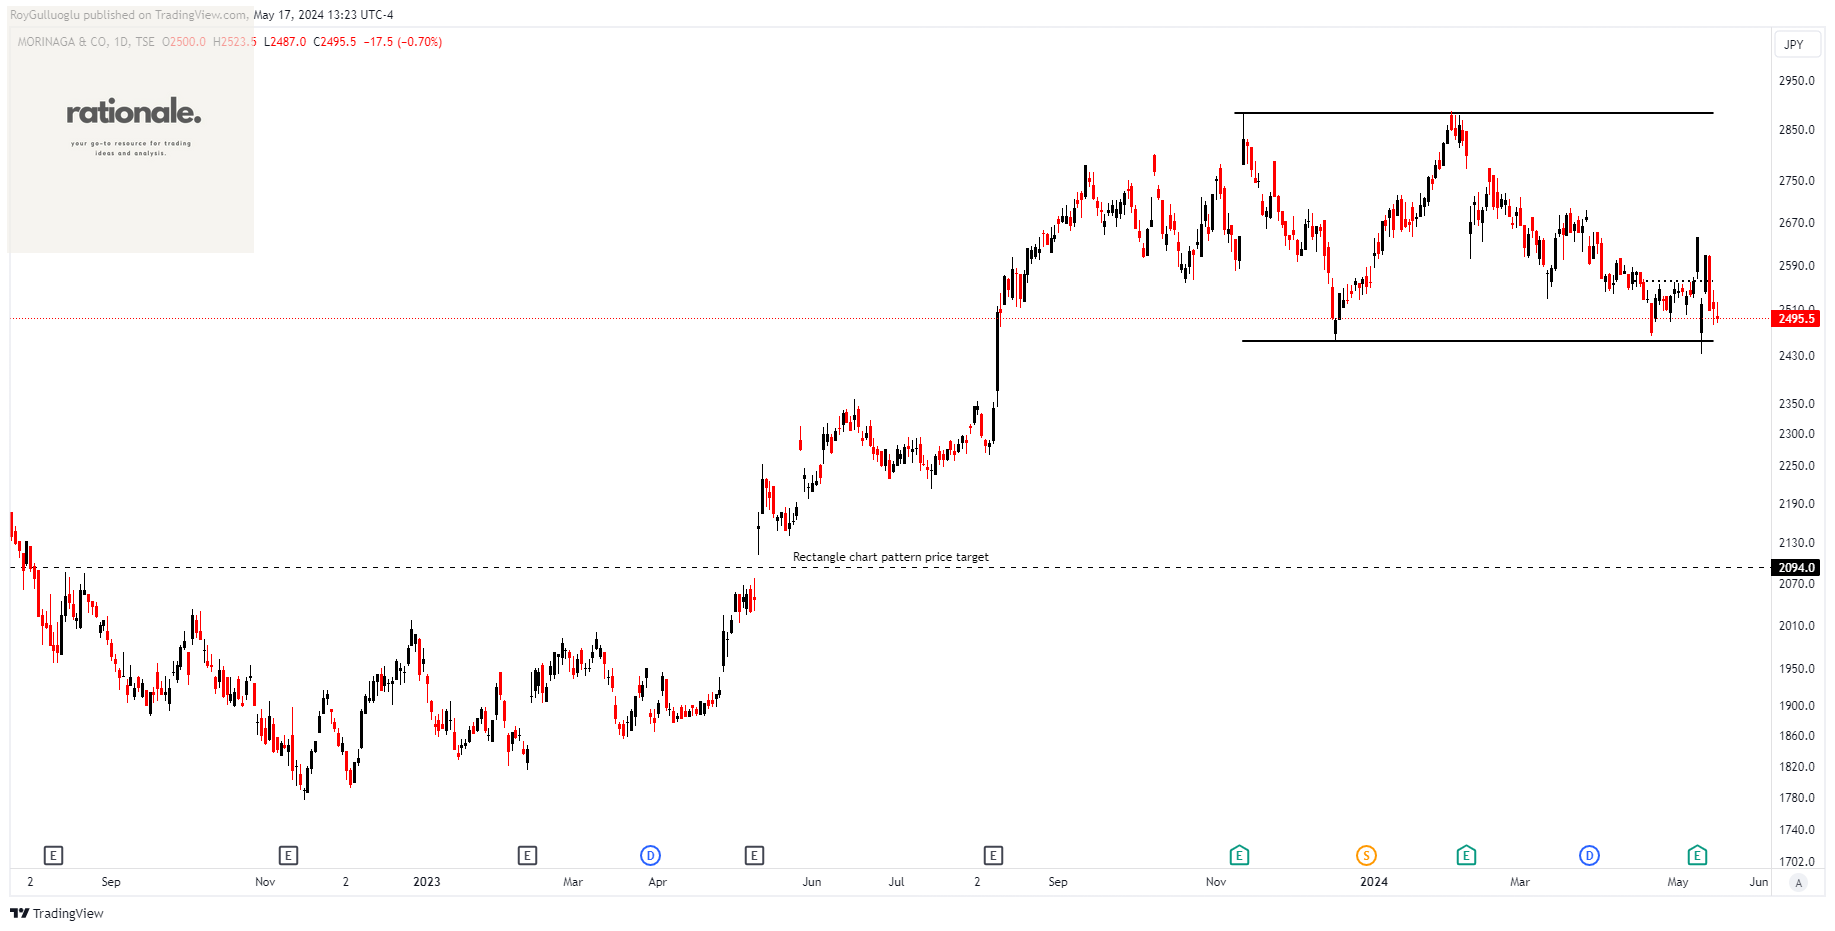
Morinaga & Co., Ltd. manufactures, purchases, and sells confectioneries, food products, frozen desserts, and health products both in Japan and internationally.
The above daily chart formed an approximately 4-month-long rectangle chart pattern as a bullish reversal after an uptrend.
The horizontal boundary at 2455 levels acts as a support within this pattern.
A daily close below 2381.35 levels would validate the breakdown from the 4-month-long rectangle chart pattern.
Based on this chart pattern, the potential price target is 2094 levels.
2201, classified under the "consumer defensive" sector, falls under the “Small Cap - Value” stock category.
THANKS ROY.. Rica etsem Çin ve Hindistan gibi uzak doğu borsalarında uyguladığın bir tarama filitresi varsa paylaşır mısın? Amerikan hisse senetlerinde 300 M üzeri kapital kuralın olduğunu biliyorum.. Burada var mı ekstra bir filitren?