


New setups
Par Pacific Holdings, Inc.-(PARR/NYSE)-Long Idea
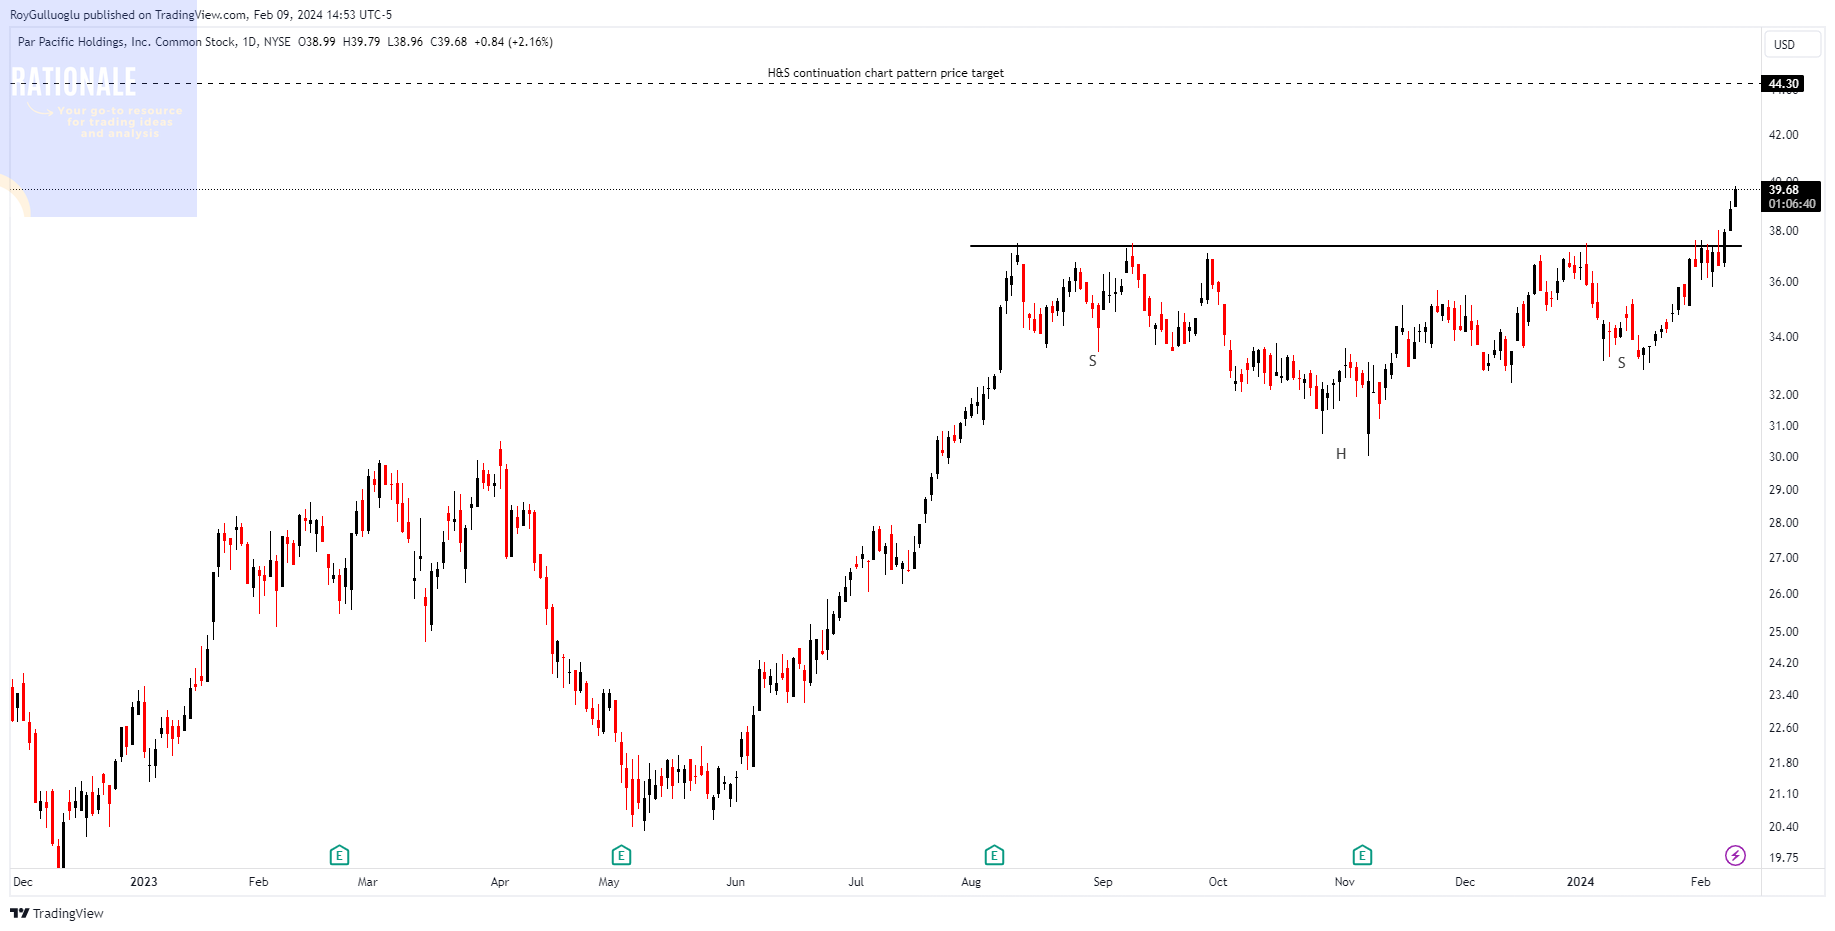
Par Pacific Holdings, Inc. manages energy and infrastructure businesses in three segments: Refining, Retail, and Logistics. The Refining segment oversees three refineries producing refined products for consumption in Hawaii, the Pacific Northwest, Wyoming, and South Dakota.
The above daily chart formed an approximately 4-month-long H&S continuation chart pattern as a bullish continuation after an uptrend.
The horizontal boundary at 37.4 levels acted as a resistance within this pattern.
A daily close above 38.52 levels validated the breakout from the 4-month-long H&S continuation chart pattern.
Based on this chart pattern, the potential price target is 44.3 levels.
PARR, classified under the "energy" sector, falls under the “Mid Cap - Income” stock category.
Verisk Analytics, Inc.-(VRSK/NASDAQ)-Long Idea
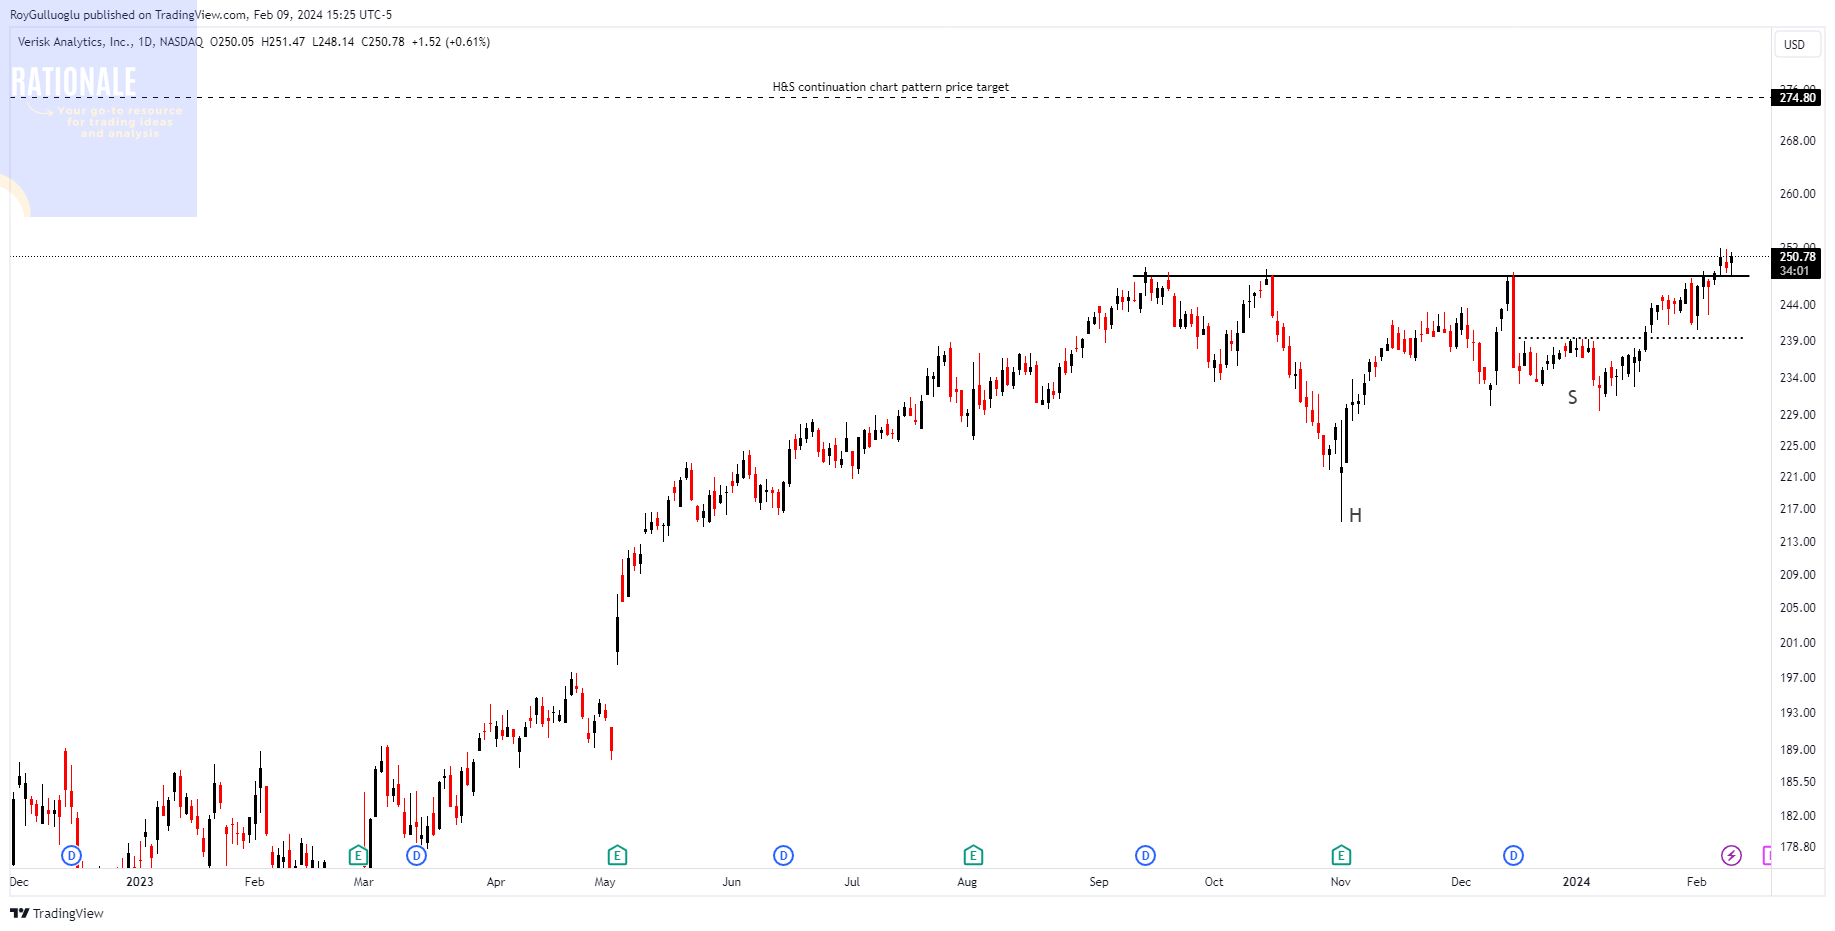
Verisk Analytics, Inc. offers data analytics solutions for the insurance industry globally. The company specializes in predictive analytics and decision support across areas such as rating, underwriting, claims, catastrophe and weather risk, global risk analytics, and more.
The above daily chart formed an approximately 3-month-long H&S continuation chart pattern as a bullish continuation after an uptrend.
The horizontal boundary at 248 levels acts as a resistance within this pattern.
A daily close above 255.44 levels would validate the breakout from the 3-month-long H&S continuation chart pattern.
Based on this chart pattern, the potential price target is 274.8 levels.
VRSK, classified under the "industrials" sector, falls under the “Large Cap - Value” stock category.
Bloomin Brands, Inc.-(BLMN/NASDAQ)-Long Idea
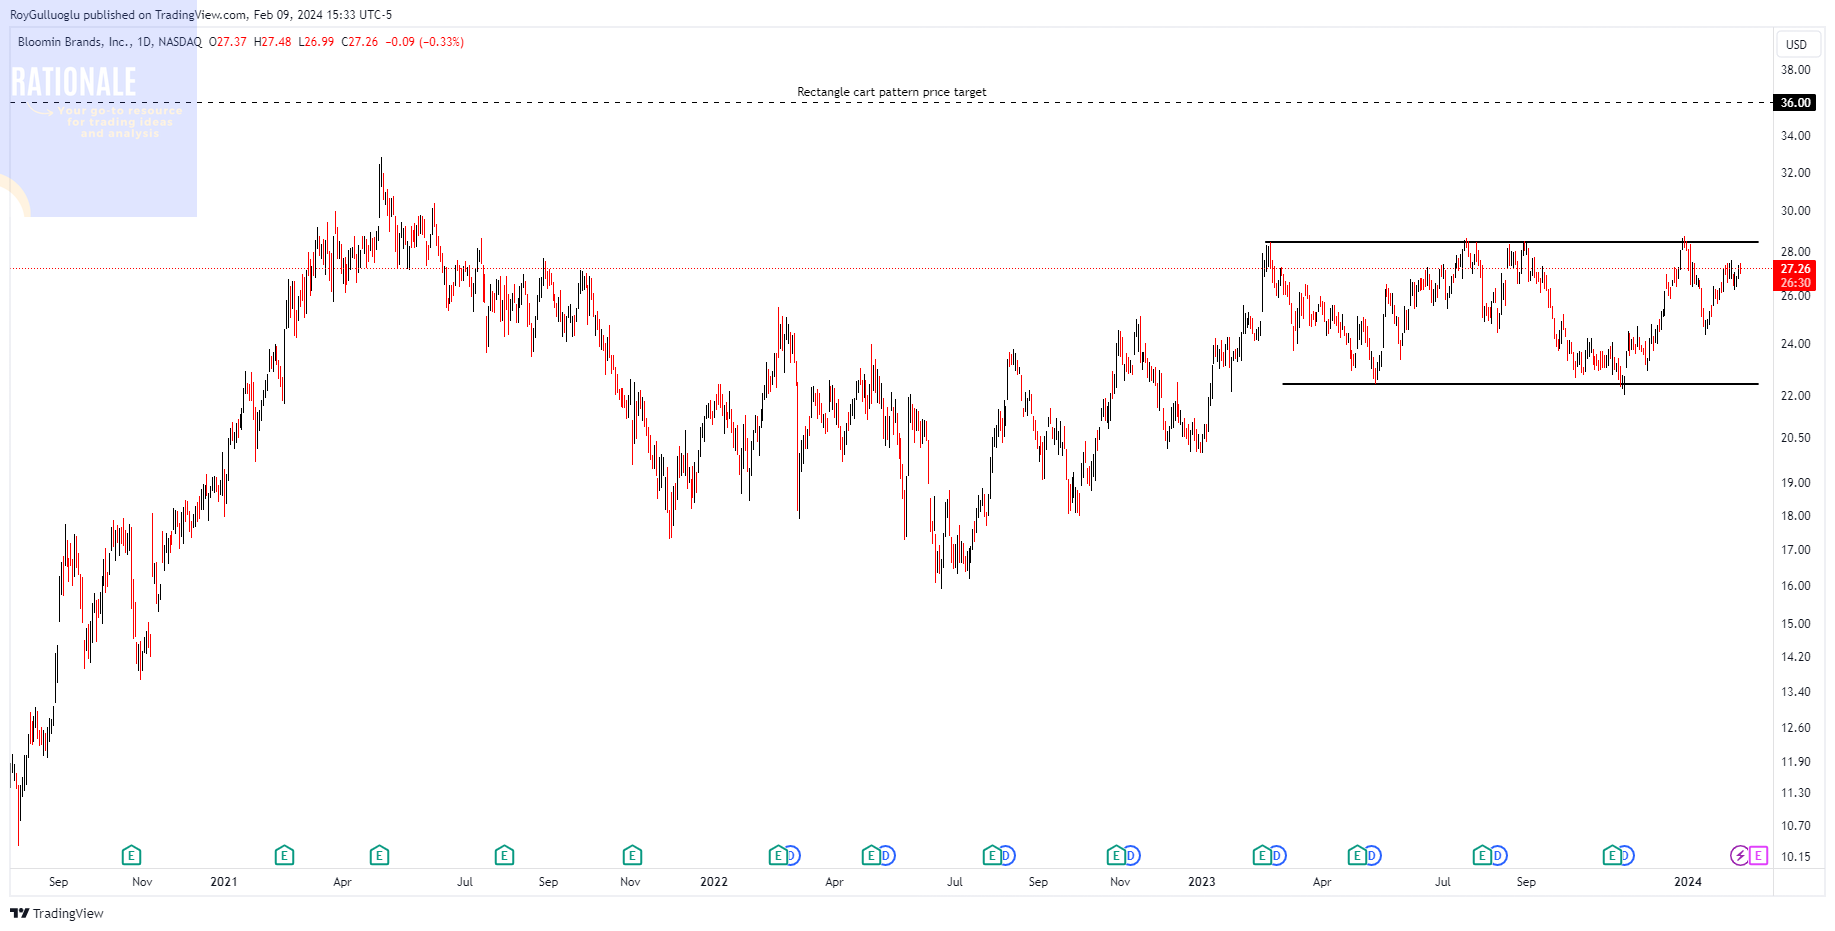
Bloomin' Brands, Inc. and its subsidiaries are proprietors and operators of restaurants, spanning casual, upscale casual, and fine dining establishments across the United States and internationally.
The above daily chart formed an approximately 8-month-long rectangle chart pattern as a bullish continuation after an uptrend.
Within this pattern, the horizontal boundary at 28.46 levels acts as a resistance.
A daily close above 29.31 levels would validate the breakout from the 8-month-long rectangle chart pattern.
Based on this chart pattern, the potential price target is 36 levels.
BLMN, classified under the "consumer cyclicals" sector, falls under the “Mid Cap - Growth” stock category.
Global Life Inc.-(GL/NYSE) - Long Idea
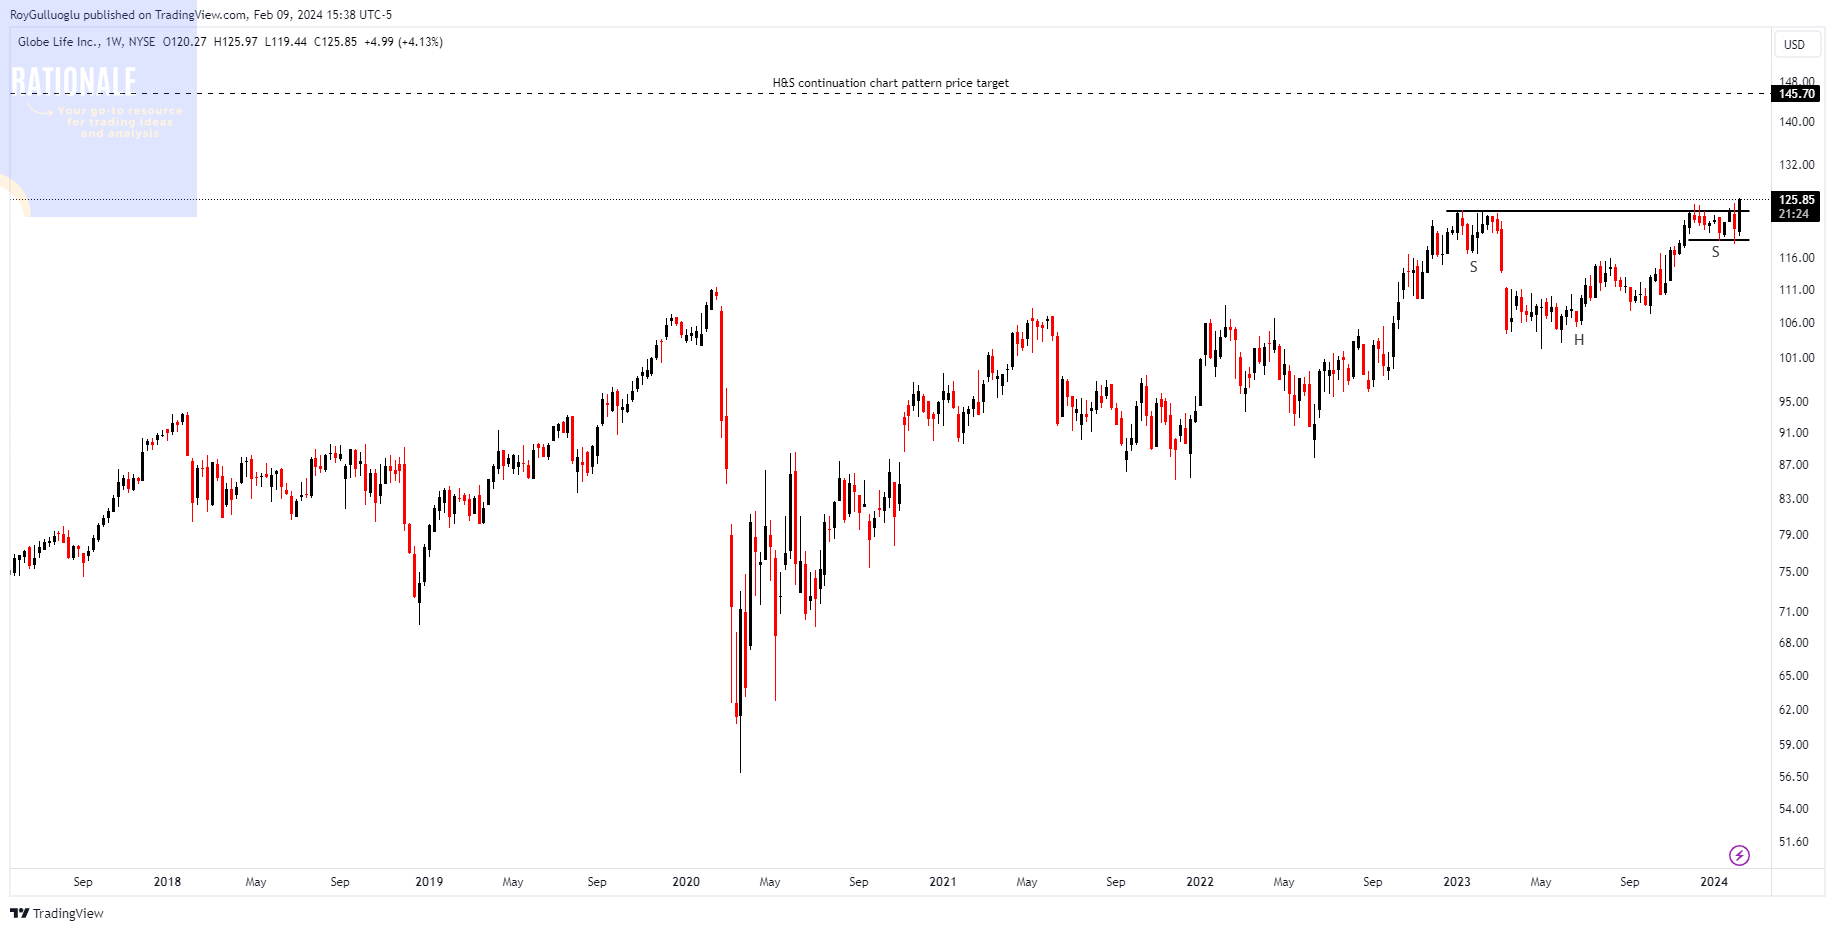
Globe Life Inc. and its subsidiaries offer a range of life and supplemental health insurance products, as well as annuities, catering to households in the lower middle to middle-income brackets in the United States.
The above weekly chart formed an approximately 14-month-long H&S continuation chart pattern as a bullish continuation after an uptrend.
The boundary at 123.7 levels acts as a resistance within this pattern.
A daily close above 127.4 levels would validate the breakout from the 14-month-long H&S continuation chart pattern.
Based on this chart pattern, the potential price target is 145.7 levels.
Multiple quarters of increasing EPS and revenue is another strength of the stock.
GL, classified under the "financial services" sector, falls under the “Large Cap - Income” stock category.
Procter & Gamble Company (The)-(PG/NYSE)-Long Idea
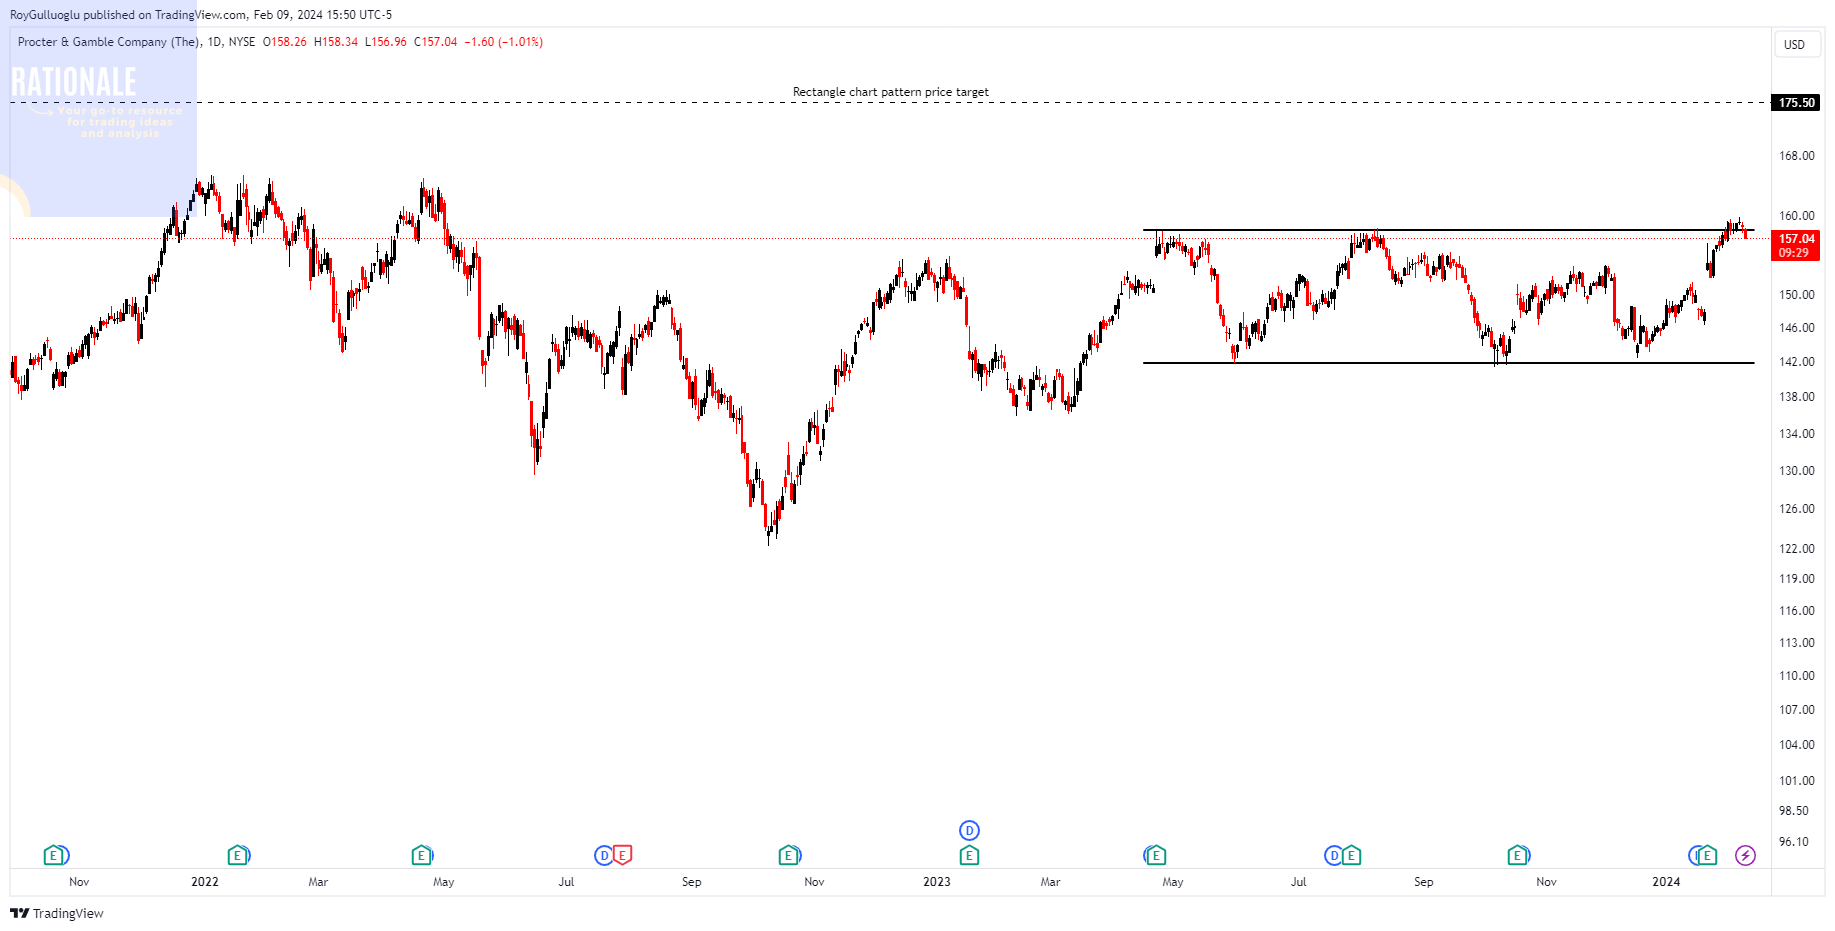
The Procter & Gamble Company offers consumer packaged goods with recognized brands globally. Its operations are organized into five segments: Beauty, Grooming, Health Care, Fabric & Home Care, and Baby, Feminine & Family Care.
The above daily chart formed an approximately 6-month-long rectangle chart pattern as a bullish continuation after an uptrend.
The boundary at 158.1 levels acts as a resistance within this pattern.
A daily close above 162.84 levels would validate the breakout from the 6-month-long rectangle chart pattern.
Based on this chart pattern, the potential price target is 175.5 levels.
PG, classified under the "consumer defensive" sector, falls under the “Large Cap - Value” stock category.
MoonLake Immunotherapeutics-(MLTX/NASDAQ)-Long Idea
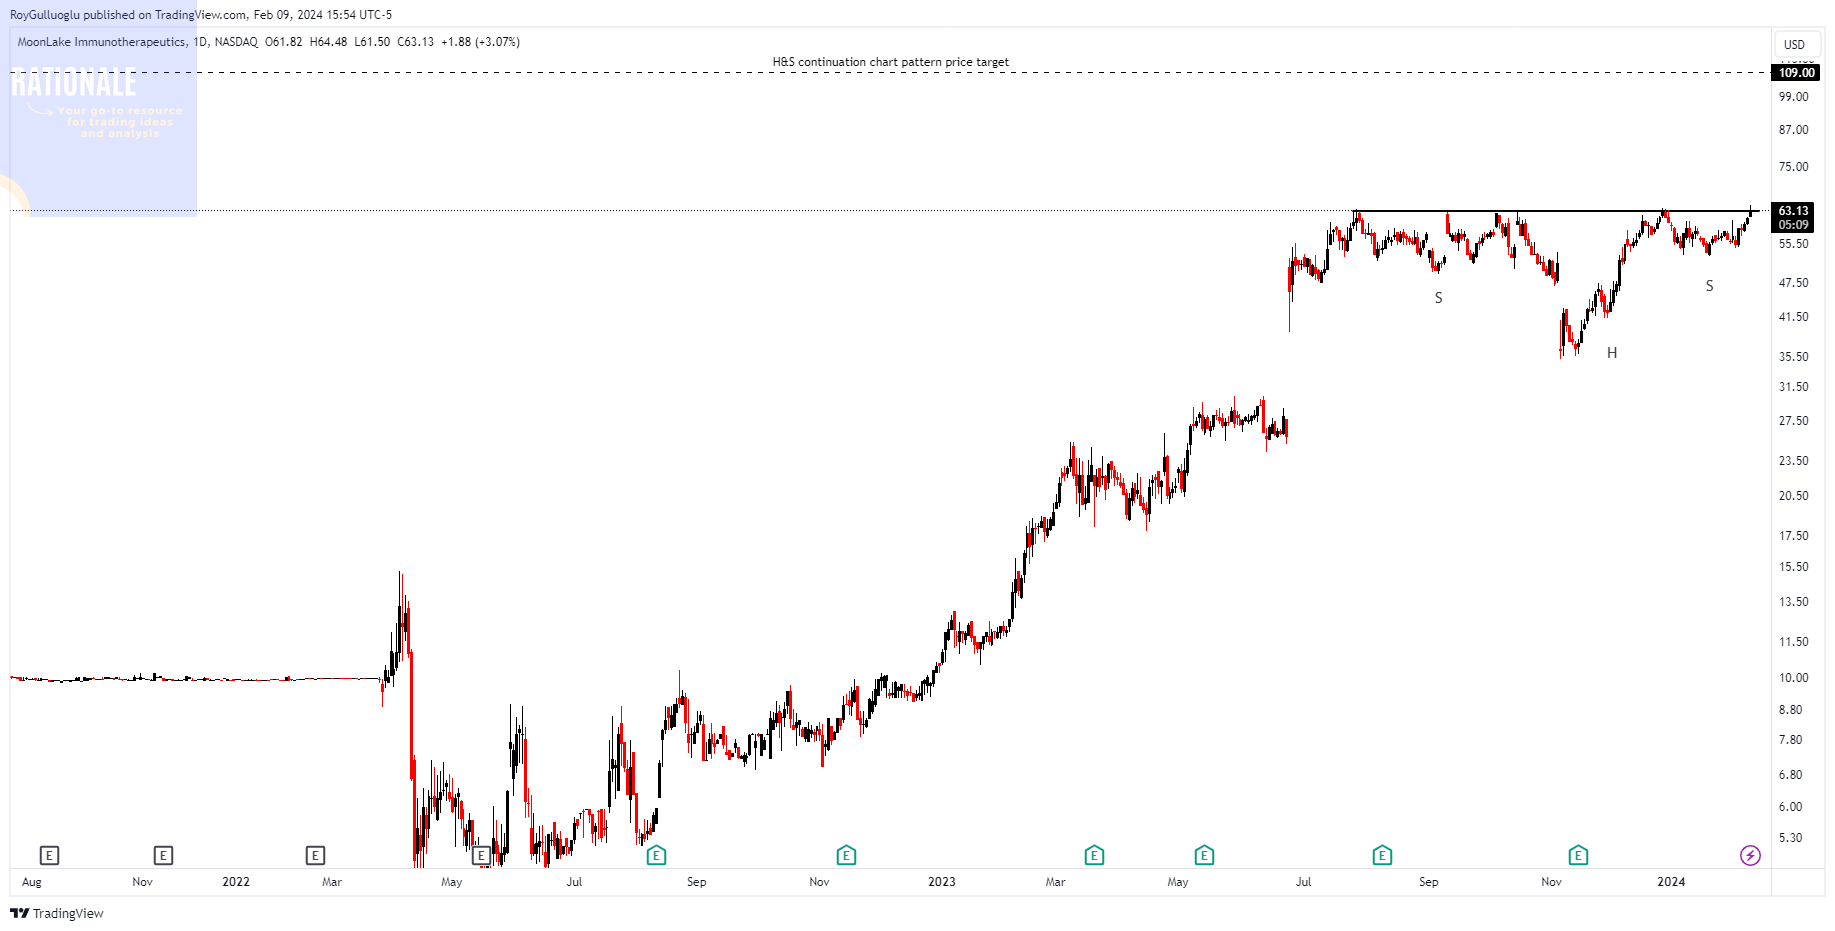
MoonLake Immunotherapeutics, a biopharmaceutical company in the clinical stage, is actively involved in the development of therapies. The company is specifically focused on advancing Sonelokimab, an innovative investigational Nanobody designed for the treatment of inflammatory diseases.
The above daily chart formed an approximately 4-month-long H&S continuation chart pattern as a bullish continuation after an uptrend.
The horizontal boundary at 63 levels acts as a resistance within this pattern.
A daily close above 64.89 levels would validate the breakout from the 4-month-long H&S continuation chart pattern.
Based on this chart pattern, the potential price target is 109 levels.
MLTX, classified under the "healthcare" sector, falls under the “Mid Cap - Value” stock category.
Leonardo DRS, Inc.-(DRS/NASDAQ)-Long Idea
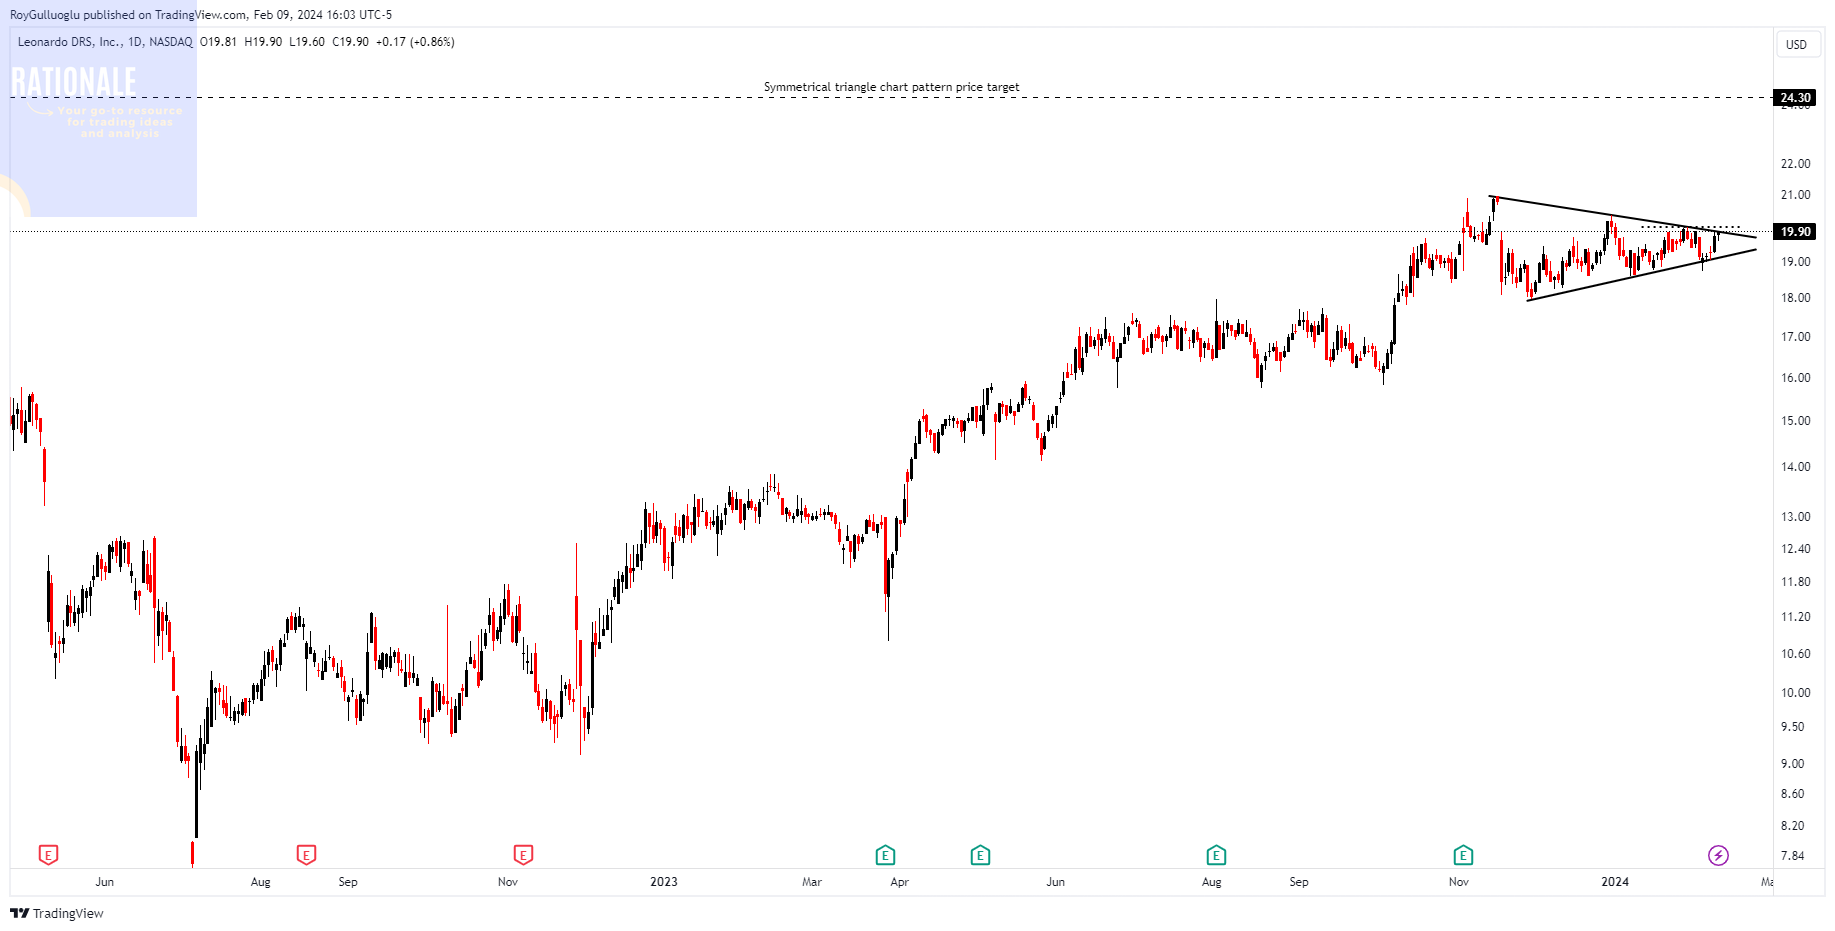
Leonardo DRS, Inc., along with its subsidiaries, delivers defense electronic products, systems, and military support services. The company operates through two segments: Advanced Sensing and Computing (ASC) and Integrated Mission Systems (IMS).
The above daily chart formed an approximately 2-month-long symmetrical triangle chart pattern as a bullish continuation after an uptrend.
A daily close above 20.6 levels would validate the breakout from the 2-month-long symmetrical triangle chart pattern.
Based on this chart pattern, the potential price target is 24.3 levels.
DRS, classified under the "industrials" sector, falls under the “Mid Cap - Value” stock category.
Follow-ups
Motorola Solutions, Inc.-(MSI/NYSE)-Long Idea
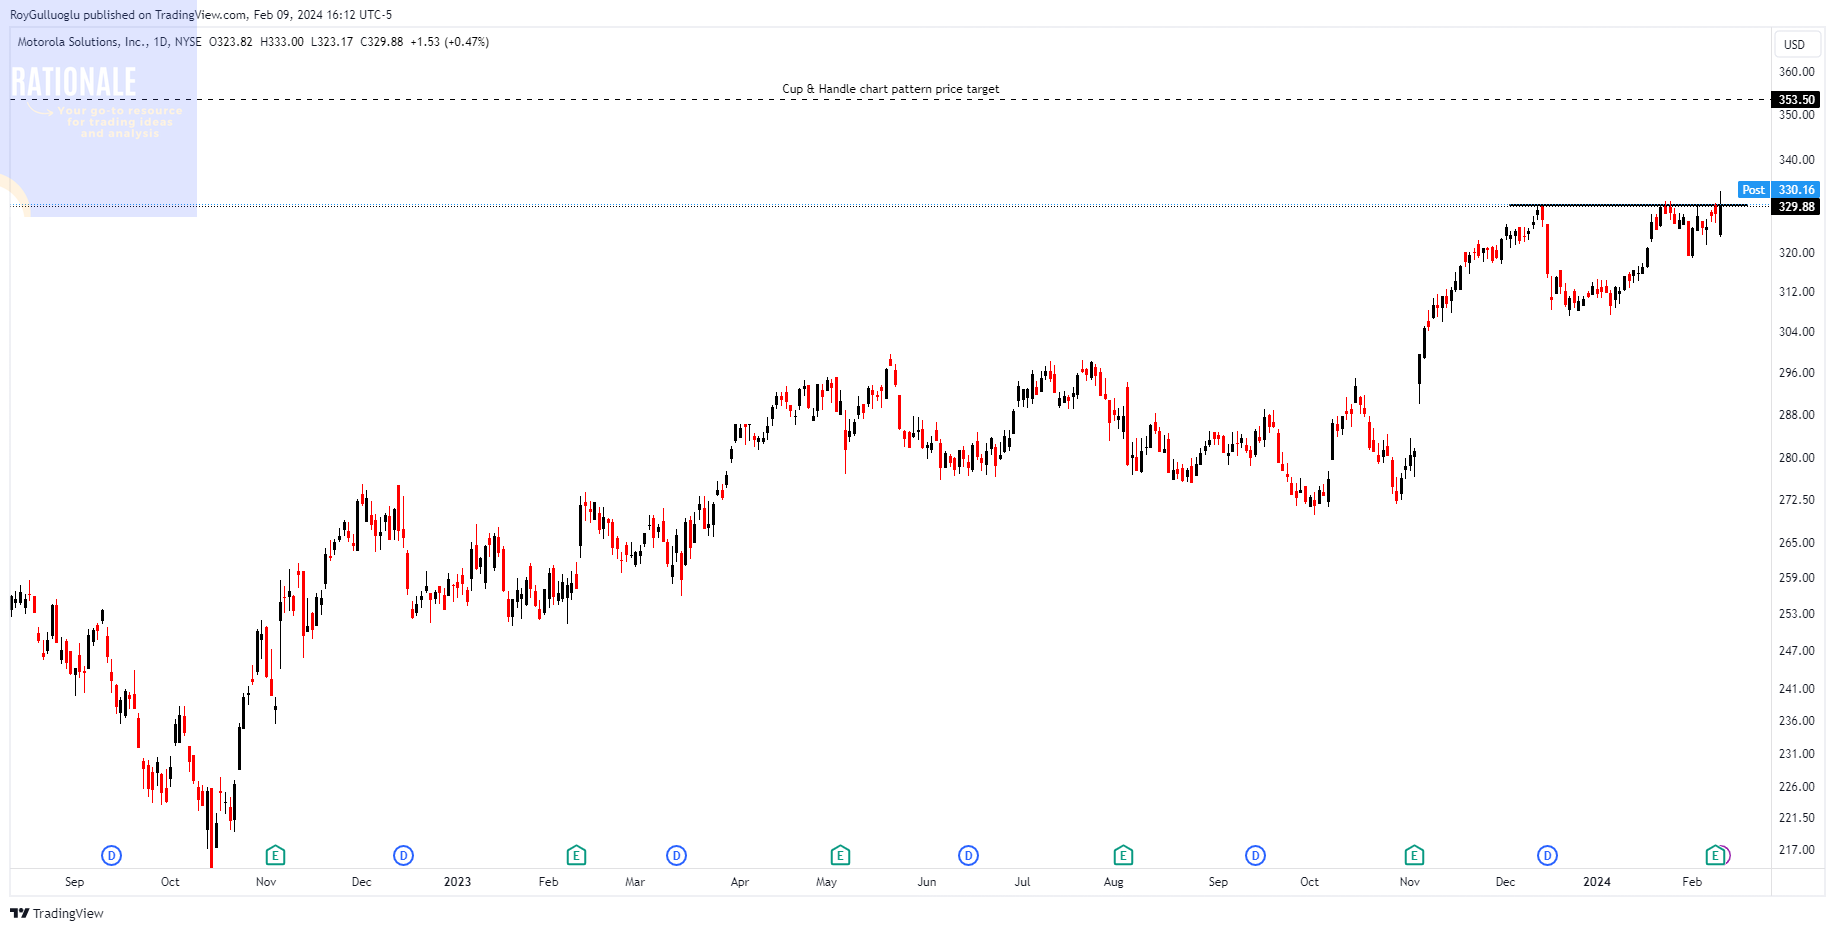
You can click the MSI ticker above to access the first report explaining the RATIONALE behind the trade idea.
Ametek, Inc.-(AME/NYSE)-Long Idea
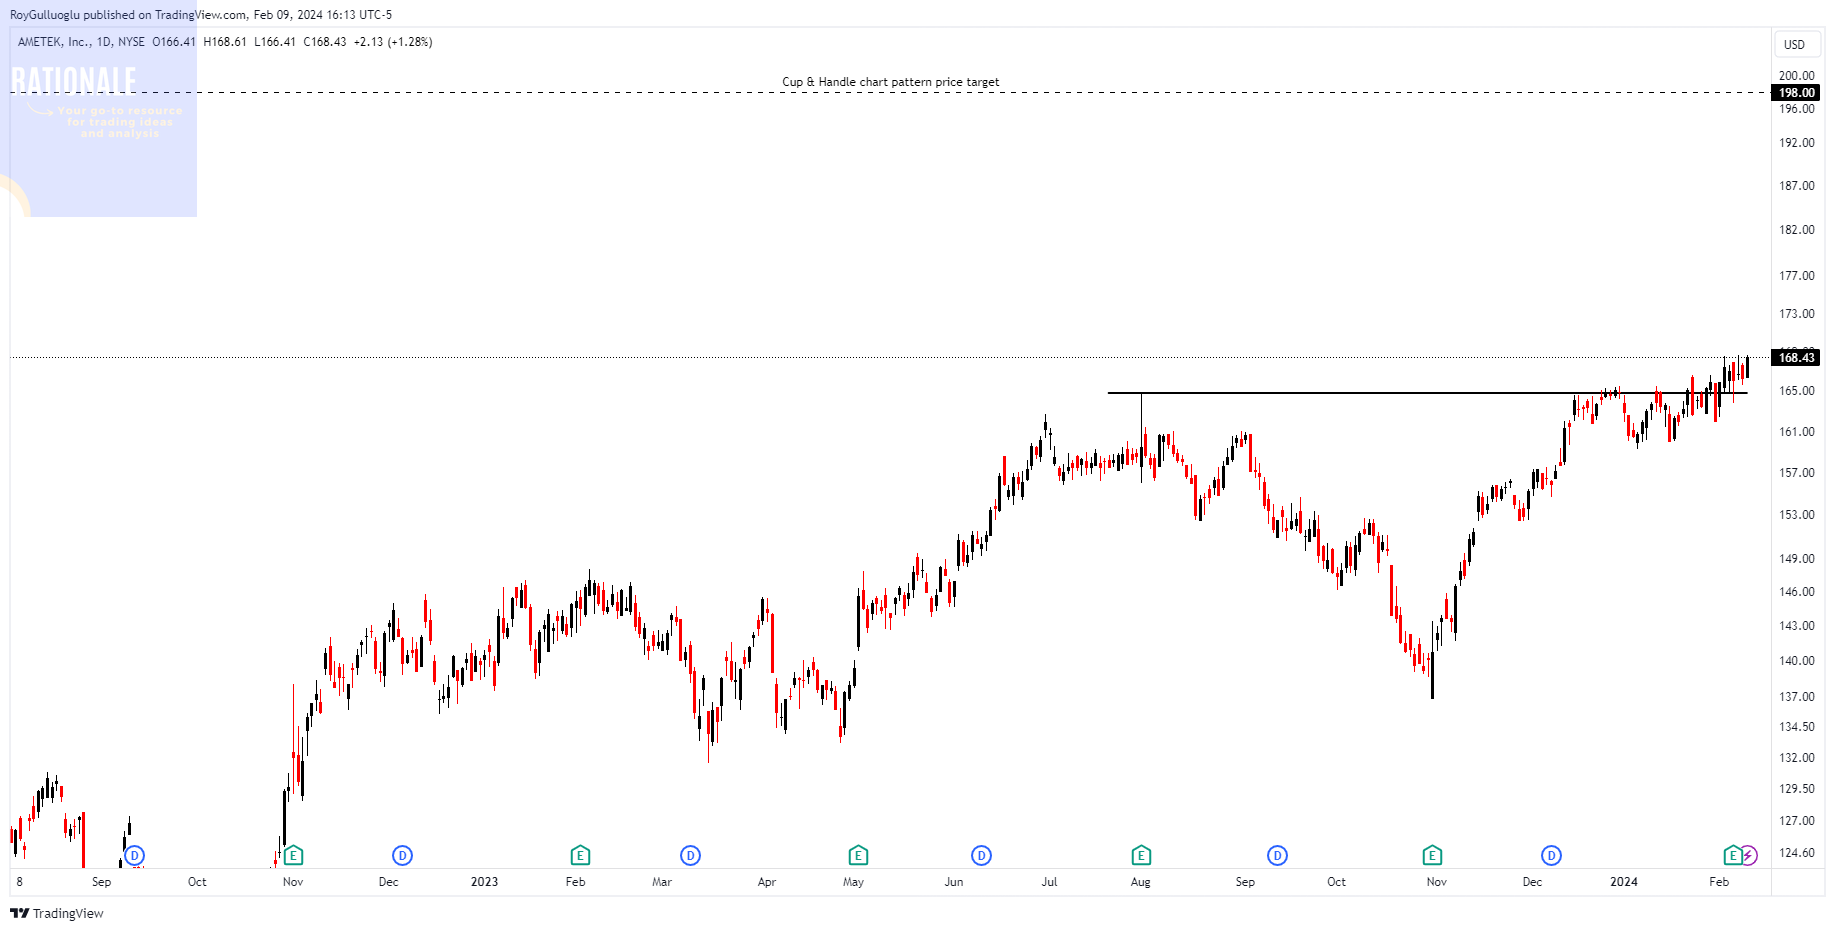
You can click the AME ticker above to access the first report explaining the RATIONALE behind the trade idea.
Okta, Inc.-(OKTA/NASDAQ)-Long Idea
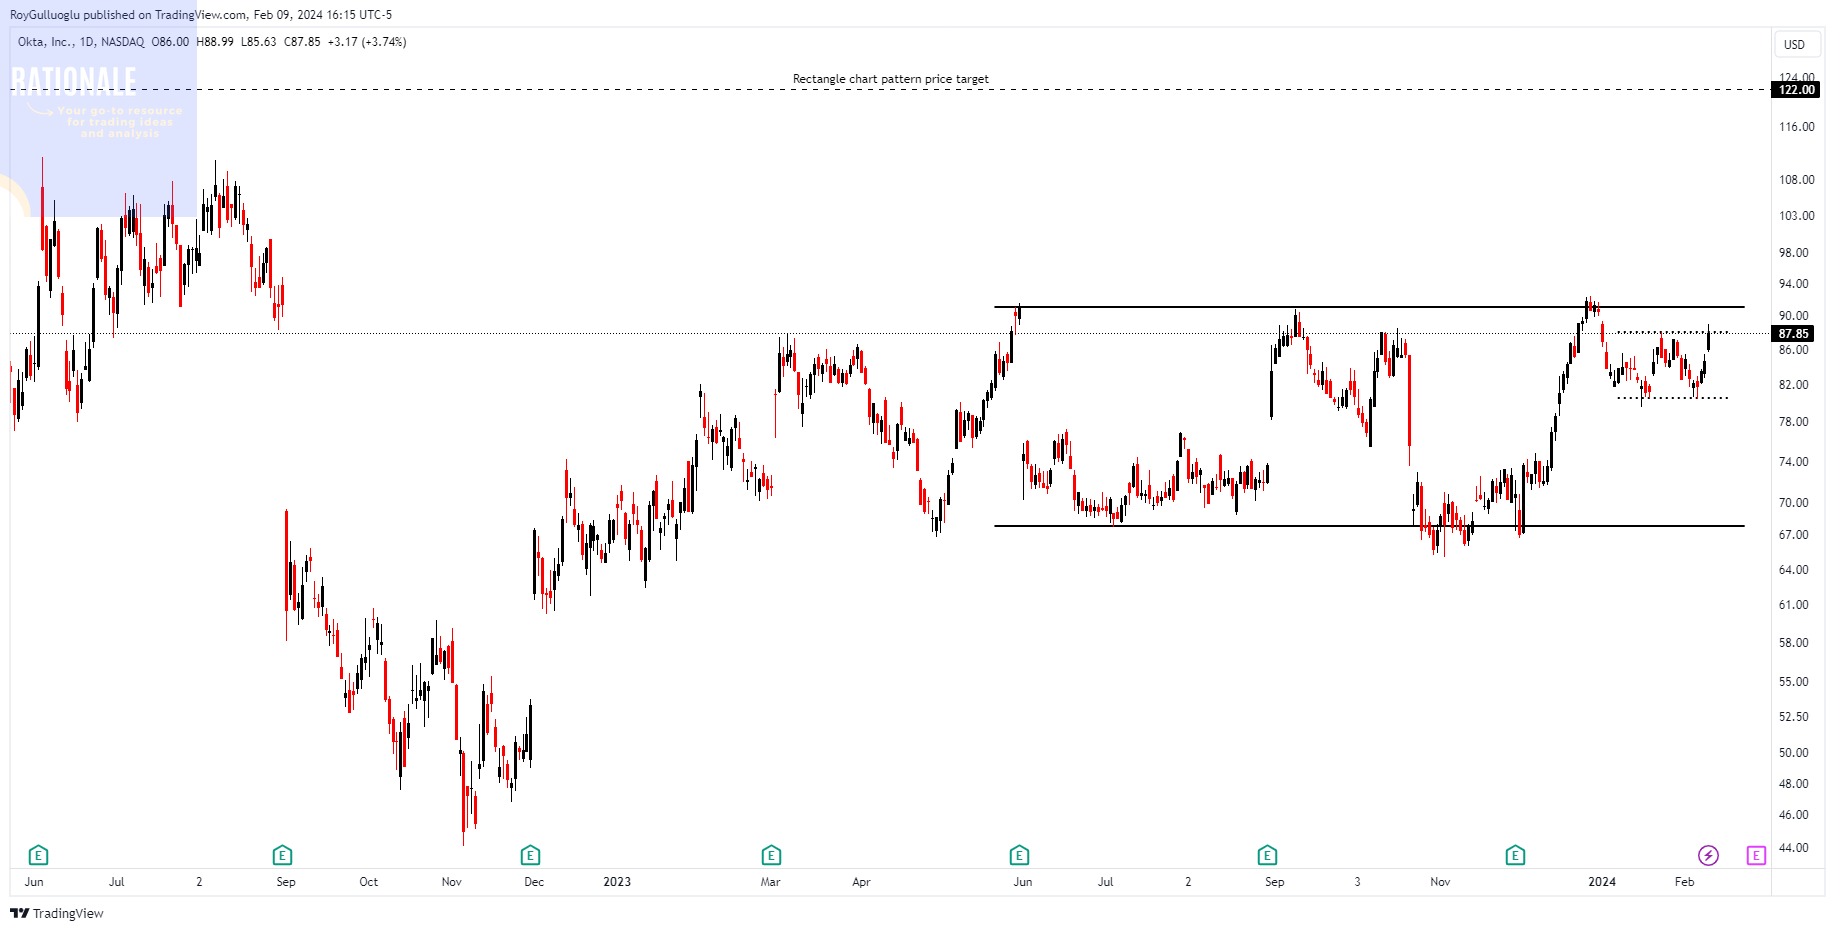
You can click the OKTA ticker above to access the first report explaining the RATIONALE behind the trade idea.