New setups
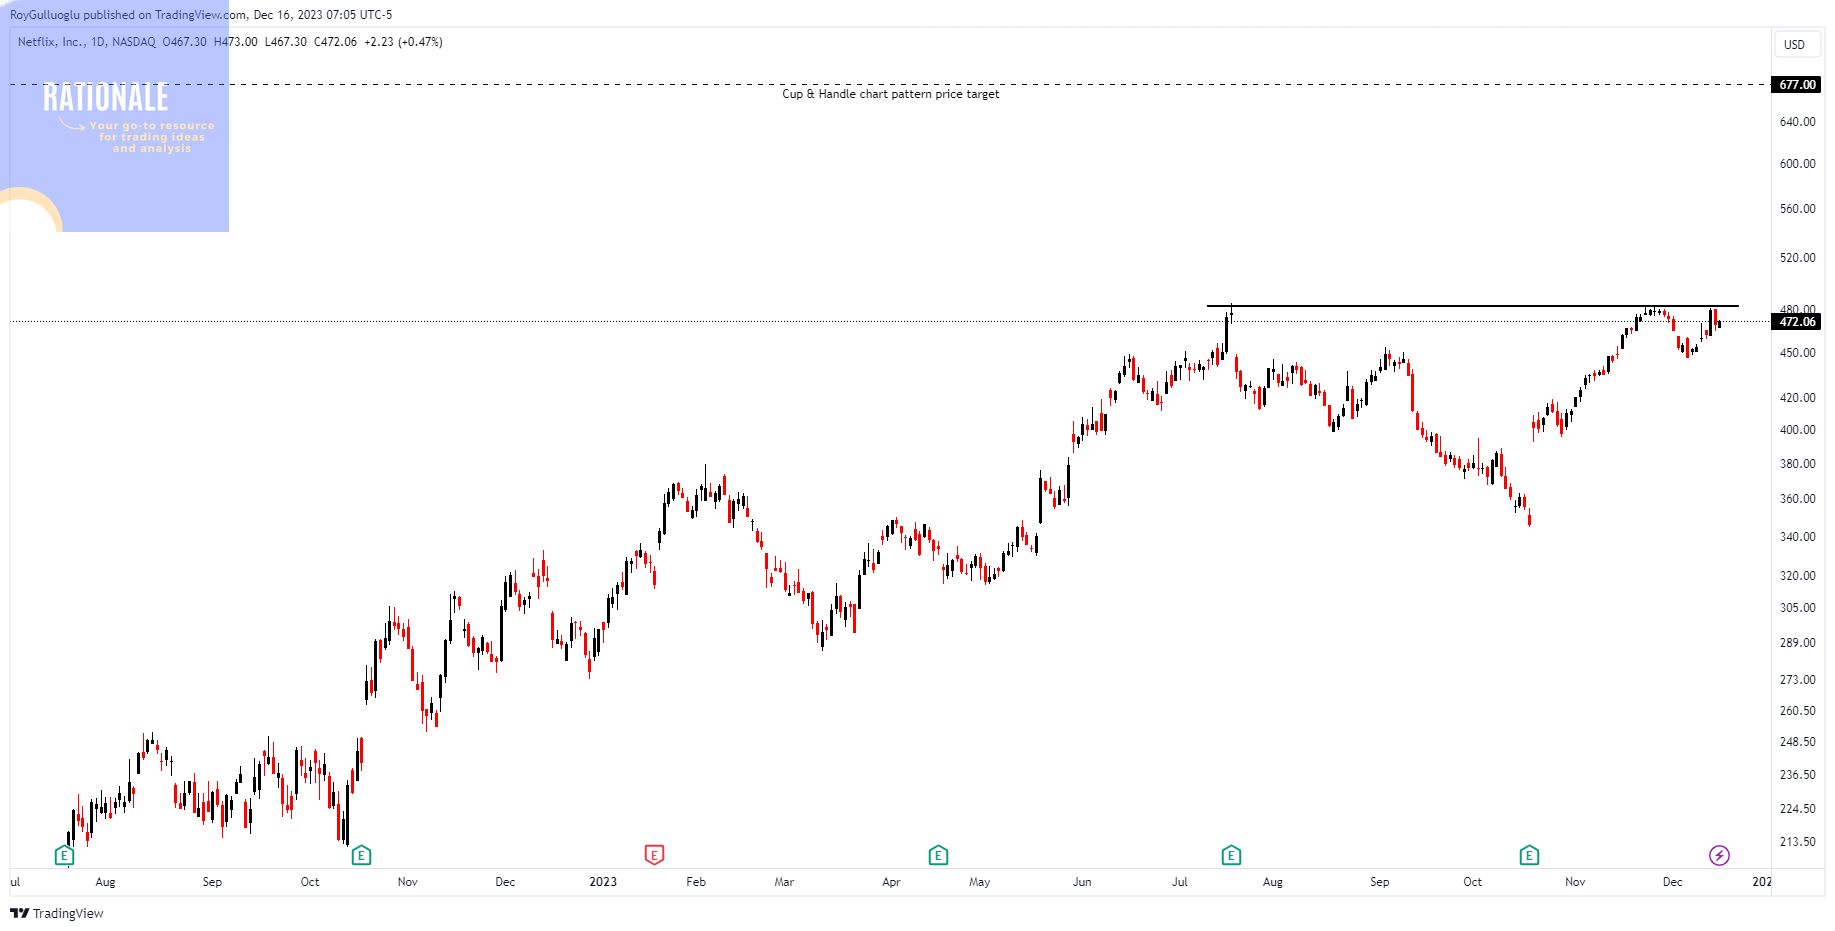
Netflix, Inc.-(NFLX/NASDAQ)-Long Idea
Netflix is a subscription-based streaming service that provides a wide variety of TV shows, movies, documentaries, and other entertainment content to its subscribers.
The above daily chart formed an approximately 3-month-long Cup & Handle chart pattern as a bullish continuation after an uptrend.
Within this pattern, the horizontal boundary at 483 levels acts as a resistance.
A daily close above 497.5 levels would validate the breakout from the 3-month-long Cup & Handle chart pattern.
Based on this chart pattern, the potential price target is 677 levels.
NFLX, classified under the "communication services" sector, falls under the “Large Cap - Growth” stock category.
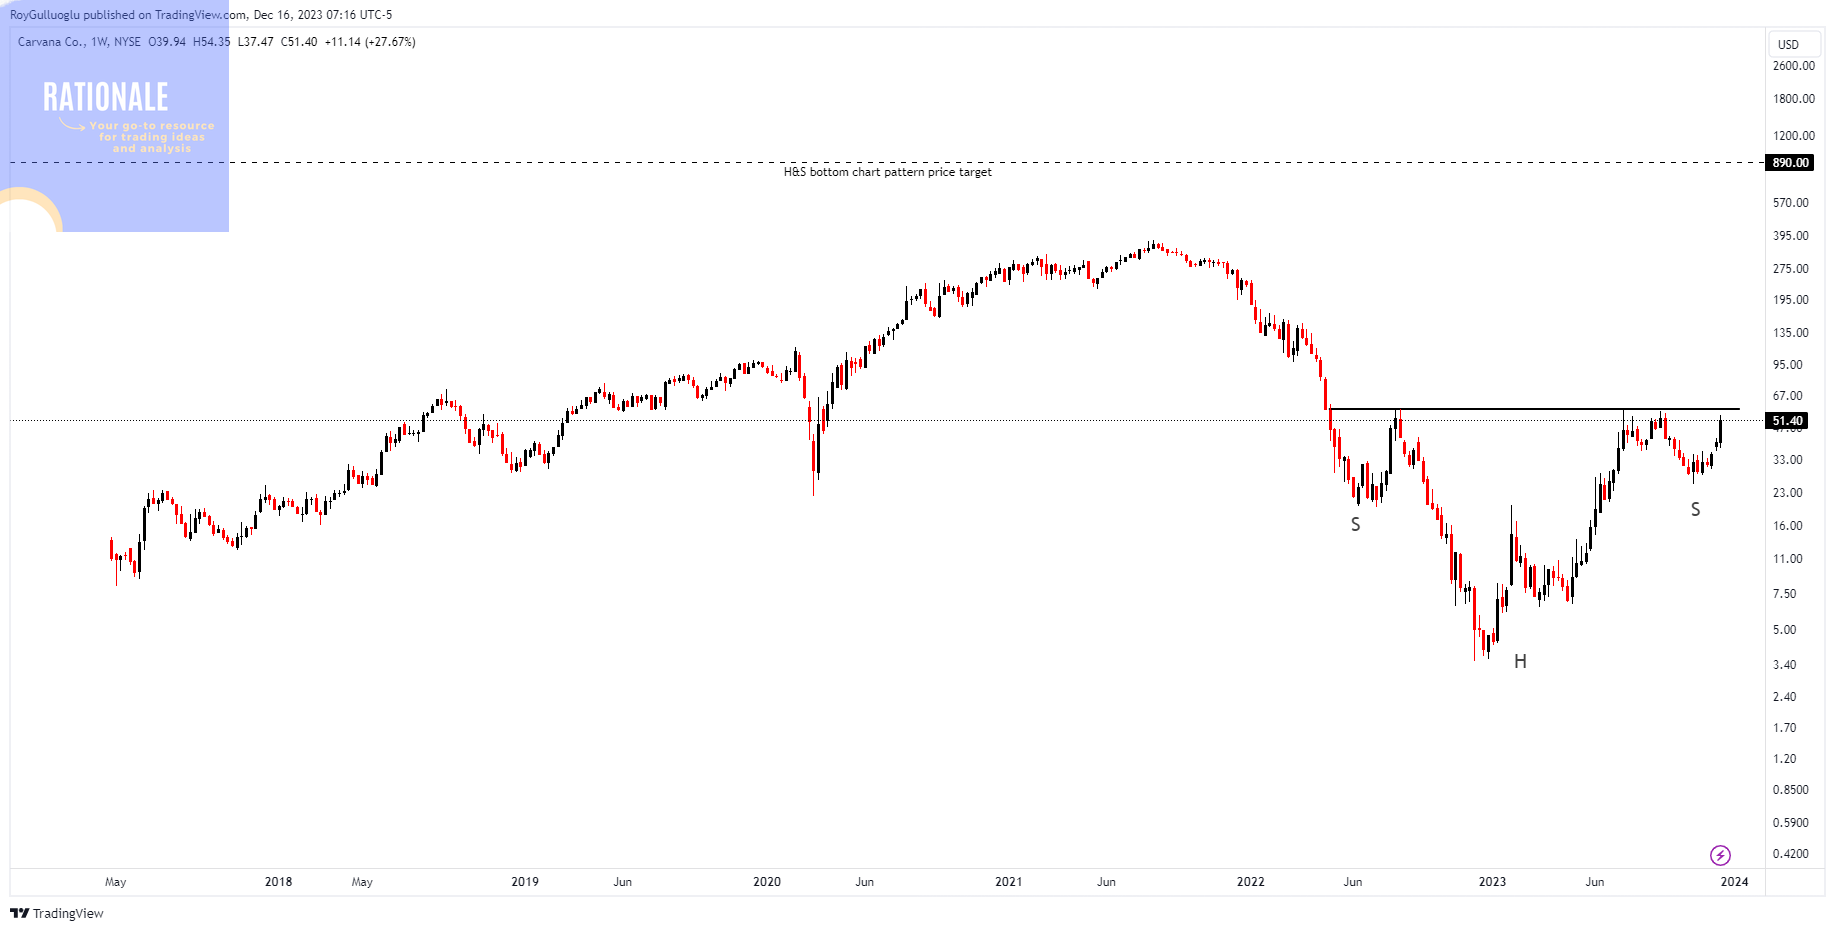
Carvana, Co.-(CVNA/NYSE)-Long Idea
Carvana is an online platform for buying and selling used cars.
The above weekly chart formed an approximately 21-month-long H&S bottom chart pattern as a bullish reversal after a downtrend.
Within this pattern, the horizontal boundary at 58 levels acts as a resistance.
A daily close above 59.74 levels would validate the breakout from the 21-month-long H&S bottom chart pattern.
Based on this chart pattern, the potential price target is 890 levels.
CVNA, classified under the "consumer cyclical" sector, falls under the “Mid Cap - Growth” stock category.
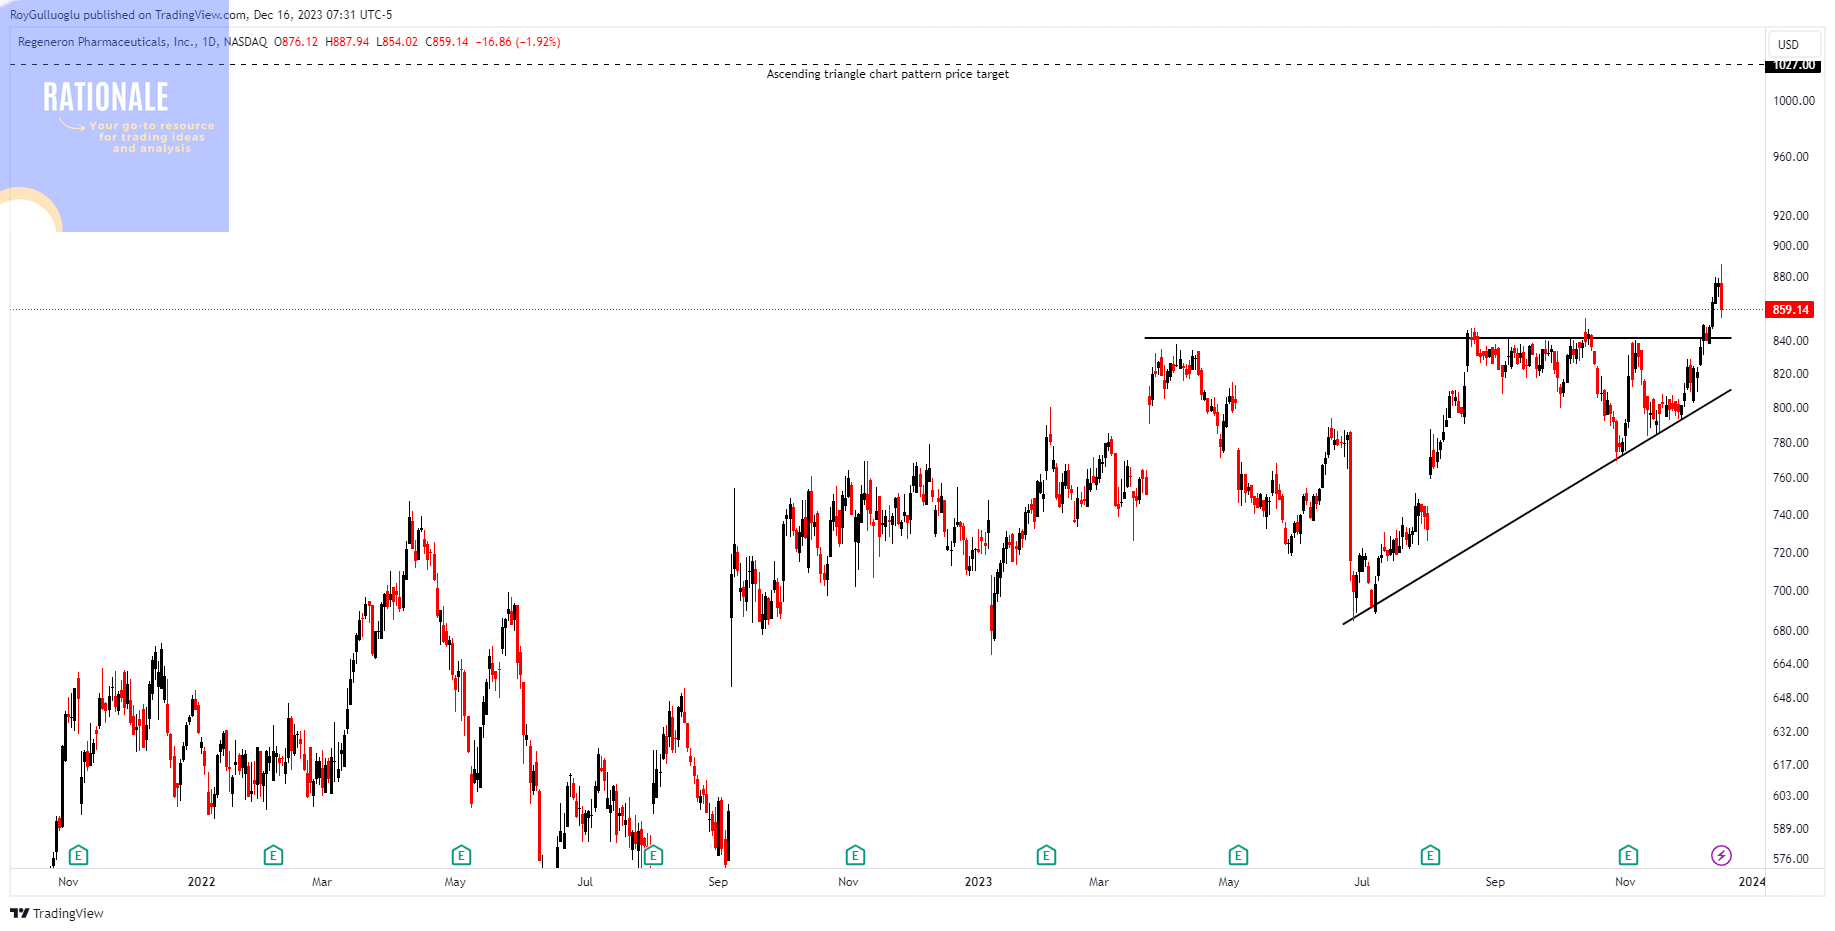
Regeneron Pharmaceuticals, Inc.-(REGN/NYSE)-Long Idea
Regeneron Pharmaceuticals is a biotechnology company that focuses on the discovery, development, and commercialization of pharmaceutical products.
The above daily chart formed an approximately 5-month-long ascending triangle chart pattern as a bullish continuation after an uptrend.
Within this pattern, the horizontal boundary at 841.16 levels acted as a resistance.
A daily close above 866.4 levels validated the breakout from the 5-month-long ascending triangle chart pattern.
Based on this chart pattern, the potential price target is 1027 levels.
REGN, classified under the "healthcare" sector, falls under the “Large Cap - Value” stock category.
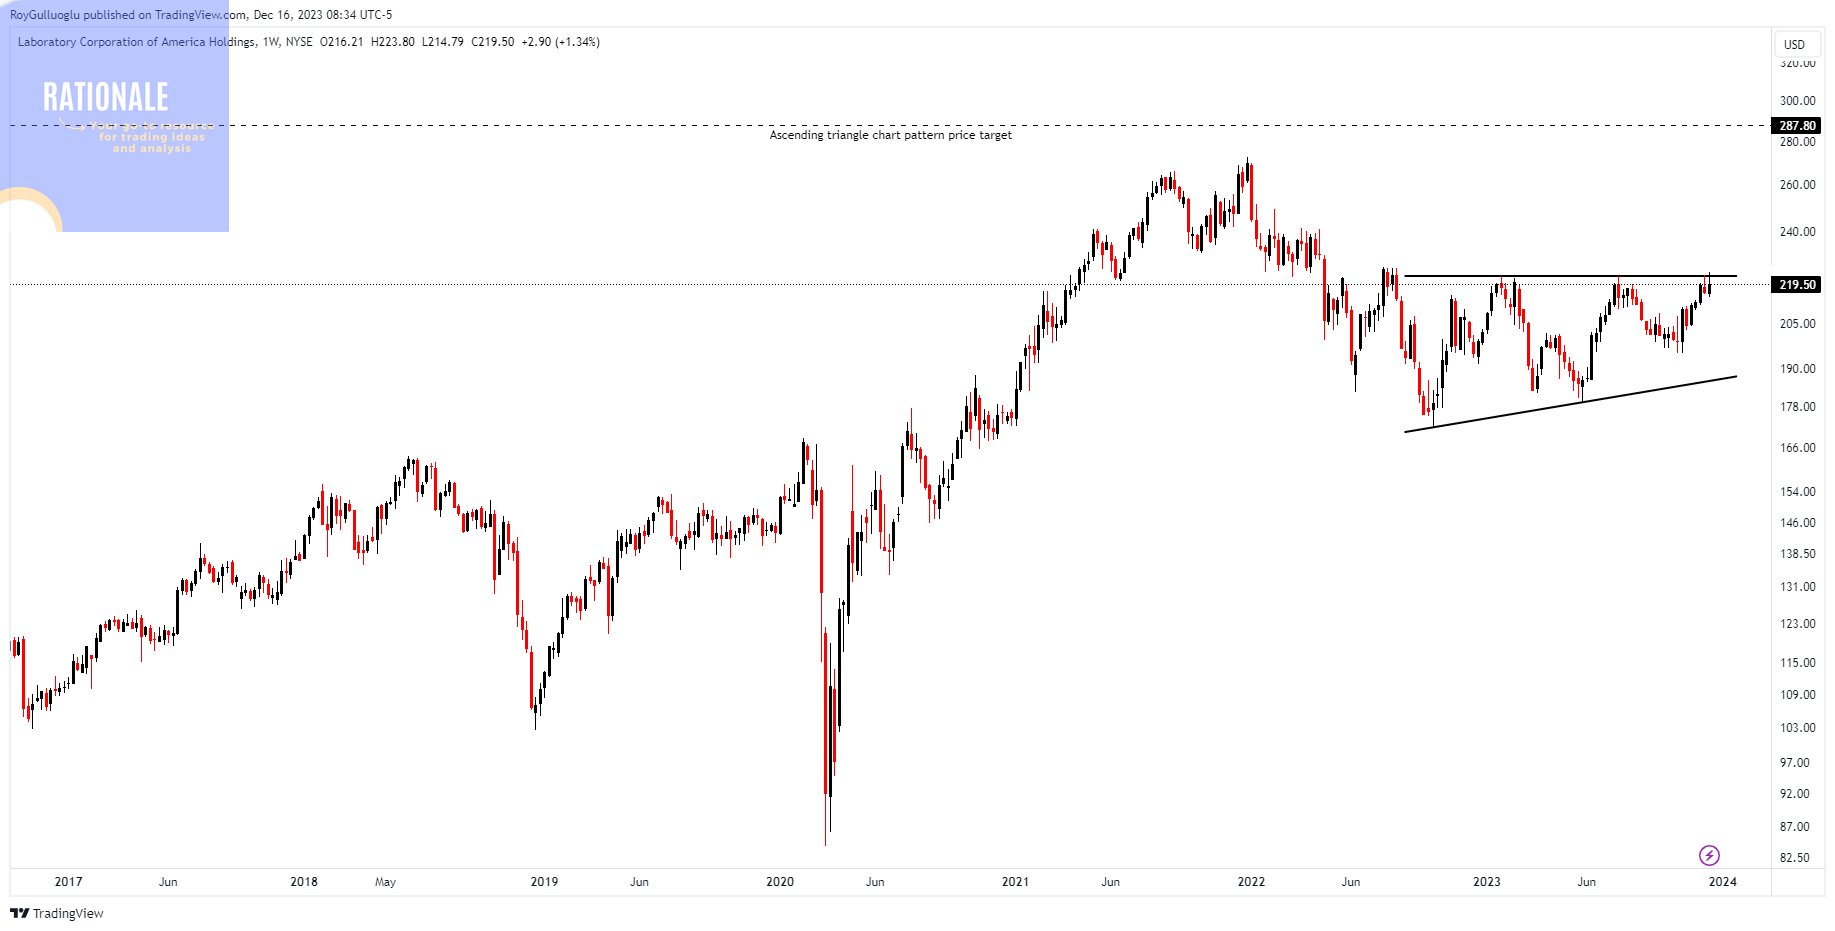
Laboratory Corporation of America Holdings-(LH/NYSE)-Long Idea
LabCorp is a global life sciences company that operates in the fields of diagnostics and drug development.
The above weekly chart formed an approximately 15-month-long ascending triangle chart pattern as a bullish reversal after a downtrend.
Within this pattern, the horizontal boundary at 222.41 levels acts as a resistance.
A daily close above 229.08 levels would validate the breakout from the 15-month-long ascending triangle chart pattern.
Based on this chart pattern, the potential price target is 287.8 levels.
LH, classified under the "healthcare" sector, falls under the “Large Cap - Value” stock category.
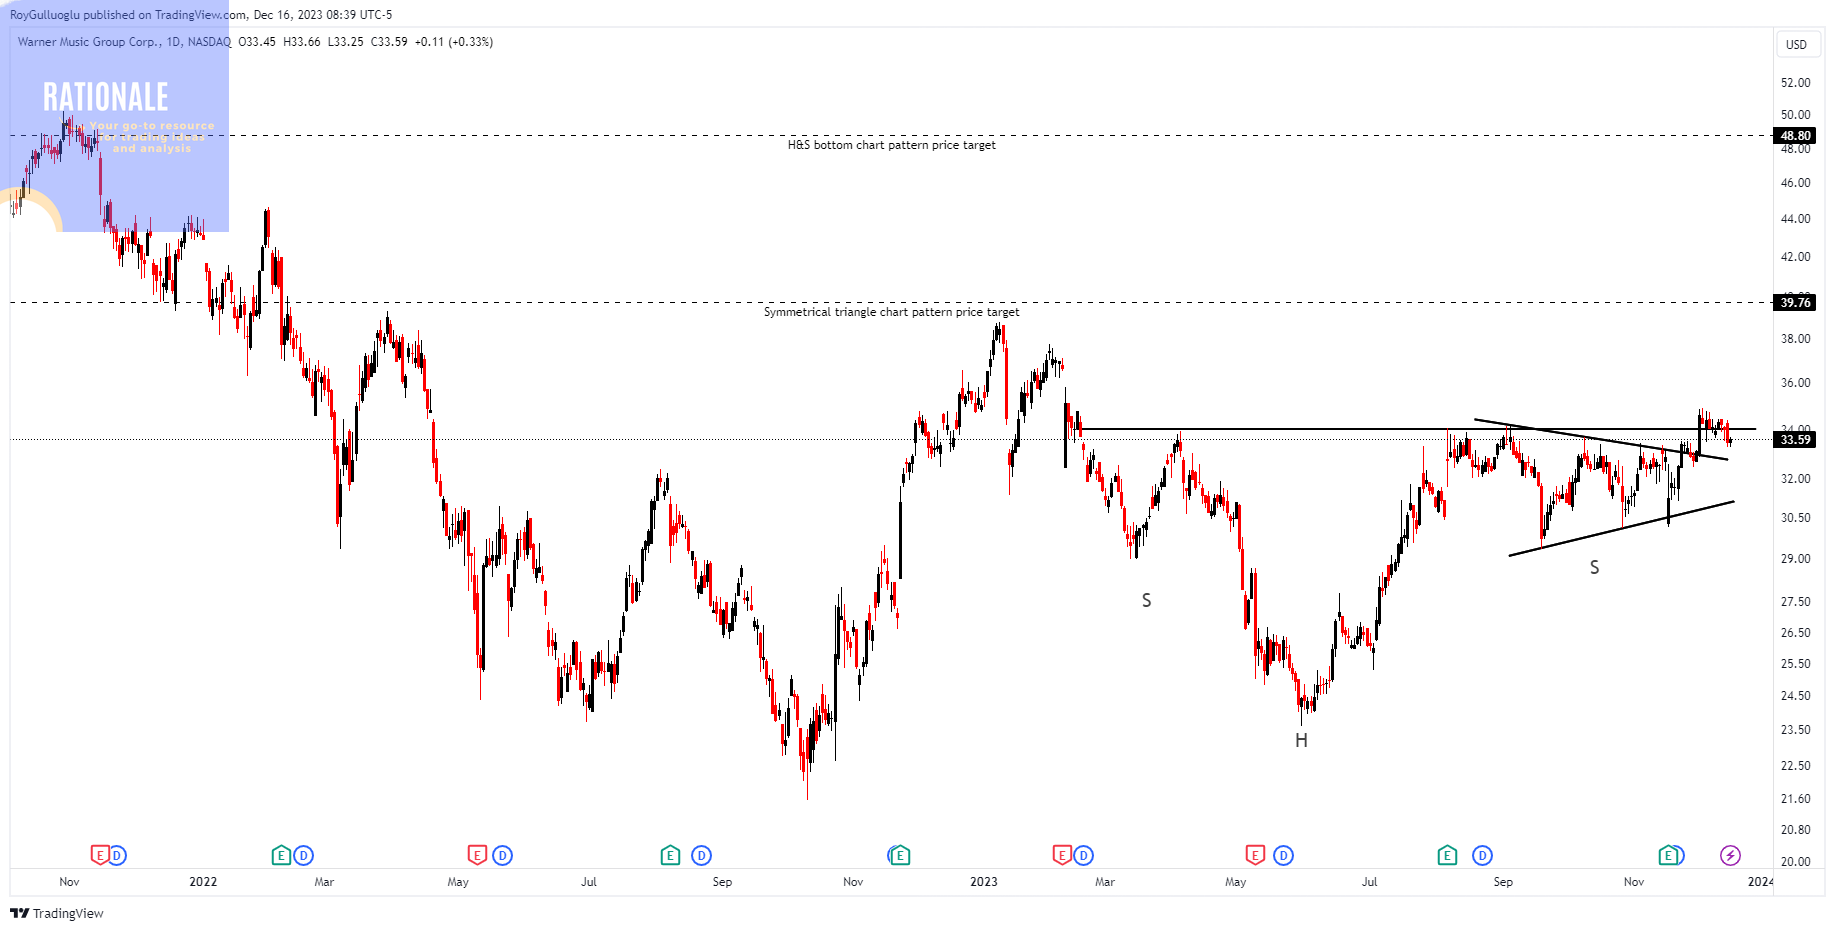
Warner Music Group Corp.-(WMG/NYSE)-Long Idea
Warner Music Group Corp (WMG) is one of the major global music entertainment companies, and it operates in various aspects of the music industry.
The above daily chart formed an approximately 7-month-long H&S bottom chart pattern as a bullish reversal after a downtrend.
Within this pattern, the horizontal boundary at 34 levels acts as a resistance for the H&S bottom chart pattern.
A daily close above 35 levels would validate the breakout from the 7-month-long H&S bottom chart pattern.
Based on the chart pattern, the potential price target is 48.8.
Also, an approximately 2-month-long symmetrical triangle chart pattern is formed as a right shoulder of the above chart pattern.
A daily close above 34.5 levels validated the breakout from the 2-month-long symmetrical triangle chart pattern.
WMG, classified under the "communication sector" sector, falls under the “Large Cap - Growth” stock category.
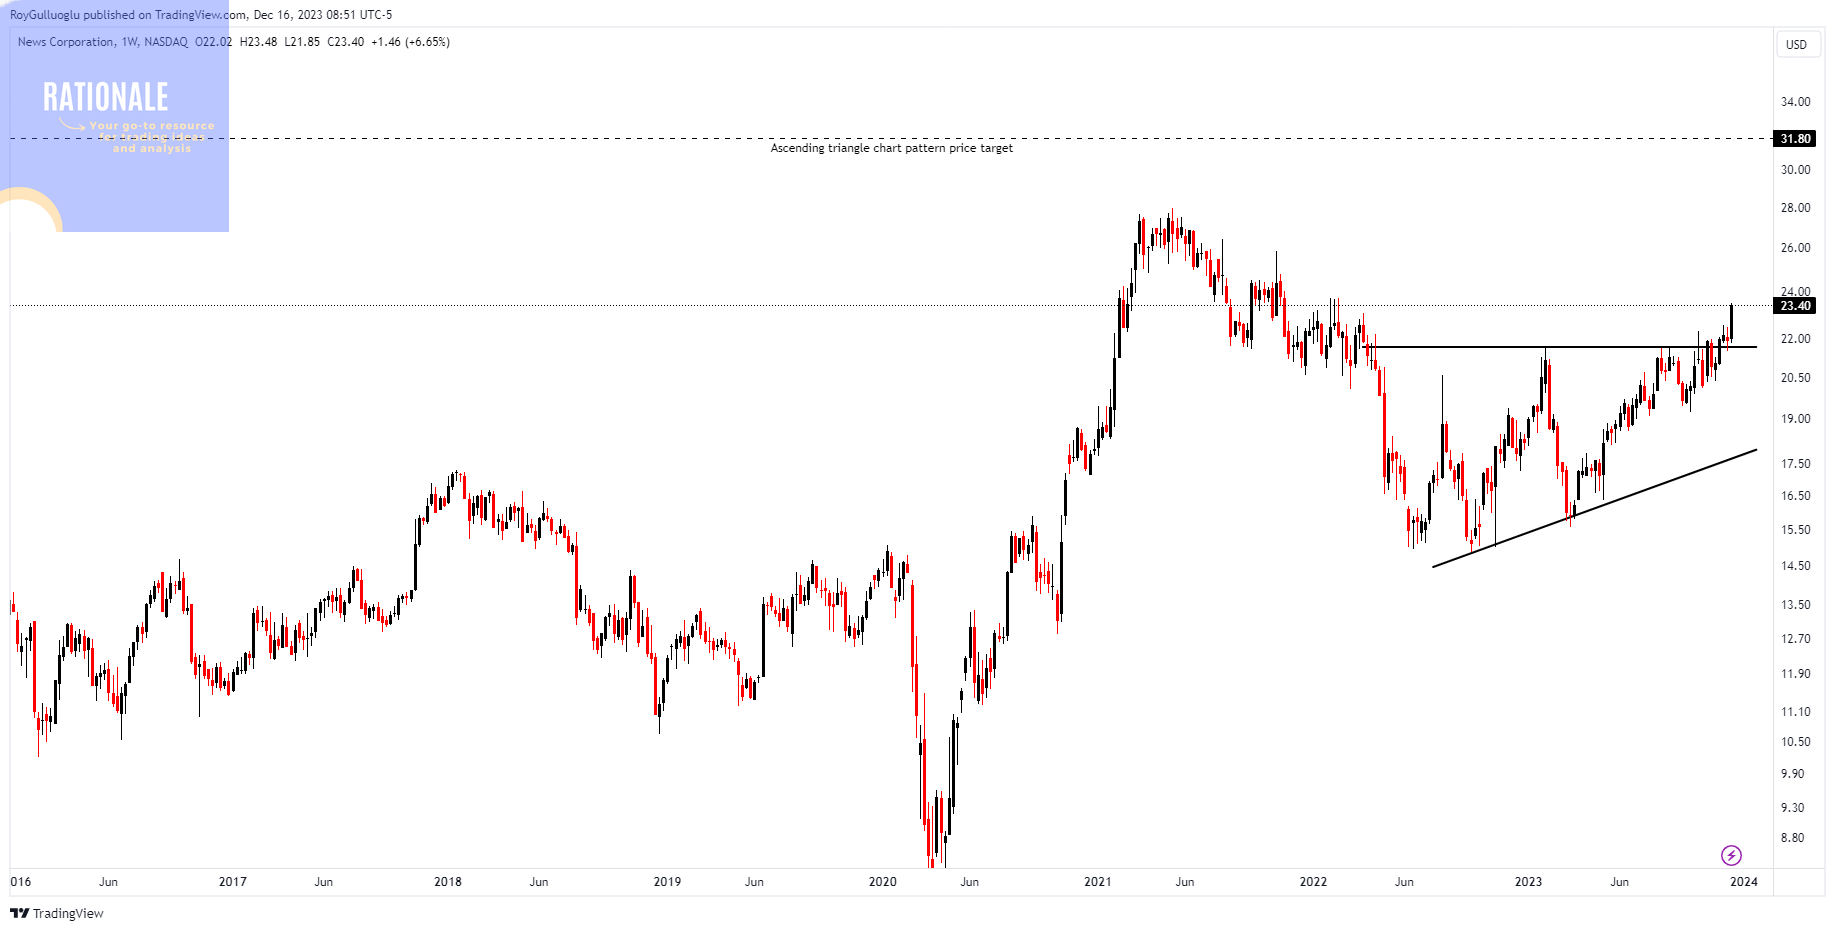
News Corporation-(NWSA/NASDAQ)-Long Idea
News Corporation, now known as News Corp, is a diversified media and information services company.
The above weekly chart formed an approximately 13-month-long ascending triangle chart pattern as a bullish reversal after a downtrend.
Within this pattern, the horizontal boundary at 21.67 levels acted as a resistance.
A daily close above 22.32 levels validated the breakout from the 13-month-long ascending triangle chart pattern.
Based on this chart pattern, the potential price target is 31.8 levels.
NWSA, classified under the "communications services" sector, falls under the “Large Cap - Growth” stock category.
Follow-ups
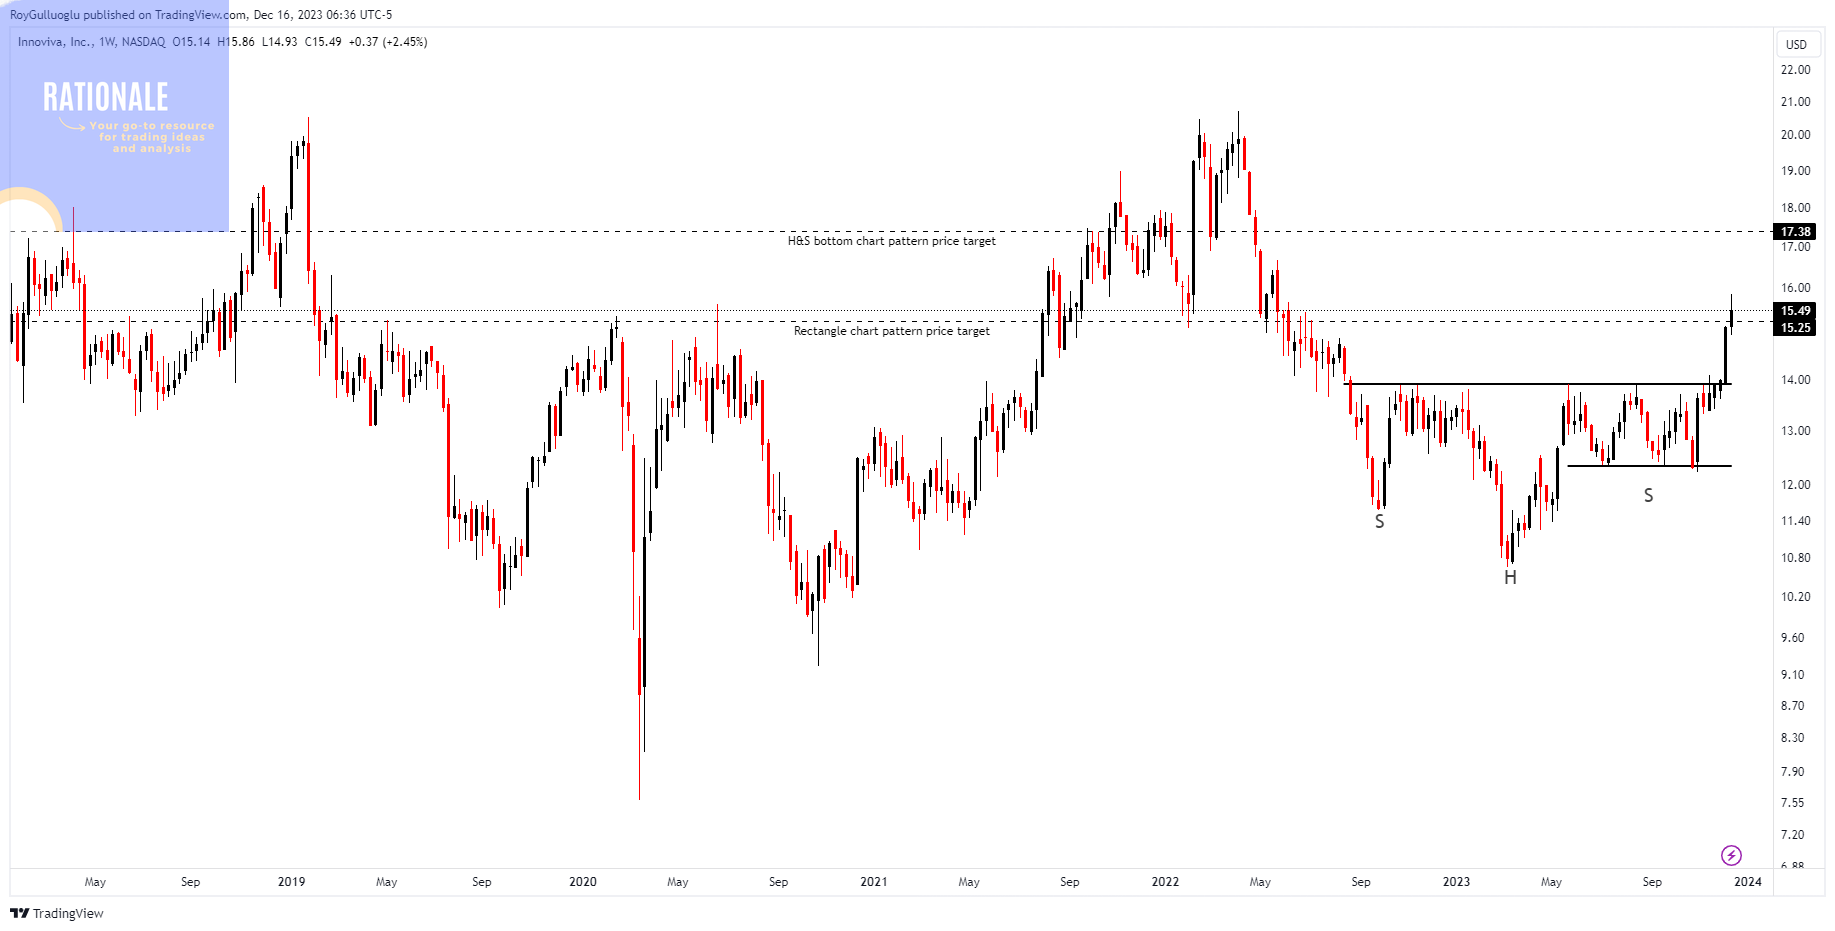
Innoviva Inc-(INVA/NASDAQ)-Long Ide
You can click the INVA ticker above to access the first report explaining the RATIONALE behind the trade idea.
The rectangle chart pattern price target is reached.
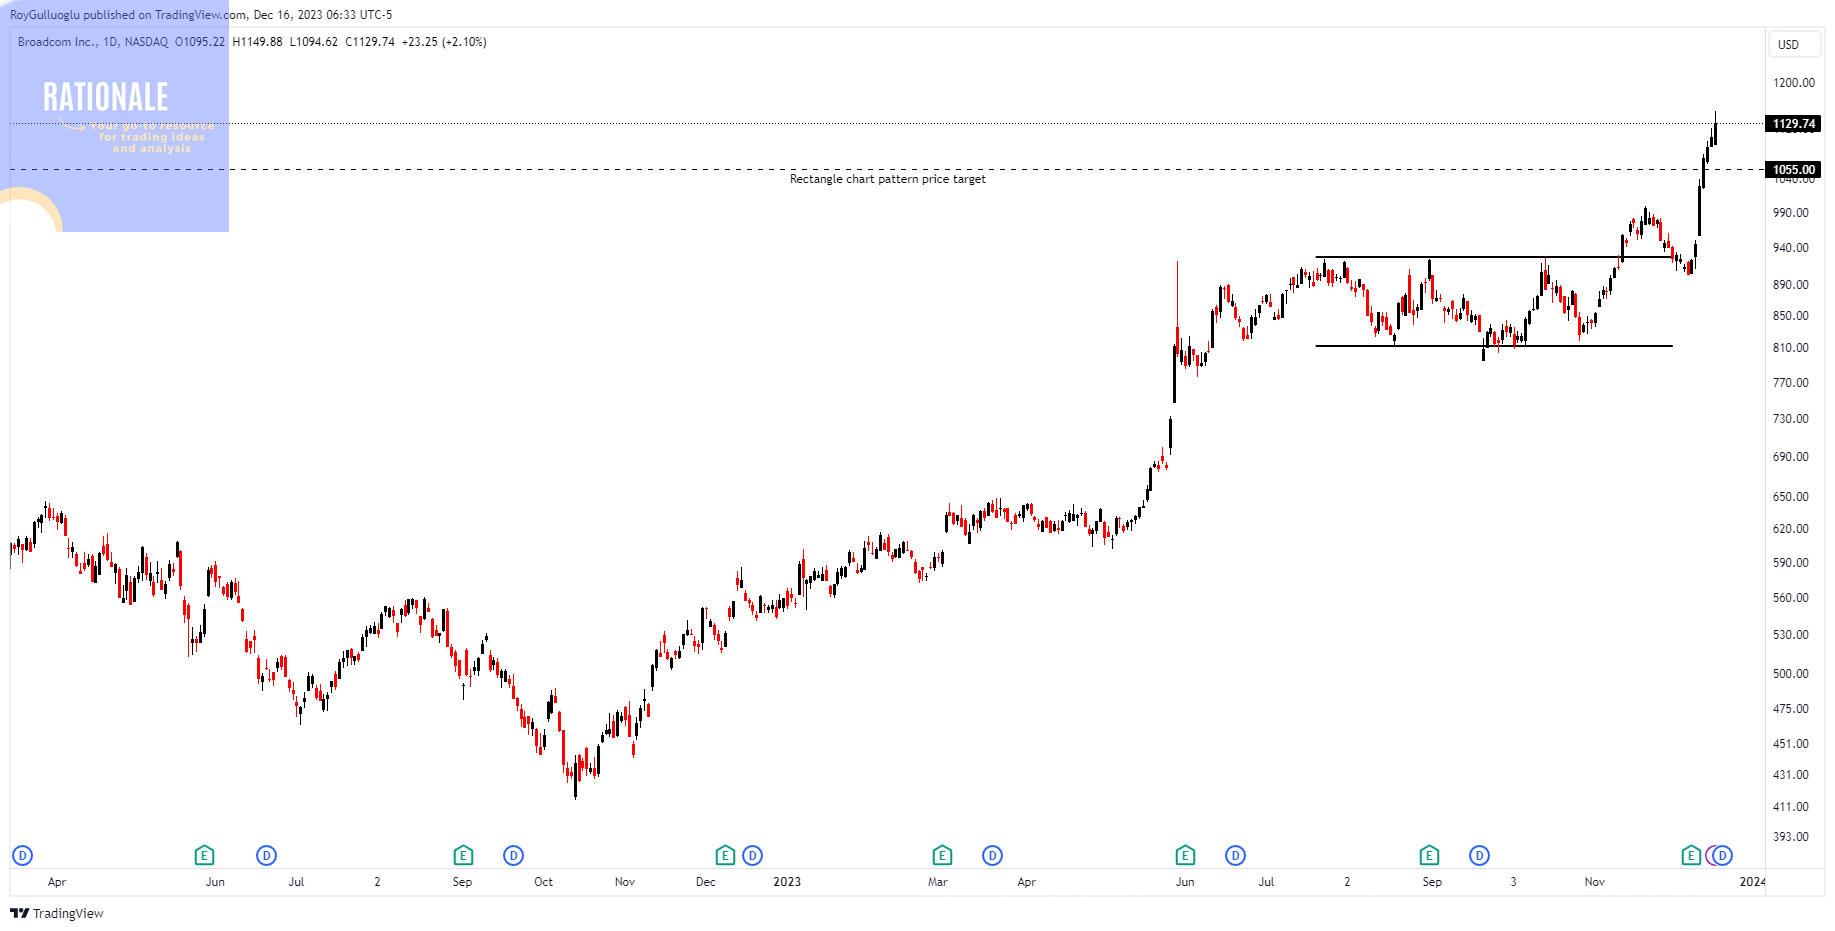
Broadcom-(AVGO/NASDAQ)-Long Idea
You can click the AVGO ticker above to access the first report explaining the RATIONALE behind the trade idea.
The rectangle chart pattern price target is reached.
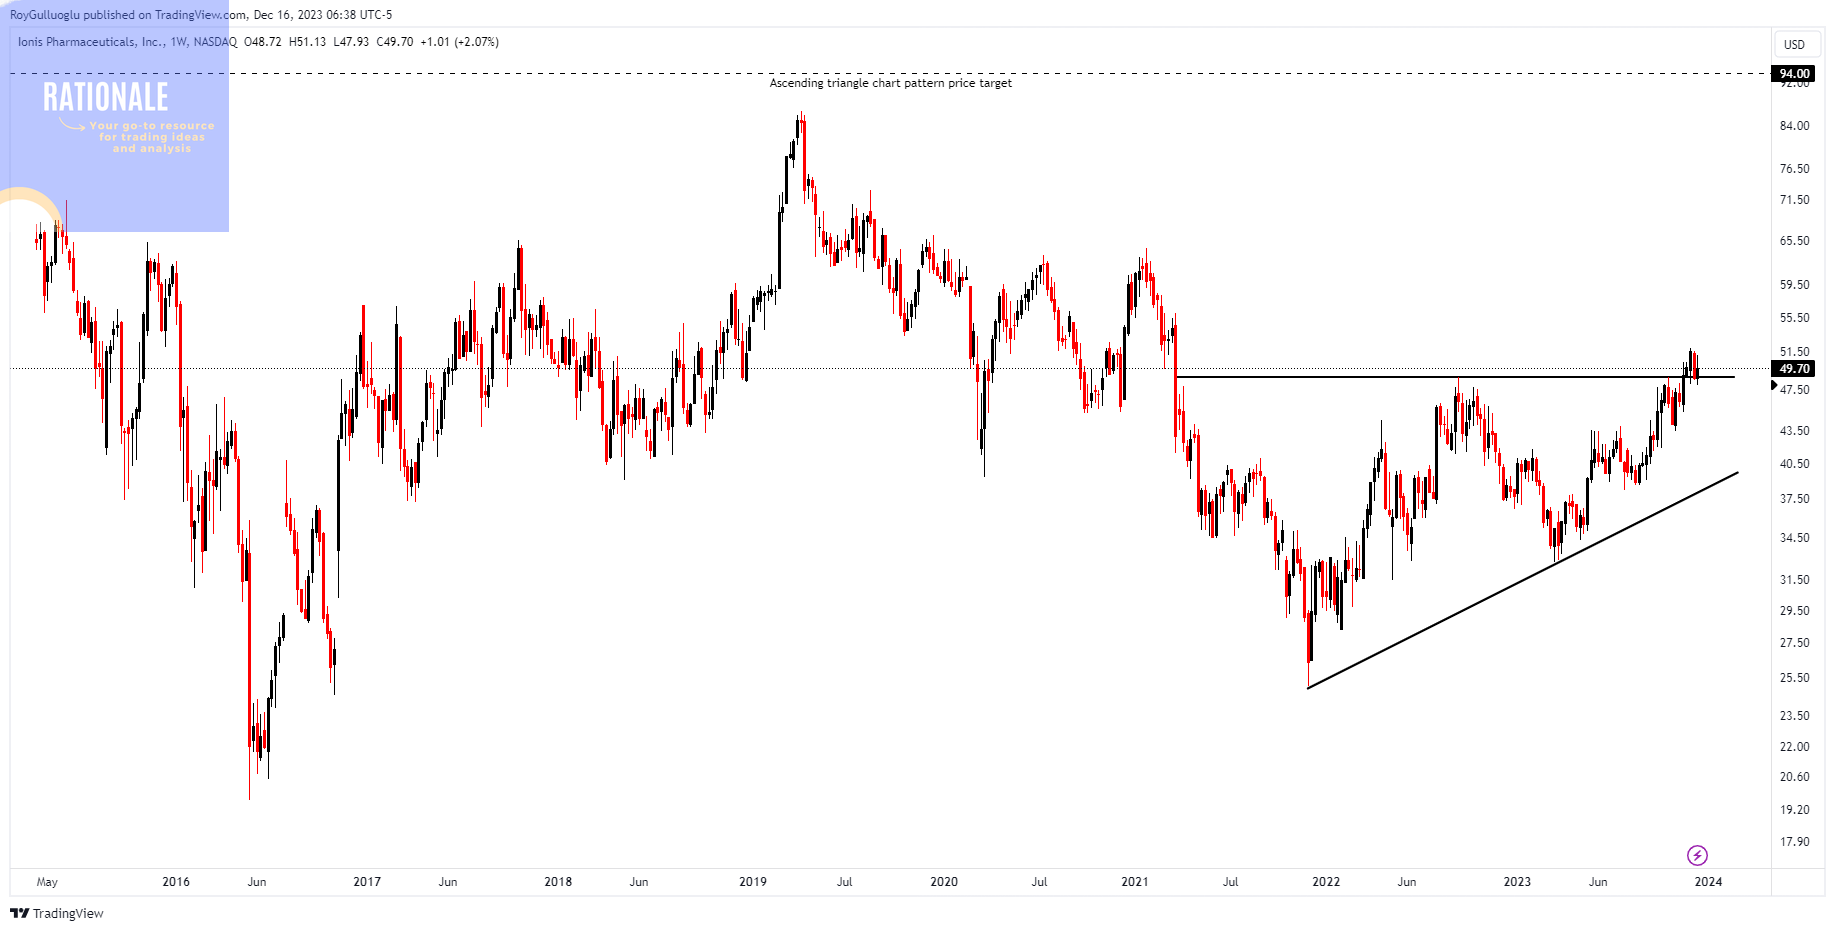
Ionis Pharmaceuticals-(IONS/NASDAQ)-Long Idea
You can click the IONS ticker above to access the first report explaining the RATIONALE behind the trade idea.
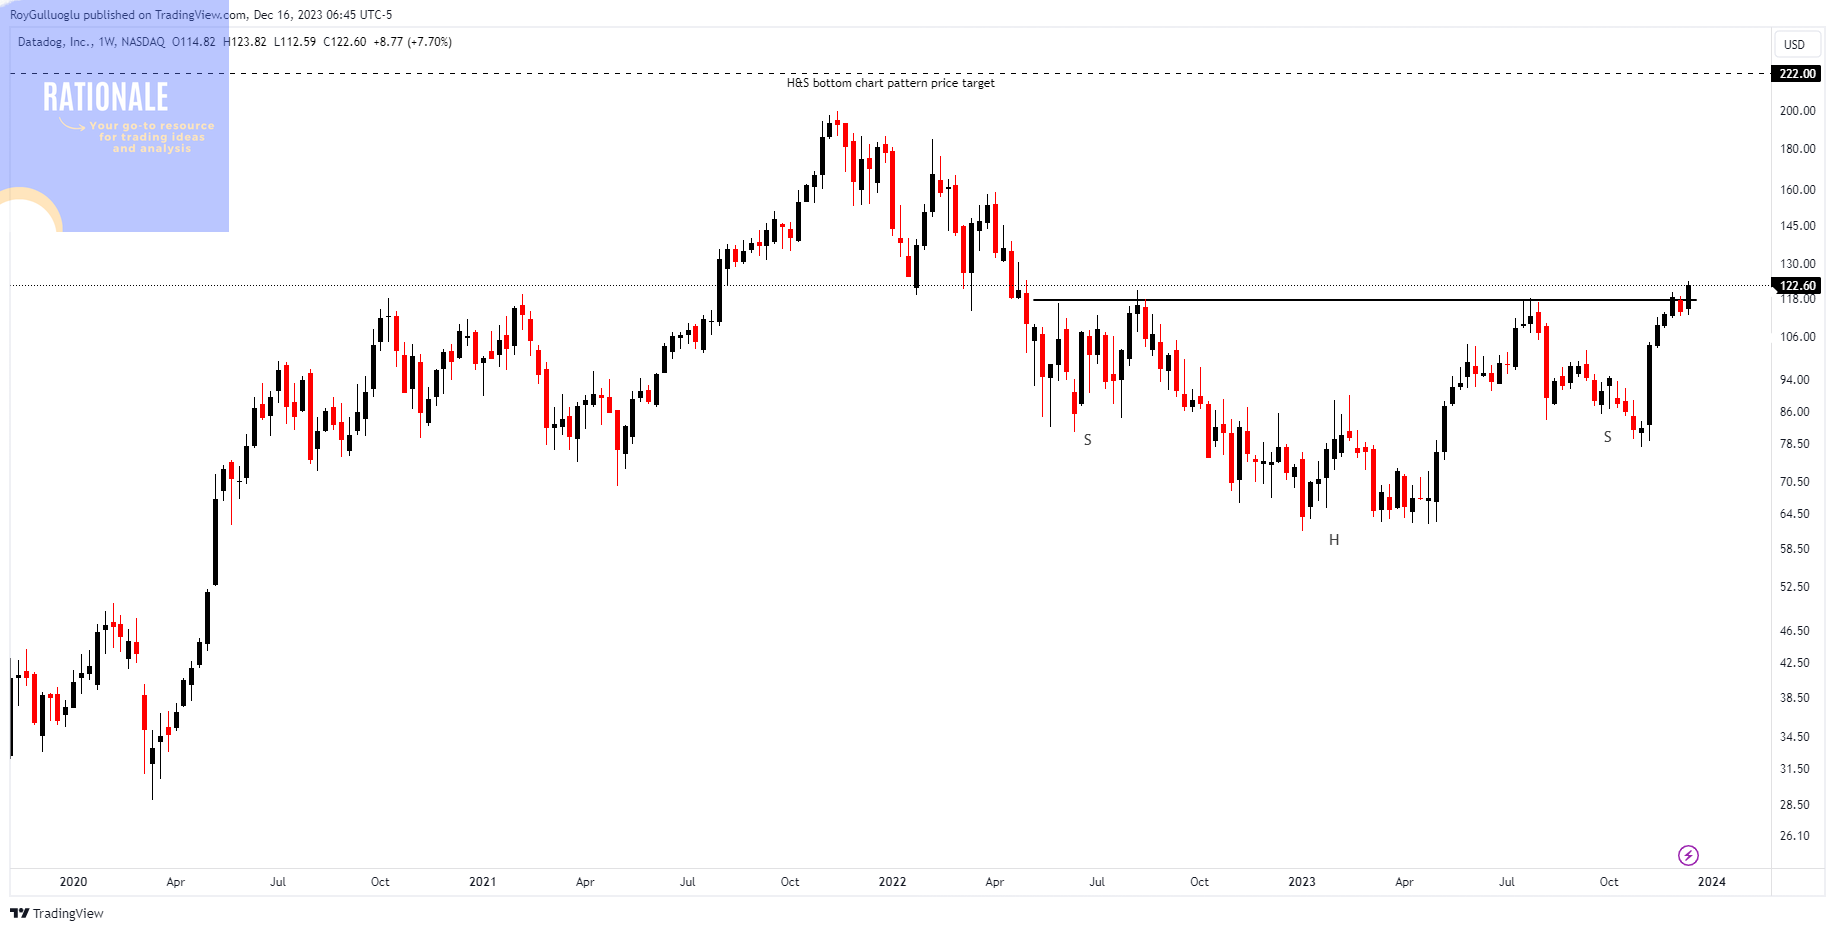
Datadog, Inc-(DDOG/NASDAQ)-Long Idea
You can click the DDOG ticker above to access the first report explaining the RATIONALE behind the trade idea.
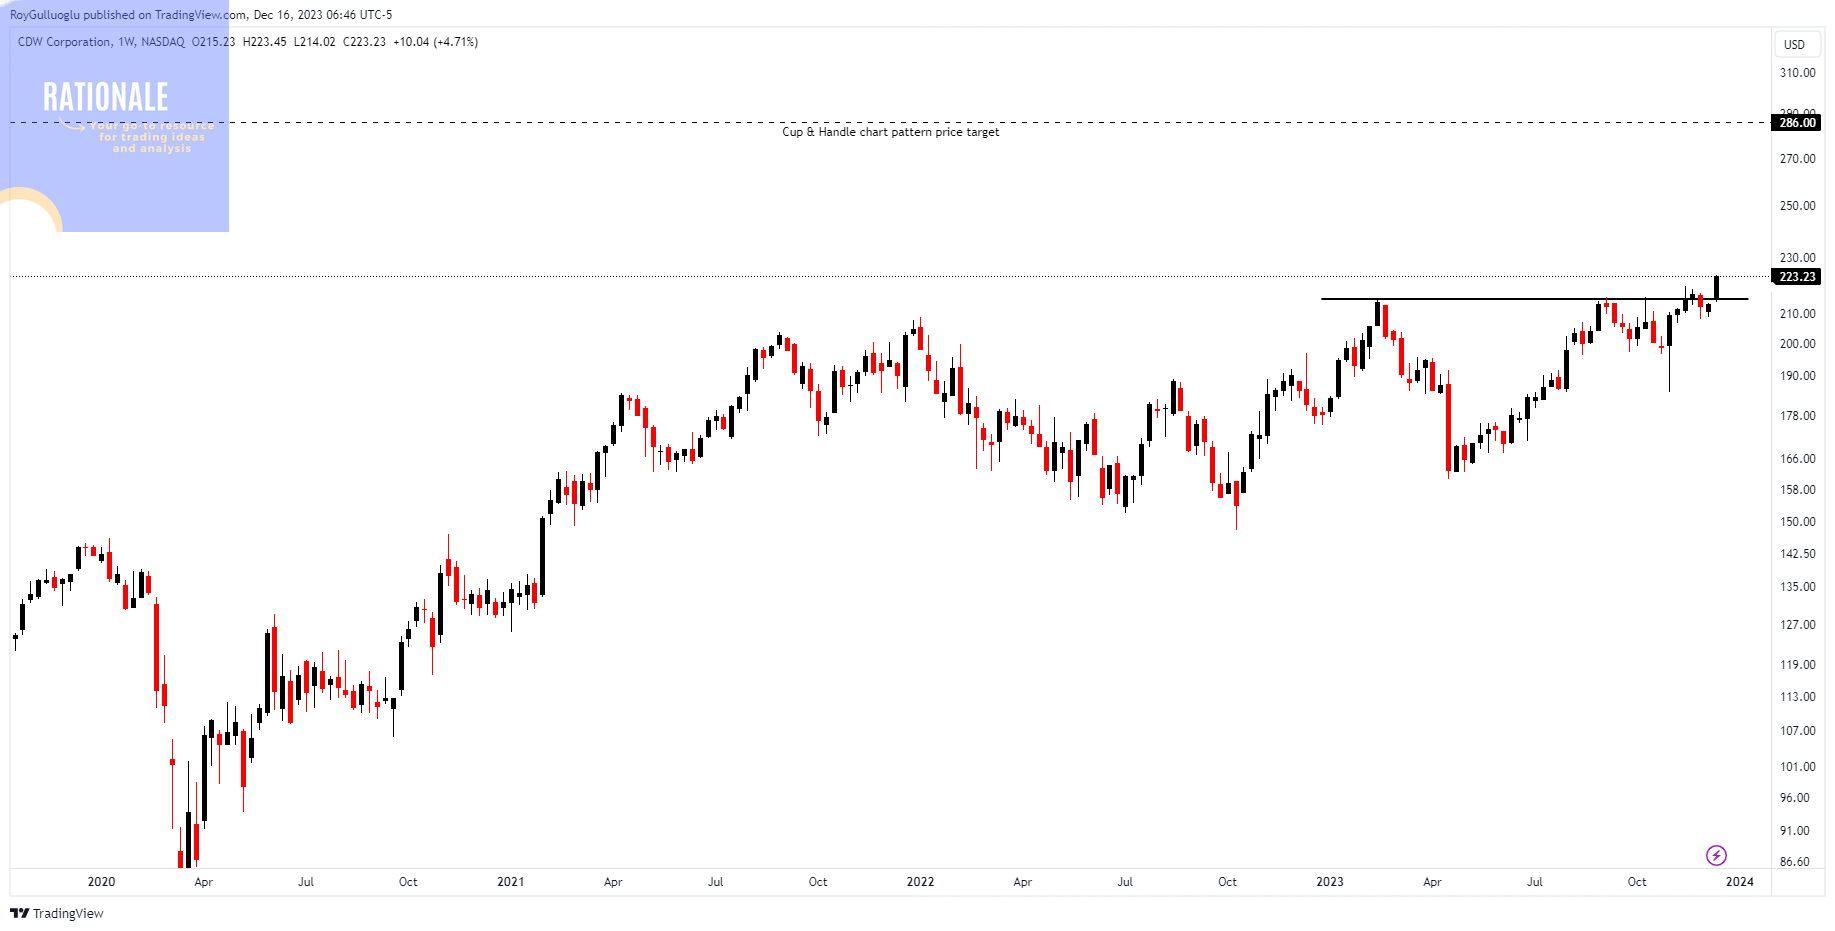
CDW Corporation-(CDW/NASDAQ) - Long Idea
You can click the CDW ticker above to access the first report explaining the RATIONALE behind the trade idea.
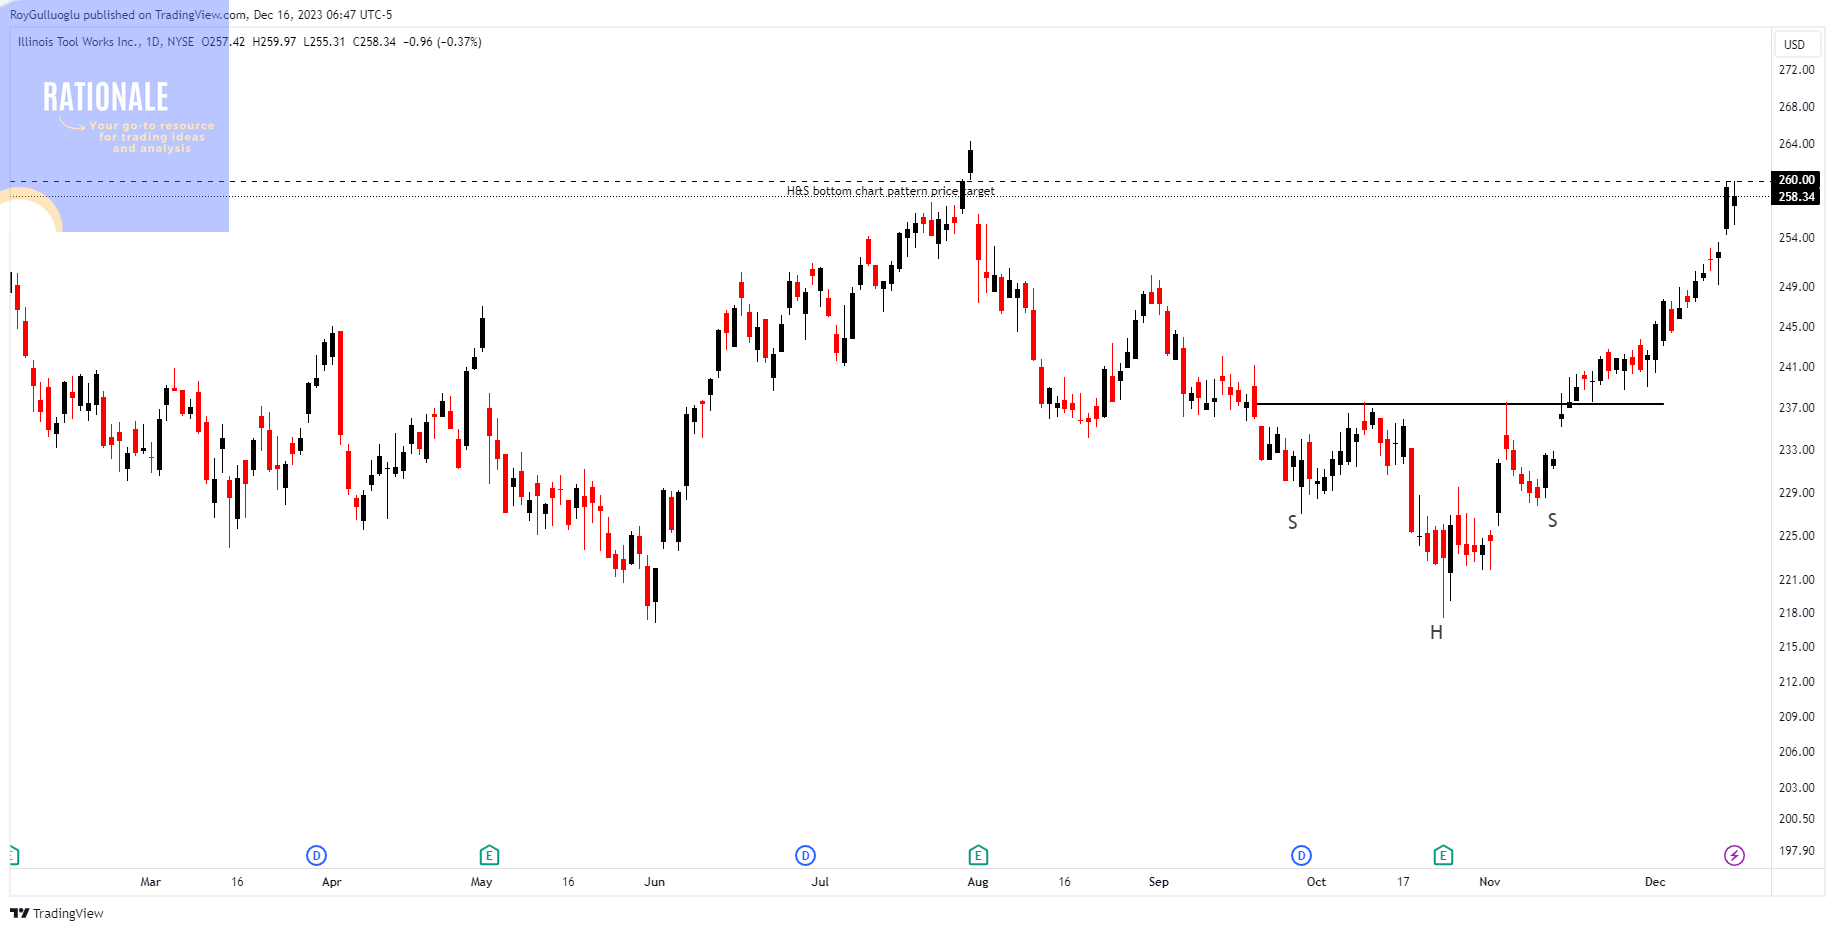
Illinois Tool Works Inc.-(ITW/NYSE) - Long Idea
You can click the ITW ticker above to access the first report explaining the RATIONALE behind the trade idea.
The H&S bottom chart pattern price target is reached.
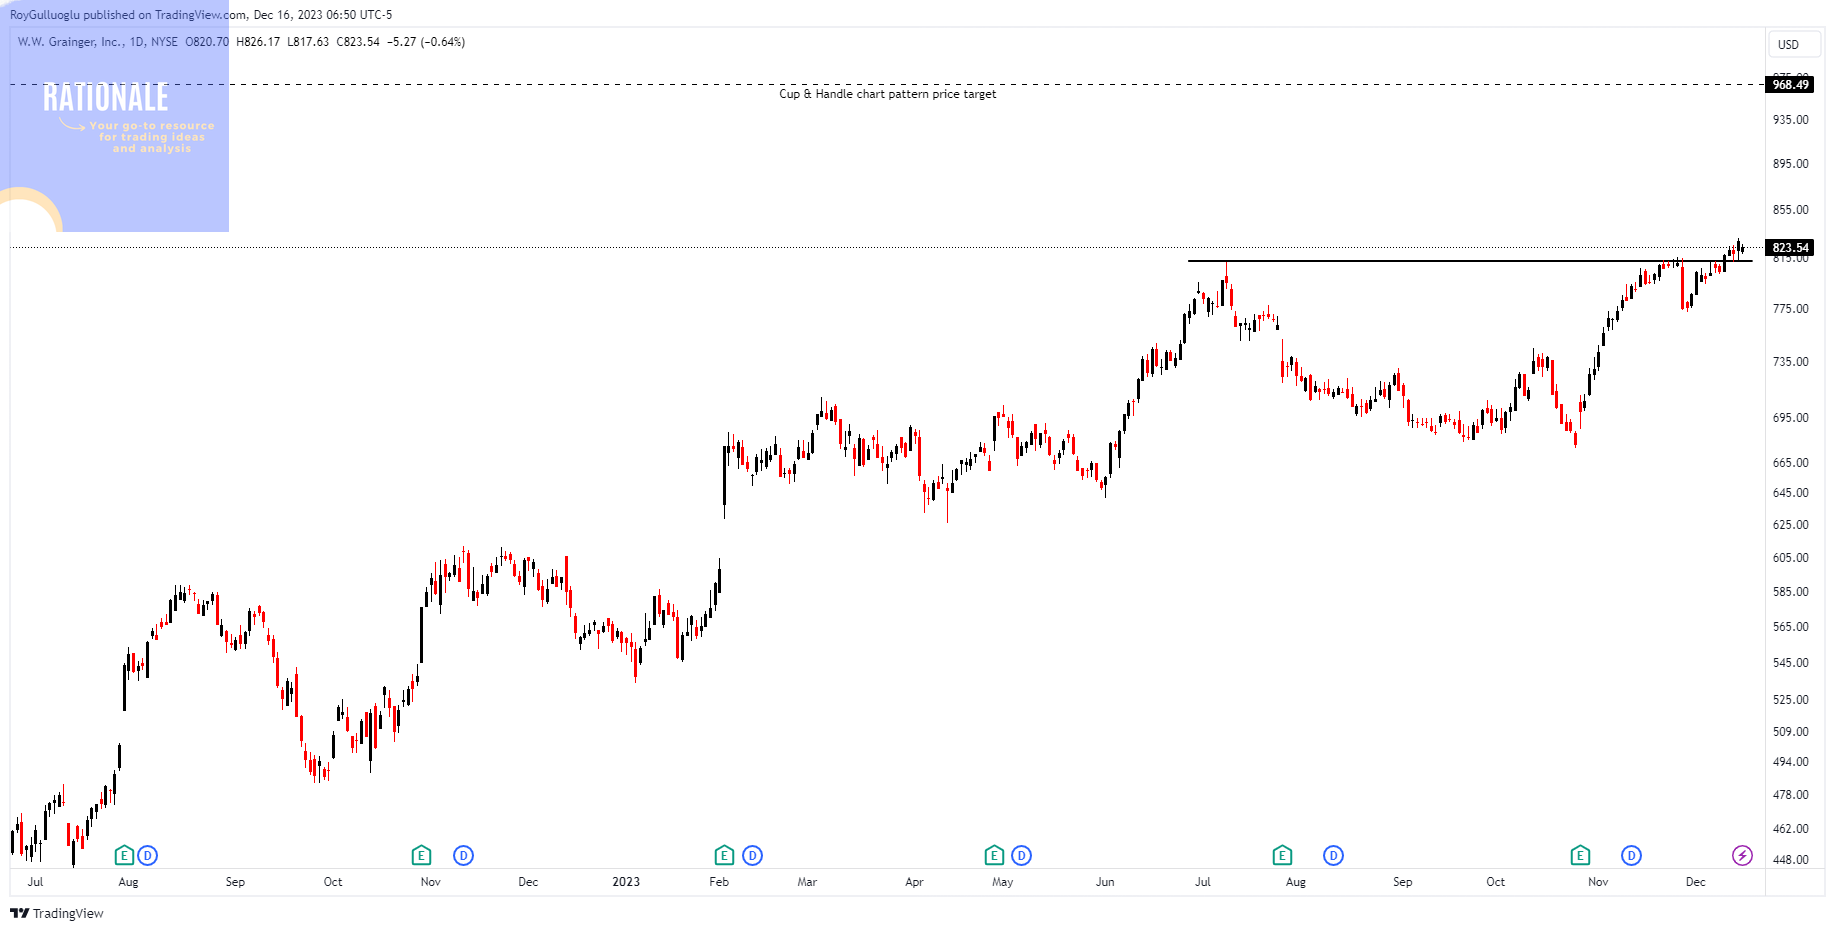
W.W. Grainger , Inc-(GWW/NYSE)-Long Idea
You can click the GWW ticker above to access the first report explaining the RATIONALE behind the trade idea.
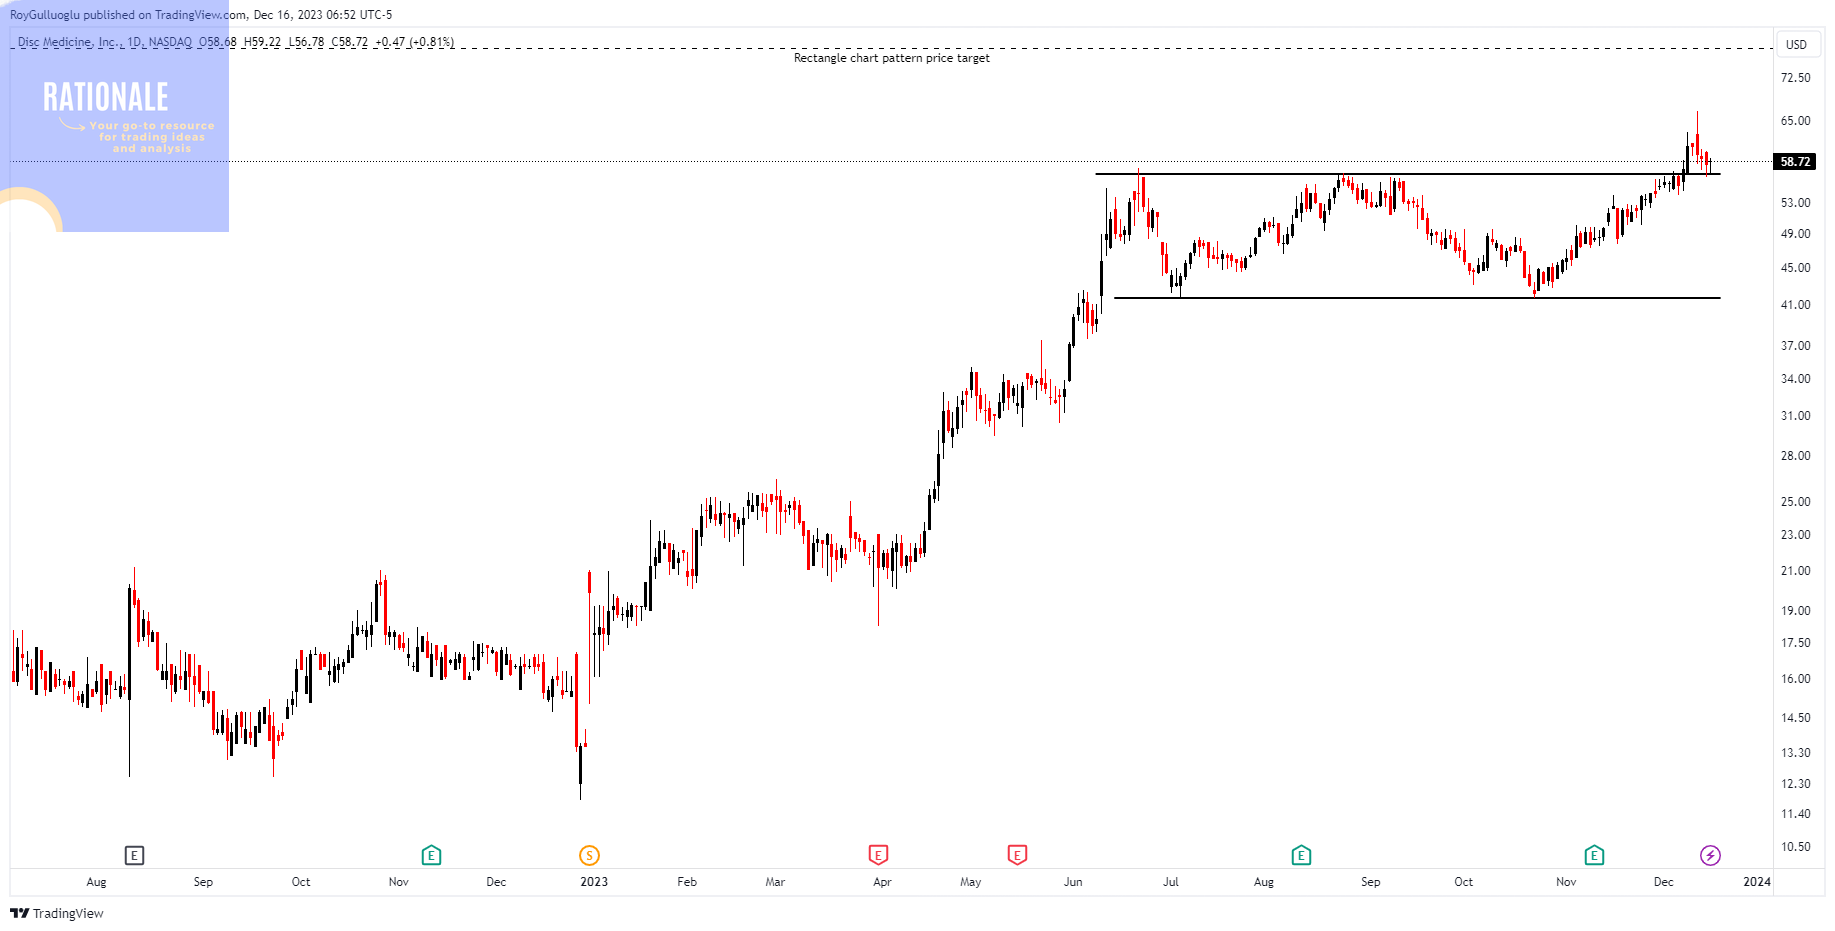
Disc Medicine, Inc-(IRON/NASDAQ)-Long Idea
You can click the IRON ticker above to access the first report explaining the RATIONALE behind the trade idea.
The price pulled back to the horizontal boundary after the breakout.


Thank you. Very nice charts.