


New setups
TICKERS: ROL(NYSE), HON(NASDAQ), SNPS(NASDAQ), DTE(NYSE), CNA(NYSE), AAPL(NASDAQ), MGROS(BIST)
Rollins, Inc.-(ROL/NYSE)-Long Idea
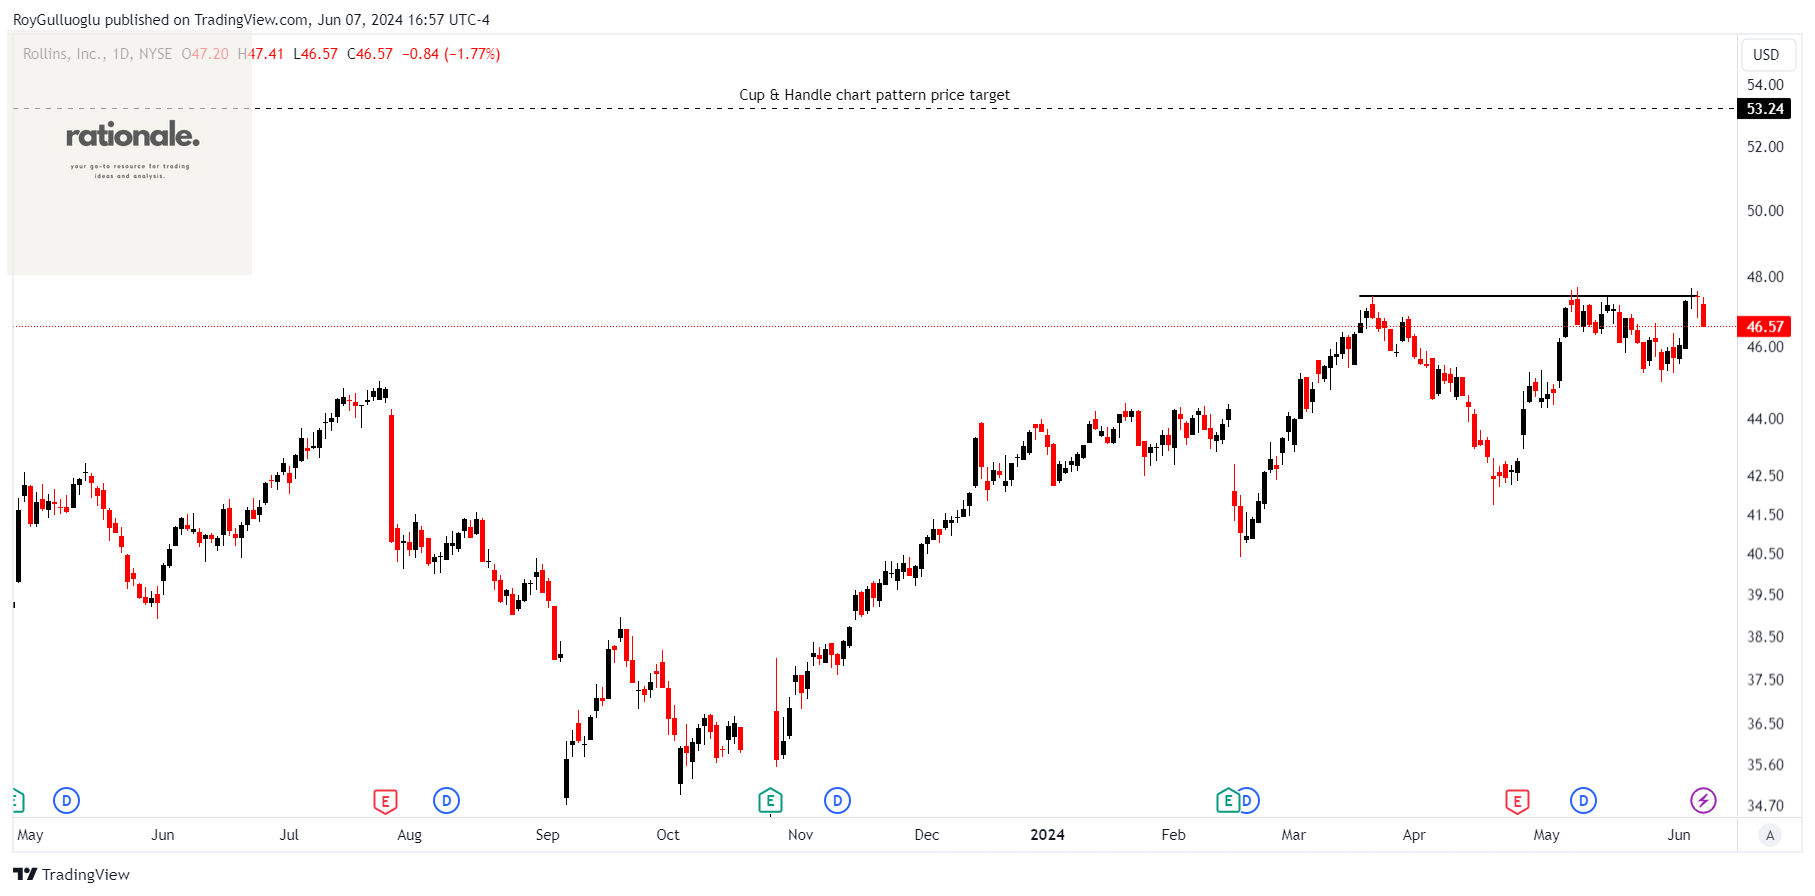
Rollins, Inc., along with its subsidiaries, offers pest and wildlife control services to both residential and commercial customers in the United States and worldwide.
The above daily chart formed an approximately 2-month-long cup & handle chart pattern as a bullish continuation after an uptrend.
The horizontal boundary at 47.45 levels acts as a resistance within this pattern.
A daily close above 48.87 levels would validate the breakout from the 2-month-long cup & handle chart pattern.
Based on this chart pattern, the potential price target is 53.2 levels.
ROL, classified under the "consumer cyclicals" sector, falls under the “Large Cap - Growth” stock category.
Honeywell International Inc.-(HON/NASDAQ)-Long Idea
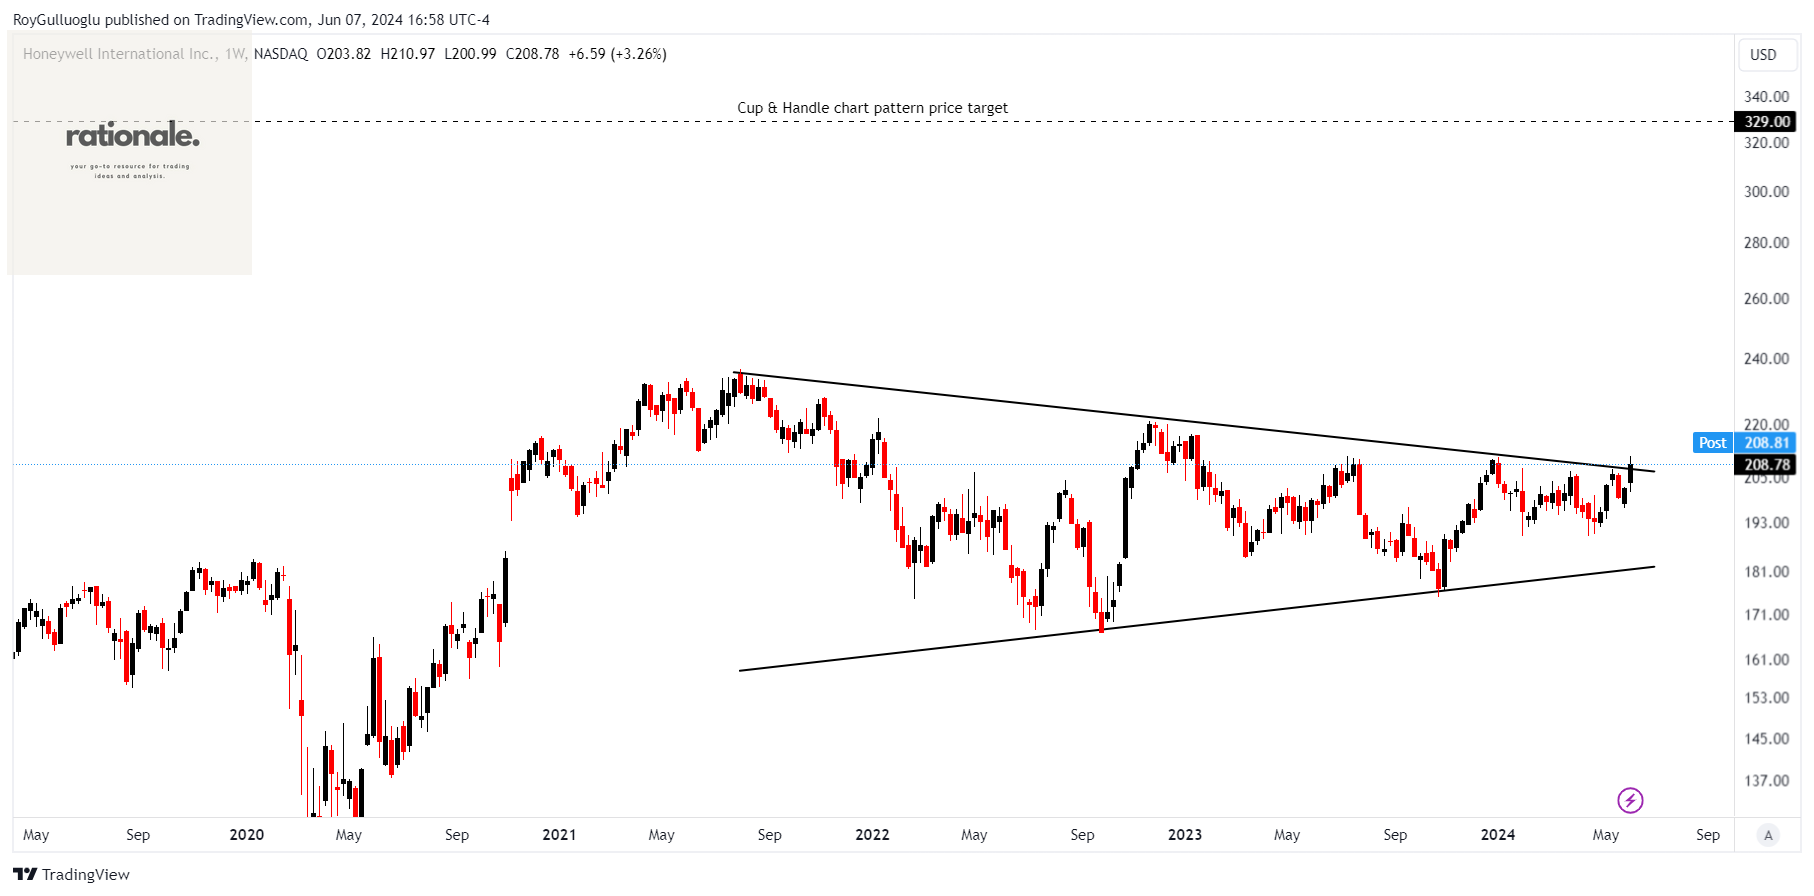
Honeywell International Inc. operates in the aerospace technologies, building automation, energy and sustainable solutions, and industrial automation sectors in the United States, Europe, and globally.
The above daily chart formed an approximately 3-month-long ascending triangle chart pattern as a bullish continuation after an uptrend.
A daily close above 213.7 levels would validate the breakout from the 3-month-long ascending triangle chart pattern.
Based on this chart pattern, the potential price target is 329 levels.
HON, classified under the "industrials" sector, falls under the “Large Cap - Value” stock category.
Synopsys, Inc.-(SNPS/NASDAQ)-Long Idea
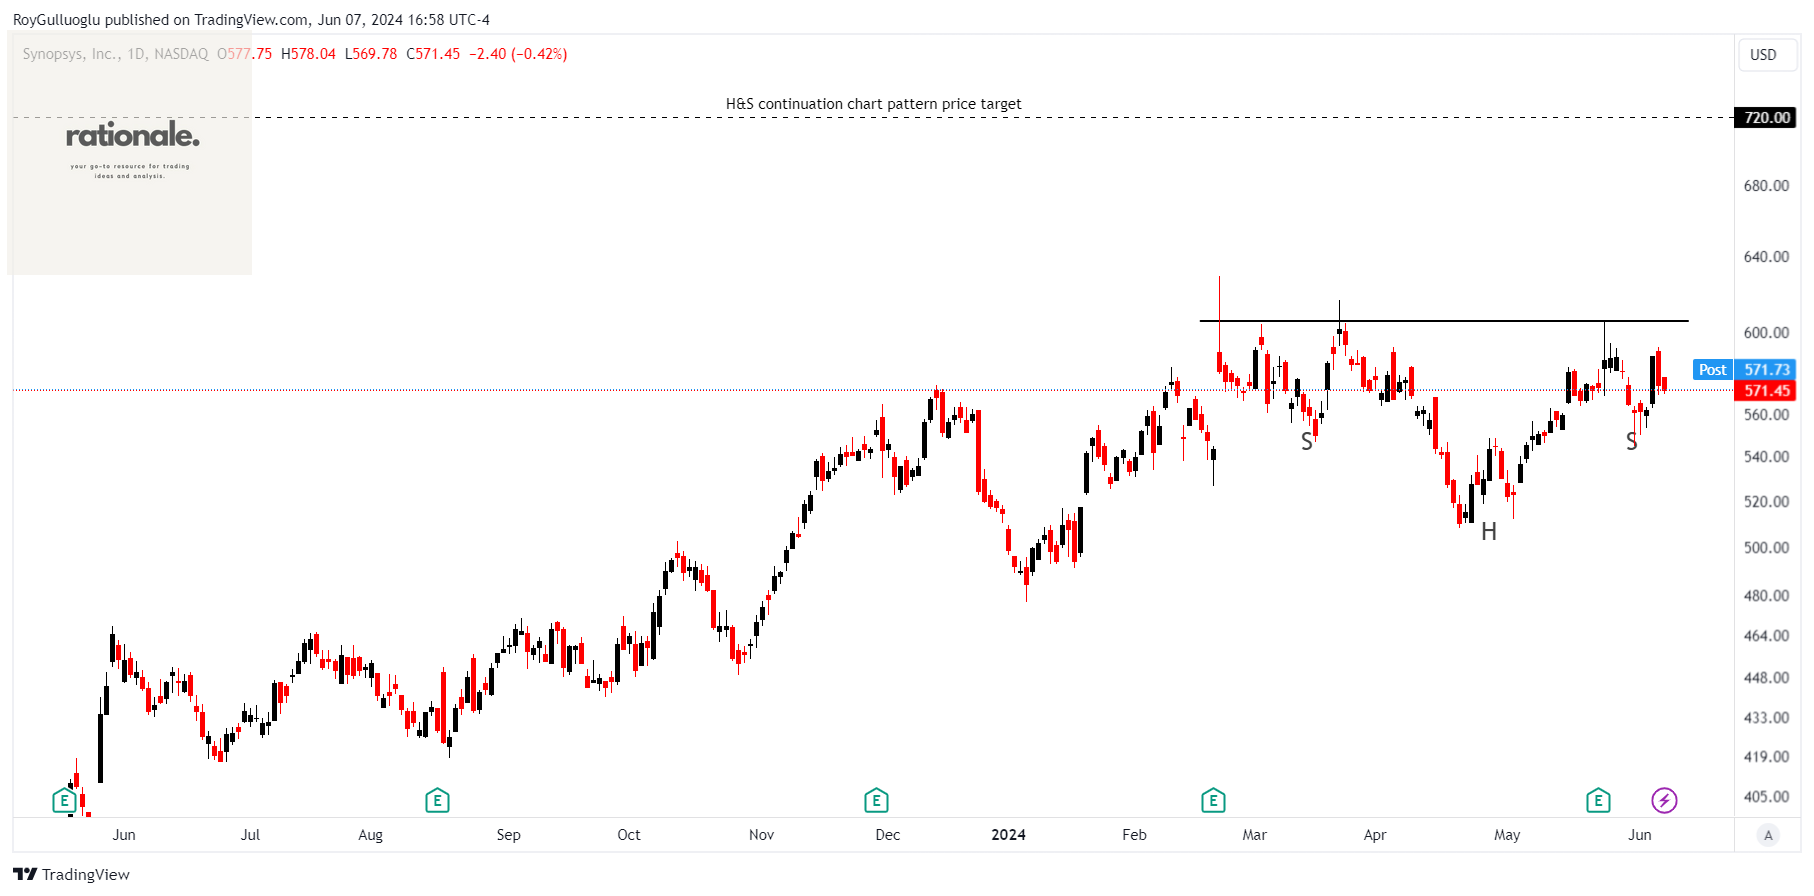
Synopsys, Inc. offers electronic design automation software products for designing and testing integrated circuits. The company operates through three segments: Design Automation, Design IP, and Software Integrity.
The above daily chart formed an approximately 3-month-long H&S continuation chart pattern as a bullish continuation after an uptrend.
The horizontal boundary at 606.1 levels acts as a resistance within this pattern.
A daily close above 624.28 levels would validate the breakout from the 3-month-long H&S continuation chart pattern.
Based on this chart pattern, the potential price target is 720 levels.
SNPS, classified under the "technology" sector, falls under the “Large Cap - Growth” stock category.
DTE Energy Company-(DTE/NYSE)-Long Idea
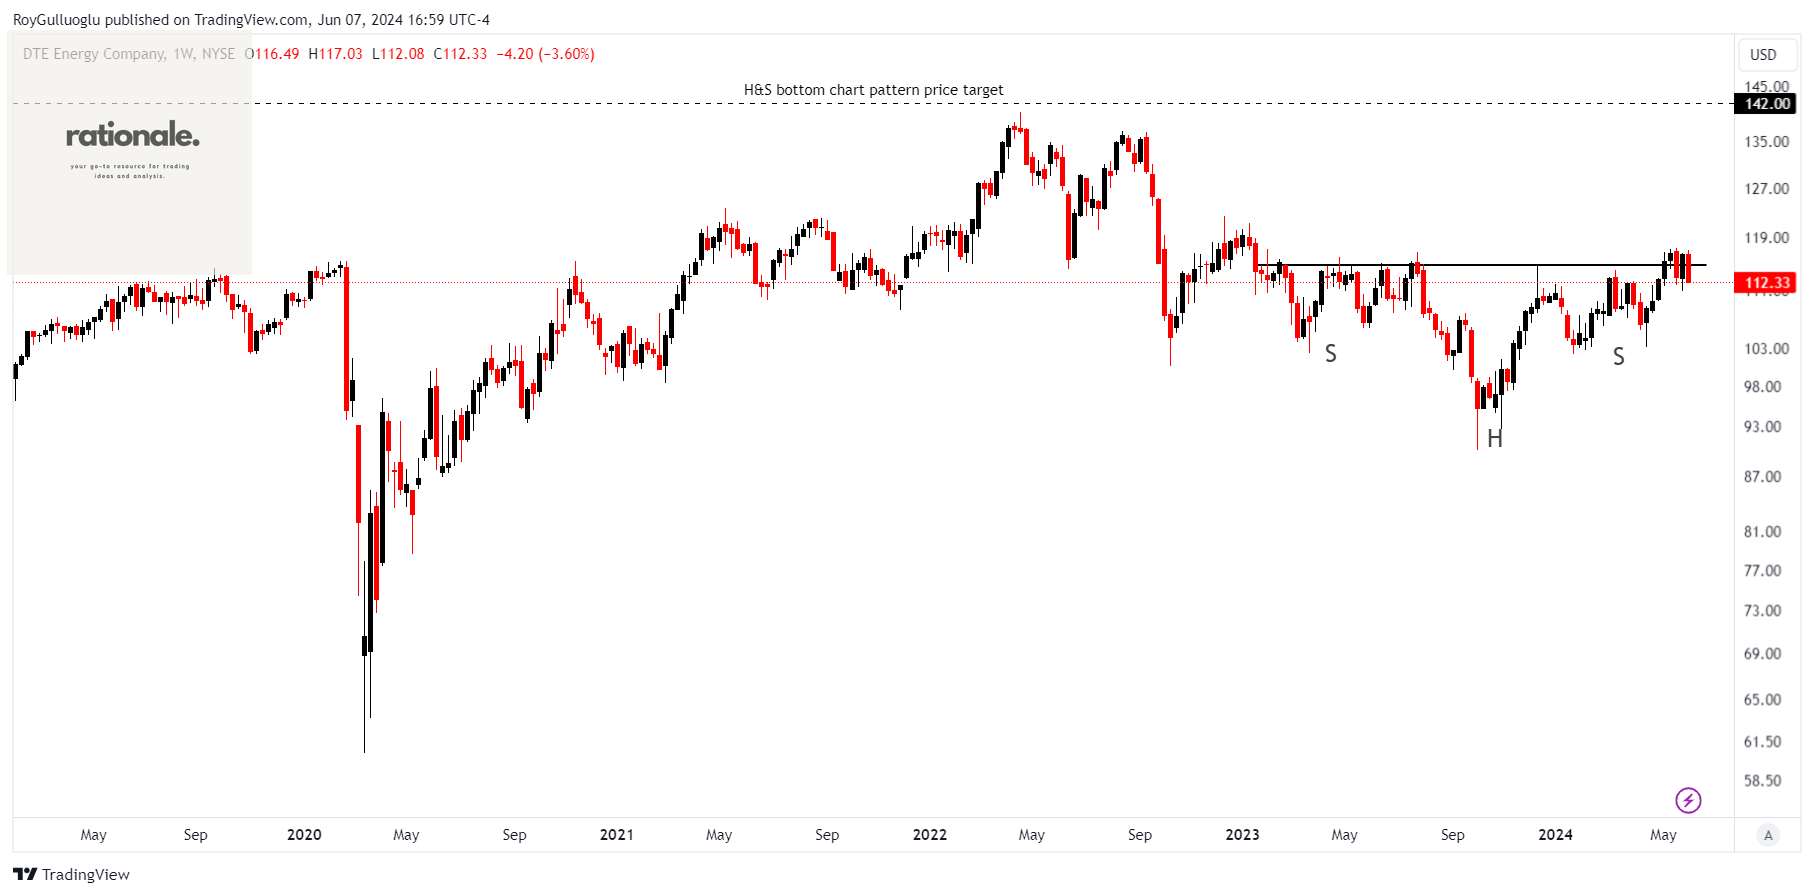
DTE Energy Company is involved in utility operations. Its Electric segment generates, purchases, distributes, and sells electricity to residential, commercial, and industrial customers in southeastern Michigan.
The above weekly chart formed an approximately 17-month-long H&S bottom chart pattern as a bullish reversal after a downtrend.
The horizontal boundary at 114.81 levels acts as a resistance within this pattern.
A daily close above 118.25 levels would validate the breakout from the 17-month-long H&S bottom chart pattern.
Based on this chart pattern, the potential price target is 142 levels.
DTE, classified under the "utilities" sector, falls under the “Large Cap - Income” stock category.
Apple Inc.-(AAPL/NASDAQ)-Long Idea
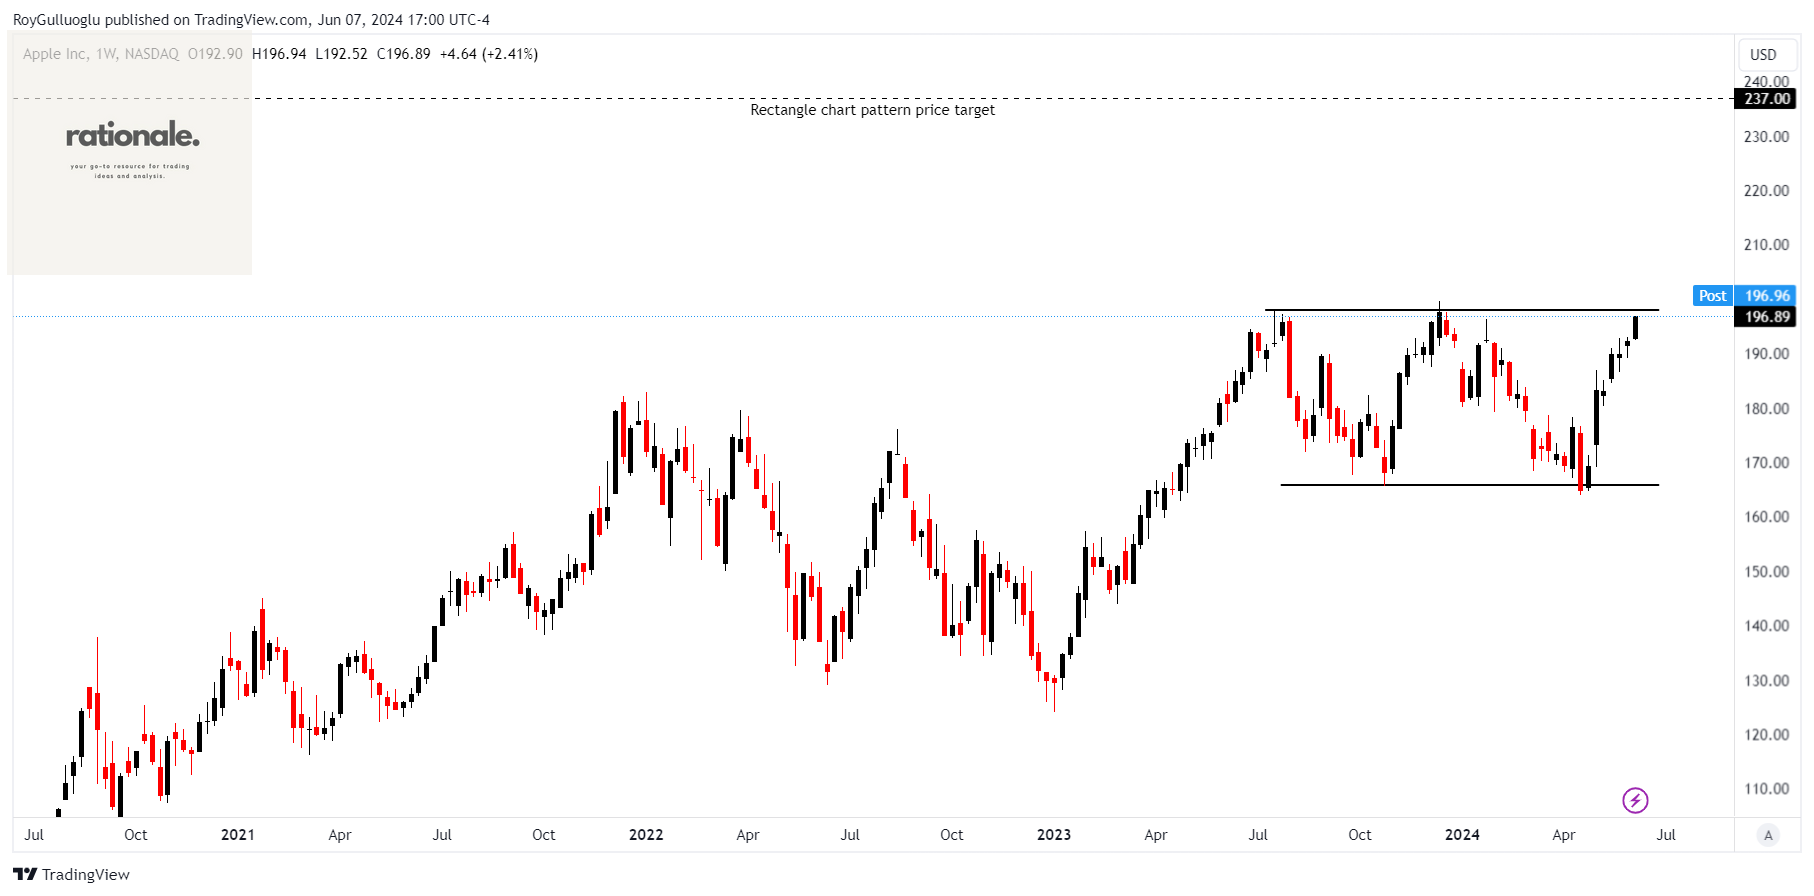
Apple Inc. designs, manufactures, and markets smartphones, personal computers, tablets, wearables, and accessories on a global scale.
The above weekly chart formed an approximately 11-month-long rectangle chart pattern as a bullish continuation after an uptrend.
The horizontal boundary at 198 levels acts as a resistance within this pattern.
A daily close above 204 levels would validate the breakout from the 11-month-long rectangle chart pattern.
Based on this chart pattern, the potential price target is 237 levels.
AAPL, classified under the "technology" sector, falls under the “Large Cap - Growth” stock category.
Migros Ticaret A.S.-(MGROS/BIST)-Long Idea

Migros Ticaret A.S., along with its subsidiaries, engages in the retail sale of food, beverages, consumer goods, and durable goods.
The above daily chart formed an approximately 2-month-long cup & handle chart pattern as a bullish continuation after an uptrend.
The horizontal boundary at 506 levels acts as a resistance within this pattern.
A daily close above 521.18 levels would validate the breakdown from the 2-month-long cup & handle chart pattern.
Based on this chart pattern, the potential price target is 628 levels.
MGROS, classified under the "consumer defensive" sector, falls under the “Mid Cap - Value” stock category.
Teşekkürler